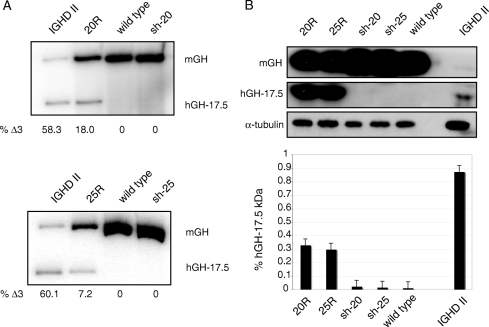
Figure 5.
Silencing of the 17.5-kDa isoform. A, Total RNA was isolated from pituitaries of the indicated genotypes, and RT-PCR was performed with identical primers that distinguish between mGH and hGH. Bands corresponding to the full-length spliced product from the mouse alleles (mGH) and the 17.5-kDa human transgene (hGH-17.5) are as indicated. Quantitation of the two transcripts is based on the ratio of products within a single lane and was calculated by phosphorimager densitometry. B, Western blots of pituitary lysates from the same genotypes as in A were performed with an antibody that recognizes both hGH and mGH. The two upper panels were deliberately overexposed to allow visualization of the GH isoforms in IGHD II mice. A shorter exposure of the same gel is shown in supplemental Fig. 4. α-Tubulin was used as a loading control. The relative amounts of the 17.5-kDa isoform present in the different genotypes are shown in the graph and represent three independent experiments. Error bars are sem.

