Abstract
Dendritic cells (DC) play a pivotal role in shaping the immune response in both physiological and pathological conditions. In peripheral blood at least two subsets, the myeloid and plasmacytoid, have been described as having different T stimulatory functions and a variable degree of maturation. Certainly, antigen presentation plays a crucial role in the pathogenesis of coeliac disease and circulating immune cells are thought to reflect the state of immune response within the gut. Therefore, we aimed to investigate the quantitative and phenotypical modifications of peripheral blood DC, together with their functional properties, in this pathological condition. Blood samples from 11 untreated patients before and after a course of gluten-free diet, 27 treated patients and 14 controls underwent flow-cytometric analysis, while immunomagnetically sorted DC from the CD patients and eight human leucocyte antigen (HLA)-DQ2/8+ bone marrow donors were used to evaluate maturation status through the CD83 expression, cytokine profile for interleukin (IL)-6, IL-10, IL-12 and interferon (IFN)-α by enzyme-linked immunosorbent assay (ELISA), and functional properties by mixed leucocyte reaction before and after pulsing with digested gliadin. We found that in both untreated and treated patients, a significant reduction of the entire DC population, mainly the plasmacytoid subset, in comparison to healthy controls was observed. In active disease, an impaired allogenic lymphocyte reaction and a significant reduction of IFN-α production, paralleled by the presence of a more immature status, were also demonstrated. All the latter modifications have been reverted by pulsing DC with digested gliadin.
Keywords: coeliac disease, cytokines, dendritic cells, flow cytometry, peripheral blood
Introduction
Dendritic cells (DC) are professional antigen-presenting cells having an amazing capacity to orchestrate both innate and adaptive immune response, as well as to maintain immune tolerance [1]. Their progenitors in the bone marrow give rise to circulating precursors that home to peripheral tissues where they recognize antigens and undergo transition from immature antigen-capturing cells to mature antigen-presenting cells [2]. DC maturation includes the expression of human leucocyte antigen (HLA) class II-bearing antigens and co-stimulatory molecules on the cell surface that determine the ability of naive T cells to expand [1,2]. Because DC may migrate from peripheral tissues, both immature and mature cell populations are present in peripheral blood [2]. Furthermore, irrespective of their maturation, two main subsets are distinguished on the basis of a different expression of surface molecules: the myeloid (mDC, CD11c+) and the plasmacytoid-derived DC (pDC, CD123+) [3–5]. Even though DC exhibit a considerable plasticity, the profile of T cell polarizing cytokines is also dependent upon the type of antigen encountered and local environmental factors [6,7].
Coeliac disease (CD) is an autoimmune enteropathy whose immunological hallmark is a breakdown of the peripheral tolerance towards wheat gluten proteins and related prolamins [8]. The strong association with HLA class II molecules suggests the relevance of gluten peptide presentation to effector immune cells [9]. Indeed, it has been shown recently that DC, as well as macrophages, accumulate in coeliac intestinal lesions and activate gluten reactive T cells efficiently [10]. Because circulating immune cells have been thought to reflect the state of immune response within the gut [11,12], and CD may be considered a systemic disease, in the present study we searched for a putative modification of the immune phenotype and functional properties of circulating DC in this pathological condition. It is noteworthy that the presence of an important derangement of blood DC in another two autoimmune diseases, such as systemic lupus erythematosus [13] and type 1 diabetes [14], together with the recent demonstration that patients suffering from inflammatory bowel diseases experienced a significant drop of circulating DC that correlates with disease activity [15], all strengthen our purpose.
By using multi-parameter flow cytometry [16] and applying new dendritic cell specific antibodies, such as blood dendritic cell antigens (BDCA)-1–4 [17], we found an important depletion of peripheral DC, mainly the plasmacytoid subset, in both active and treated CD. In addition, our functional experiments clearly demonstrated an impaired ability of DC to induce the allogenic T cell proliferative response, due probably to their immaturity, which disappeared upon pulsing with digested gliadin.
Patients and methods
Patients
Samples of whole peripheral blood were obtained from 11 CD patients before and after a course of at least 12 months of gluten-free diet, 27 treated CD patients and 14 healthy subjects (hereafter indicated as controls) undergoing upper gastrointestinal endoscopy for functional dyspepsia. All patients and controls were enrolled consecutively at the Day Service of Gastroenterology, First Department of Medicine, IRCCS Policlinico San Matteo Foundation of Pavia, Italy, between January 2005 and December 2006, and each patient gave informed consent to participate in the study after obtaining approval from the local Ethical Committee. Their clinical features are reported in Table 1. Patients with an uncertain diagnosis or poor mucosal recovery, as well as controls using steroidal or non-steroidal anti-inflammatory drugs or presenting an inflamed mucosa at histology, were excluded from the study.
Table 1.
Clinical and pathological features of patients and controls.
| Coeliac disease before/after GFD | Treated coeliac disease | Healthy controls | |
|---|---|---|---|
| F:M | 7:4 | 18:9 | 6:8 |
| Mean age ± s.e.m. (years) – (range) | 44 ± 6/45 ± 7 (32–57) | 43 ± 11 (18–71) | 36 ± 8 (21–54) |
| DQ2:DQ8 haplotype | 10:1 | 16:1 (10 n.d.) | n.d. |
| Anti-endomysial antibody | +/− | – | – |
| Histology Marsh Oberhuber | 3 (a,b,c)/1–2 | 1–2 | 0 |
| Associated conditions* | 6 | 18 | 0 |
| GFD ± s.e.m. (months) | 0/14 ± 2 | 38 ± 12 | – |
n.d. = Not detected
autoimmune diseases, osteoporosis, infertility, hypertransaminasaemia, hyposplenism; s.e.m. = Standard error mean.
For functional experiments, blood samples from an additional eight healthy subjects selected from the bone marrow donors (all adult females, carrying the HLA-DQ2 or -DQ8 phenotypes, hereafter indicated as bone marrow donors), in whom no anti-endomysial antibodies were detected in the absence of IgA deficiency, were used.
Monoclonal antibodies for DC analysis
The immune phenotyping of fresh peripheral blood DC from each patient and control subject was performed on samples of 1 × 10⁶ mononuclear cells obtained previously by means of Ficoll density gradient centrifugation (Ficoll-Paque Plus, Amersham Biosciences, Amersham, Bucks, UK). The following mouse anti-human monoclonal antibodies were used: fluorescein isothiocyanate (FITC)-labelled anti-CD3, -CD19, -CD20, -CD14, -HLA-DR, phycoerythrincyanin 5 (PC5)-labelled anti-HLA-DR, phycoerythrin (PE)-labelled anti-CD19 (Coulter, Miami, FL, USA); FITC-labelled anti-CD11b, -CD16, -CD34, PE-labelled anti-CD11c (Immunotech, Marseille, France); FITC-labelled anti-CD56 (Southern Biotechnology; Birmingham, UK); PE-labelled anti-CD83, -CDw123 (BD Pharmingen, San Jose, CA, USA); FITC-labelled anti-BDCA-1, anti-BDCA-2 and PE-labelled anti-BDCA-3 (Miltenyi Biotech GmbH, Bergisch Gladbach, Germany).
Quantification and immune phenotyping of DC
According to the literature [4,5,16], DC were detected as HLA class II expressing cells (HLA-DR+) and lacking in markers of T cells (CD3, CD11b), B cells (CD19, CD20), natural killer (NK) cells (CD16, CD56), monocytes/macrophages (CD14) and haematopoietic progenitor cells (CD34). Furthermore, DC subsets were identified by using two approaches: (a) calculating the percentage of circulating DC when gated as lineage–, HLA-DR+ and identified as mDC or pDC according to the expression of CD11c and CD123, respectively; (b) using three specific markers: BDCA-1 (CD11chigh/CD123low, mDC), BDCA-2 (CD11c–/CD123high, pDC) and BDCA-3 (CD11clow/CD123–, mDC) [17]. Cells labelled with PE-, FITC- and PC5-conjugated isotype monoclonal antibodies that were non-reactive to human cells were used as controls to determine the background of fluorescence. Samples were incubated with the appropriate monoclonal antibodies for 10 min at room temperature in the dark, washed twice, centrifuged and resuspended in 1 ml of the phosphate-buffered saline (PBS) solution. One hundred thousand events were analysed for each sample with an epics xl.mcl (Instrumentation Laboratory; Milan, Italy) flow cytometer equipped with a 480-nm argon ion laser and three fluorescence detectors with filter setting for FITC (530 nm), PE (585 nm) and PC5 (670 nm). The investigator performing the analysis was blinded regarding the origin of the samples from patients versus normal controls. After instrument setting with a calibrated microsphere DNA Check (Coulter), forward-scatter (FSC) and side-scatter (SSC) gates were set to exclude erythrocytes and debris. Finally, DC absolute number was determined by applying a formula as indicated in the manufacturer's instructions (Miltenyi).
Isolation of DC and T lymphocytes
For functional experiments, peripheral blood samples were collected from the 11 CD patients before and in six patients also after a course of gluten-free diet, 10 of 27 treated patients and the eight bone marrow donors to isolate mononuclear cells by using a Ficoll density gradient centrifugation (Amersham). A fresh buffy coat was also used for each experiment. After separation and washing twice, cells were recovered and suspended in RPMI-1640 medium (Gibco, Life Technologies Ltd, Paisley, UK) supplemented with 10% pooled, inactivated human serum, plus 100 U/ml of penicillin and 100 µg/ml of streptomycin. The viability of the single cell suspension was determined by trypan blue dye exclusion and cells were not used if viability was below 95%. From this cell population, DC from the CD patients and bone marrow donors and T lymphocytes from the buffy coats were purified immunomagnetically as a negative selection using the Blood Dendritic Cell Isolation Kit II and the Pan T Cell Isolation Kit II, respectively (both from Miltenyi), following the manufacturer's instructions. After determination of purity as the presence of more than 95% of HLA-DR+/lineage– cells for DC and of CD3+ cells for T lymphocyte at flow cytometric analysis, the isolated DC and T cells were suspended separately in culture medium to be used for mixed leucocyte reaction, cytokine profiling and evaluation of maturation status. Furthermore, when available, samples of 1 × 10⁶ DC were pulsed for 20 h with 100 µg/ml α-chymotrypsin-treated wheat gliadin (ct-gliadin, see below), or with culture medium as negative control, or with 1 µg/ml lipopolysaccharide (Sigma-Aldrich, St. Louis, MO, USA) as positive control, and used for functional experiments. Finally, a sample of 2 × 10⁵ DC from each patient and bone marrow donor was spun down on slides in a cytocentrifuge (Cytospin, Shandon, Pittsburg, PA, USA), fixed with cold methanol and stained with May–Grünwald–Giemsa to undergo morphological analysis at light mycroscopy (Zeiss Axioplan 2, Oberkochen, Germany).
Wheat gliadin preparation
Wheat gliadin was digested by α-chymotrypsin (both from Sigma-Aldrich) according to a method described previously [18]. Briefly, both powders were solubilized in 174 mM Tris/HCl pH 7.8, containing 2 M urea (100:1 w/w, protein:enzyme ratio) and incubated overnight at 37°C. After centrifugation at 1500 g for 15 min at room temperature, the supernatant was sterilized by filtering through 0.2-µm Acrodisc Syringe Filter and aliquots were stored at −20°C until requested.
Mixed leucocyte reaction
Pulsed and unpulsed DC were plated in triplicate in 200 µl of culture medium with allogenic T cells at different ratios (1:10, 1:50, 1:100) in 96-well, flat-bottomed microwell plates for 5 days. Each culture was then incubated with [3H]-thymidine (1 µCi/well, Amersham-Pharmacia) and harvested after 18 h, when incorporated radioactivity was measured in a liquid scintillation counter and expressed as counts per minute. For each experiment, separate cultures were carried out of T lymphocytes alone and T lymphocytes plus 1 µg of phytohaemagglutinin as negative and positive controls, respectively. A positive T cell response was defined as a stimulation index calculated by dividing the mean counts per minute of T cells cultured in the presence of DC by the mean counts per minute of T cells alone. A stimulation index of 3 or more was considered positive.
A parallel series of co-cultures was set up in the slide chambers to study the putative cognate interaction between DC and T lymphocytes at computer-aided microscopy. Digital pictures were made by using a Leica system (photocamera Leica DFC 320 and software Leica IM500; Leica Microsystems GmbH, Wetzlar, Germany).
Cytokine profiling
Quantification of interleukin (IL)-6, IL-10, IL-12p70 and interferon (IFN)-α was performed by enzyme-linked immunosorbent assays (ELISA) from the supernatants of 24-h cultured DC sorted from coeliac patients and bone marrow donors following the manufacturer's instructions (Pierce Endogen, Rockford, IL, USA). IFN-α production was also determined on supernatants of ct-gliadin-pulsed DC.
Statistical analysis
Statistical comparisons between mean values were performed using the Mann–Whitney U-test for non-parametric data and a P level of less than 0.05 was considered statistically significant.
Results
Dendritic cell characterization
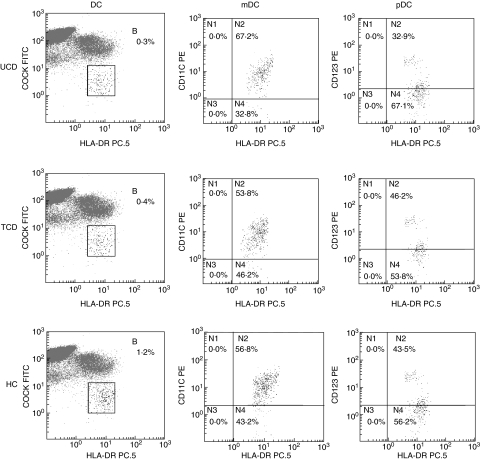
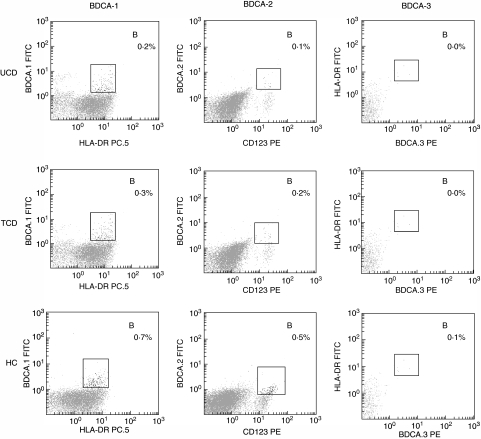
Although no difference was found in the absolute number of white blood cells between CD patients and controls, a statistically significant reduction of the absolute number of DC in both untreated and treated CD patients in comparison to controls was observed, together with a decrease of the pDC subset, as shown in Table 2. The mDC/pDC ratio was therefore increased greatly in both coeliac groups in comparison to the control group. Because the results obtained from the 11 CD patients after gluten-free diet mirrored those from all the other treated patients, the data were considered together. Furthermore, even though the two types of immunophenotypical characterization of peripheral blood DC identify cellular subsets which do not completely overlap [17], the method based on BDCA detection also revealed the reduction of the plasmacytoid subset in both untreated and treated coeliac patients in comparison to controls, as shown in Table 2. Figures 1 and 2, for each one of the two methods used, show representative flow cytometric profiles of untreated, treated CD patients and controls, while in Fig. 3 the isotype control panels for the BDCA antibody series are given.
Table 2.
Dendritic cell characterization.
| Untreated coeliac disease patients | All treated coeliac disease patients | Healthy subjects | |
|---|---|---|---|
| WBC | 6841 ± 673 | 5925 ± 999 | 6406 ± 570 |
| DC* | 22.32 ± 2.14 (P = 0.009 versus HC) | 24.30 ± 5.64 (P = 0.004 versus HC) | 35.00 ± 7.07 |
| mDC* | 14.06 ± 1.85 | 13.12 ± 2.87 | 16.33 ± 6.53 |
| pDC* | 9.40 ± 2.47 (P = 0.001 versus HC) | 12.10 ± 3.30 (P = 0.001 versus HC) | 18.33 ± 3.40 |
| mDC/pDC | 1.72 ± 0.43 (P = 0.008 versus HC) | 1.33 ± 0.40 (P = 0.04 versus HC) | 0.96 ± 0.37 |
| BDCA-1* | 17.50 ± 1.90 | 15.60 ± 5.09 | 18.33 ± 5.47 |
| BDCA-2* | 8.20 ± 1.15 (P = 0.001 versus HC) | 9.01 ± 3.69 (P = 0.001 versus HC) | 16.67 ± 3.67 |
| BDCA-3* | 0.33 ± 0.24 | 0.34 ± 0.12 | 0.22 ± 0.16 |
WBC = white blood cells (expressed as number/µl), DC = dendritic cells (expressed as number/µl)
absolute values. BDCA = blood dendritic cell antigen.
Fig. 1.
Phenotype characterization of peripheral blood dendritic cells (I). Multi-parameter flow-cytometric analysis of circulating dendritic cells by using the method (a) as described in the Methods section. Dendritic cells (DC) from one representative case of untreated coeliac disease (UCD) as appears in the upper panels, one representative case of treated coeliac disease (TCD) in the central horizontal panels and one representative case of healthy control (HC) in the lower panels were detected as human leucocyte antigen-D related (HLA-DR) positive cells lacking the staining with a cocktail of fluorescein isothiocyanate (FITC)-conjugated monoclonal antibodies (COCK FITC) recognizing the lineage-associated antigens as listed in the Methods section. DC subsets were identified as myeloid DC (mDC) in the central vertical panels, or plasmacytoid DC (pDC) in the right panels according to the expression of the markers CD11c or CD123, respectively. The results are shown as percentages in the upper right side (indicated as B or N2) of each dot plot.
Fig. 2.
Phenotype characterization of peripheral blood dendritic cells (II). Multi-parameter flow-cytometric analysis of circulating dendritic cells by using the method (b) as described in the Methods section. Dendritic cell subsets from one representative case of untreated coeliac disease (UCD) as appears in the upper panels, one representative case of treated coeliac disease (TCD) in the central horizontal panels and one representative case of healthy control (HC) in the lower panels were detected by using monoclonal antibodies towards three specific markers called blood dendritic cell antigens (BDCA)-1, BDCA-2 and BDCA-3 as shown in the left, central and right vertical panels, respectively. The results are shown as percentages in the upper right side (indicated as B) of each dot plot.
Fig. 3.
Isotype controls of blood dendritic cell antigens. The isotype control of blood dendritic cell antigen (BDCA)-1 is shown in the left panel, the control of BDCA-2 (R6 low) is shown in the central panel, and that of BDCA-3 (R6 high) is shown in the right panel.
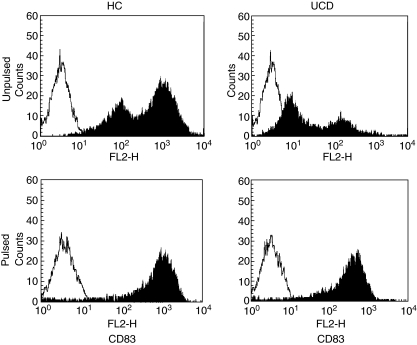
The evaluation of DC maturation through the CD83 marker [19] showed a significantly lower expression in active CD patients in comparison to treated patients and the bone marrow donor group (P < 0.001 for both), indicating the presence of a more immature circulating DC population (Fig. 4, upper panels). In the treated group, a pattern similar to that found in bone marrow donors was observed (data not shown). However, when pulsing DC from untreated coeliacs with ct-gliadin, recovery of the maturation status was observed (Fig. 4, lower panels).
Fig. 4.
Maturation status of pulsed and unpulsed peripheral blood dendritic cells. Flow cytometric profiles of CD83 expression of unpulsed dendritic cells (upper panels) from one representative case of healthy control (HC) and one representative case of untreated coeliac disease (UCD) are shown. Filled histograms represent the staining with the antibody anti-CD83 and empty histograms represent the staining with an isotype control antibody. A shift towards the left side of the panel with a parallel reduction of the histogram height in the UCD patient in comparison to HC is clearly evident, indicating the presence of an immature status. After pulsing dendritic cells with digested gliadin (lower panels), a shift toward the right side with a parallel increase of the histogram height in UCD, indicating a mature status similar to that found in healthy controls, was observed.
Mixed leucocyte reaction
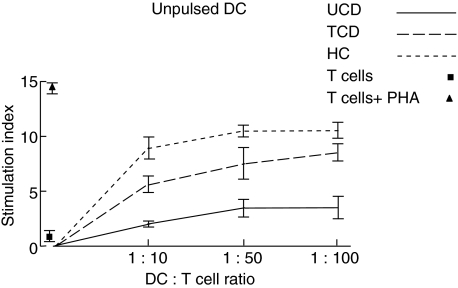
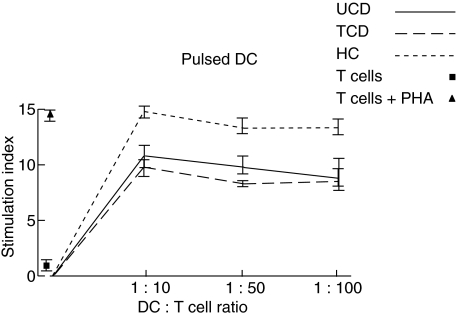
The ability of peripheral blood DC to stimulate a lymphocyte proliferative response was tested by using the mixed leucocyte reaction. In physiological conditions, freshly isolated DC were able to give rise to a significant increase of primary T cell response in comparison to T cells alone at all the DC:T cell ratios examined (Fig. 5). Also, in both active and treated CD conditions, the induced T cell proliferation was consistently higher with respect to unstimulated T cell at all the DC:T cell ratios examined, with the sole exception of the 1:10 DC:T cell ratio of active patients. However, the level of stimulation was always lower than in bone marrow donors, even more so when active patients were considered (Fig. 5). When studying ct-gliadin-pulsed DC, again the strongest T cell response was observed for DC isolated from bone marrow donors and at the 1:10 DC:T cell ratio (Fig. 6). Interestingly, DC isolated from untreated CD patients recovered their stimulation ability, which appeared comparable with that of the treated group, even though at a lower level than bone marrow donors. Similarly to the latter condition, the higher peak was at the 1:10 ratio. Finally, in all cases, DC stimulated with lipopolysaccharide gave rise to a high T cell proliferation rate of the same magnitude as that observed for ct-gliadin-pulsed DC from bone marrow donors (data not shown).
Fig. 5.
Mixed leucocyte reaction with unpulsed dendritic cells. The capacity of freshly purified dendritic cells (DC) from peripheral blood samples of untreated coeliac disease patients (UCD), treated coeliac disease patients (TCD) and healthy controls (HC) to stimulate a primary T cell response at three different DC:T cell ratios is shown. The proliferative rate (y-axis) was assessed by the uptake of [3H]-thymidine and a positive T cell response was defined as a stimulation index of 3 or more as described in the Methods section. The values of the stimulation index of T cells cultured in the absence of DC with or without phytohaemagglutinin (PHA) used as positive and negative controls, respectively, are also shown. Results represent the mean ± standard error of the mean of triplicate cultures and are representative of at least four experiments.
Fig. 6.
Mixed leucocyte reaction with pulsed dendritic cells. The ability of pulsed dendritic cells (DC) from peripheral blood samples of untreated coeliac disease patients (UCD), treated coeliac disease patients (TCD) and healthy controls (HC) to stimulate a primary T cell proliferative response at three different DC:T cell ratios is shown. The proliferative rate (y-axis) was assessed by the uptake of [3H]-thymidine and a positive T cell response was defined as a stimulation index of 3 or more as described in the Methods section. The values of the stimulation index of T cells cultured in the absence of DC with or without phytohaemagglutinin (PHA) used as positive and negative controls, respectively, are also shown. Results represent the mean ± standard error of the mean of triplicate cultures and are representative of at least four experiments.
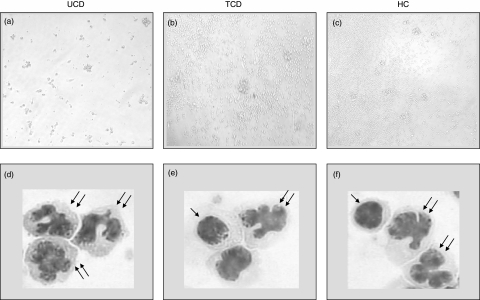
With regard to the microscopic feature of the DC:T cell co-cultures, a substantially different behaviour was observed between the groups (Fig. 7). Indeed, whereas in both bone marrow donors and treated coeliacs a high rate of lymphocyte proliferation and the rosette formation were observed, both phenomena suggesting the presence of a functional cell-to-cell contact, neither proliferation nor rosette formation were evident in active coeliac patients and many lymphocytes showed apoptotic features (Fig. 7a–c). However, when considering the morphology of freshly isolated DC, no differences were found within the three groups with regard to monocytoid and plasmacytoid populations, even though almost no DC with plasmacytoid features were found in the untreated group and very few in the treated group (Fig. 7d–f).
Fig. 7.
Morphological characterization. Microscope features of dendritic cells cultured with allogenic T cells (a,b,c). After 5 days' co-culture, a high rate of lymphocyte proliferation and the rosette formation are evident in both the healthy control (HC) and treated coeliac patient (TCD), whereas in the untreated coeliac patient (UCD), only loosely adherent clusters and isolated cells are evident and many lymphocytes show apoptotic features. Original magnification ×200. Microscope features of freshly isolated DC from UCD, TCD and HC stained with May–Grünwald–Giemsa (d,e,f). Even though freshly isolated DC do not exhibit the characteristic morphology because they require a period of in vitro culture, the typical differences between the two subsets are clearly evident, the plasmacytoid population showing a rounded morphology with an oval or indented nucleus (single arrow), whereas the monocytoid population has a more irregular outline and a hyperlobulated nucleus (double arrow). Original magnification ×500.
Cytokine profiling
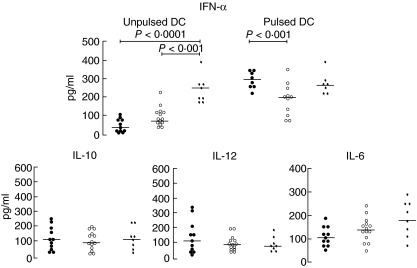
Quantification of the cytokine pattern revealed a sixfold decrease of IFN-α secretion by freshly isolated DC in active, and a threefold decrease in treated coeliac patients in comparison to the bone marrow donor group, whereas no statistically significant differences were observed with regard to IL-6, IL-10 and IL-12 levels, as shown in Fig. 8. By contrast, when pulsing DC with ct-gliadin, the level of IFN-α expression in active and treated CD rose to the level found in physiological conditions, even though in treated CD it appeared significantly lower than in untreated CD (Fig. 8).
Fig. 8.
Cytokine profile. Enzyme-linked immunosorbent assays (ELISA) for quantification of interferon (IFN)-α, interleukin (IL)-6, IL-10 and IL-12 were carried out on the supernatants of 24 h-cultured dendritic cells (DC) sorted from untreated coeliac patients (•), treated coeliac patients (○) and healthy controls (✦). IFN-α secretion was determined on supernatants of both unpulsed and pulsed DC. The data are expressed as pg/ml and horizontal bars indicate medians.
Discussion
Because the immunological abnormalities in CD are not confined to the small bowel mucosa and circulating immune cells may mirror the state of the immune response within the gut [11,12], the results of the investigation of peripheral DC modifications in this condition are of great interest. In the present study, we demonstrated a significant reduction of the absolute number of DC, mainly the plasmacytoid subset, both in untreated and treated coeliac patients. In fact, it is unknown whether this may reflect a primary alteration due to a decreased generation of DC precursors in the bone marrow [20] or a secondary phenomenon due to the recruitment of these cells in the diseased tissue [21]. The low expression of CD83 found in active CD, a cell surface molecule which is up-regulated upon antigen capture [19], together with the recent demonstration of a significant increase of antigen-presenting cell density in diseased mucosa in comparison to physiological condition [10], both favour the latter hypothesis. However, we remained puzzled by the low numbers of circulating pDC found in our patients, as in the paper by Raki and coworkers no pDC were detected in the duodenal mucosa [10]. If confirmed, the reason might lie in a mucosal phenotypical switch due to the high plasticity of DC [22]. Furthermore, to determine whether the observed DC depletion represents a ‘one-time’ phenomenon or whether their number changes during the course of the disease, we carried out longitudinal analysis and found no normalization of the number of DC and the plasmacytoid subset after a course of gluten-free diet. The persistence of these abnormalities may be explained by inadvertent gluten intake and/or by the capacity of DC to retain the antigen for a long time in a quiescent status [23].
Moreover, the prominent decrease of circulating pDC is paralleled by the low expression of its main cytokine, IFN-α[24]. It is noteworthy that ct-gliadin pulsing induced both maturation and IFN-α secretion by DC from CD patients. These findings, along with the notion that IFN-α administration may trigger CD in genetically susceptible individuals [25] and CD-like lesions in human fetal gut explants [26], further points to an involvement of pDC in CD pathogenesis. In fact, it is known that, by secreting immunomodulatory cytokines, mucosal pDC are responsible for the de novo differentiation of regulatory T cells in response to enteric antigens [27]. However, the direction of the immune response towards tolerance or inflammation depends on the accessory signals DC receive [28], the type of pathogen encountered and local environment [2,29]. As far as the antigen is concerned, gliadin has been shown recently to enhance the expression of maturation markers and the secretion of chemokines and cytokines by monocyte-derived DC either when isolated from healthy humans [30] or when generated by bone marrow of BALB/c mice [31]. Therefore, in CD, the type of antigen/s and the presence of a peculiar microenvironment [32] may be responsible for massive DC recruitment at mucosal level and their subsequent switch from tolerogenic to immunogenic [33,34]. This hypothesis is strengthened by a recent model in which, in physiological conditions, IFN-α and tumour necrosis factor-α-producing DC subsets synergize in protective immunity while, in the case of antigen-driven prevalence of one of these cytokines, autoimmunity occurs, sharing different features on the basis of which the DC subset undergoes activation [35–36].
Finally, the previously mentioned lack of maturation is also highlighted by the inability of DC isolated from active CD patients to stimulate T cell proliferation in a mixed leucocyte reaction, which is paralleled by the microscopic features of cell co-cultures, showing that in this condition DC were unable to create an efficient contact with T cells which, in turn, undergo apoptosis. These findings are in agreement with those obtained in children suffering from type 1 diabetes, in whom a defect in the expression of co-stimulatory molecules and an impairment of DC priming function have also been observed [14]. However, upon ct-gliadin pulsing, DC isolated from CD patients recovered this ability even though at a lower level, if compared with physiological condition, in accordance with the induced maturation and cytokine secretion.
Taken together, our results demonstrate clearly that in CD the pool of circulating DC, mainly the plasmacytoid subset, is depleted and has an impaired function as a consequence of their immature status, probably because they are replenishing the pool of gut-residing DC continuously. This cell population maintains its potential activity, however, because following antigen stimulation all the observed abnormalities undergo normalization.
Acknowledgments
The authors wish to acknowledge the Associazione Italiana Celiachia, Sezione Lombardia for financial support, Maria Giammatteo, Anna Maria Zanaboni and Mara De Amici for their skilled assistance, and Dr Catherine Klersy for statistical analysis.
References
- 1.Banchereau J, Steinman RM. Dendritic cells and the control of immunity. Nature. 1998;392:245–52. doi: 10.1038/32588. [DOI] [PubMed] [Google Scholar]
- 2.Banchereau J, Briere F, Caux C, et al. Immunobiology of dendritic cells. Annu Rev Immunol. 2000;18:767–811. doi: 10.1146/annurev.immunol.18.1.767. [DOI] [PubMed] [Google Scholar]
- 3.O'Doherty U, Peng M, Gezelter S, et al. Human blood contains two subsets of dendritic cells, one immunologically mature and the other immature. Immunology. 1994;82:487–93. [PMC free article] [PubMed] [Google Scholar]
- 4.Robinson SA, Patterson S, English N, et al. Human peripheral blood contains two lineages of dendritic cells. Eur J Immunol. 1999;29:2769–78. doi: 10.1002/(SICI)1521-4141(199909)29:09<2769::AID-IMMU2769>3.0.CO;2-2. [DOI] [PubMed] [Google Scholar]
- 5.MacDonald KPA, Munster DJ, Clark GJ, et al. Characterization of human blood dendritic cell subsets. Blood. 2002;100:4512–20. doi: 10.1182/blood-2001-11-0097. [DOI] [PubMed] [Google Scholar]
- 6.de Jong EC, Smits HH, Kapsenberg ML. Dendritic cell-mediated T cell polarization. Springer Semin Immunol. 2005;26:289–307. doi: 10.1007/s00281-004-0167-1. [DOI] [PubMed] [Google Scholar]
- 7.Pulendran B, Smith JL, Caspary G, et al. Distinct dendritic cell subsets differentially regulate the class of immune response in vivo. Proc Natl Acad Sci USA. 1999;96:1036–41. doi: 10.1073/pnas.96.3.1036. [DOI] [PMC free article] [PubMed] [Google Scholar]
- 8.Sollid LM. Coeliac disease: dissecting a complex inflammatory disorder. Nature Rev Immunol. 2002;2:647–55. doi: 10.1038/nri885. [DOI] [PubMed] [Google Scholar]
- 9.Koning F. Coeliac disease: caught between a rock and a hard place. Gastroenterology. 2005;129:1294–301. doi: 10.1053/j.gastro.2005.07.030. [DOI] [PubMed] [Google Scholar]
- 10.Ráki M, Tollefsen S, Molberg Ø, et al. A unique dendritic cell subset accumulates in the coeliac lesion and efficiently activates gluten-reactive T cells. Gastroenterology. 2006;131:428–38. doi: 10.1053/j.gastro.2006.06.002. [DOI] [PubMed] [Google Scholar]
- 11.Anderson RP, van Heel DA, Tye-Din JA, et al. T cells in peripheral blood after gluten challenge in coeliac disease. Gut. 2005;54:1217–23. doi: 10.1136/gut.2004.059998. [DOI] [PMC free article] [PubMed] [Google Scholar]
- 12.Ben-Horin S, Green PHR, Bank I, et al. Characterizing the circulating, gliadin-specific CD4+ memory T cells in patients with coeliac disease: linkage between memory function, gut homing and Th1 polarization. J Leukoc Biol. 2006;79:676–85. doi: 10.1189/jlb.0705414. [DOI] [PubMed] [Google Scholar]
- 13.Gill MA, Blanco P, Arce E, et al. Blood dendritic cells and DC-poietins in systemic lupus erythematosus. Hum Immunol. 2002;63:1172–80. doi: 10.1016/s0198-8859(02)00756-5. [DOI] [PubMed] [Google Scholar]
- 14.Angelini F, Del Duca E, Piccinini S, et al. Altered phenotype and function of dendritic cells in children with type 1 diabetes. Clin Exp Immunol. 2005;142:341–5. doi: 10.1111/j.1365-2249.2005.02916.x. [DOI] [PMC free article] [PubMed] [Google Scholar]
- 15.Baumgart DC, Metzke D, Schmitz J, et al. Patients with active inflammatory bowel disease lack immature peripheral blood plasmacytoid and myeloid dendritic cells. Gut. 2005;54:228–36. doi: 10.1136/gut.2004.040360. [DOI] [PMC free article] [PubMed] [Google Scholar]
- 16.Thomas R, Davis LS, Lipsky PE. Isolation and characterization of human peripheral blood dendritic cells. J Immunol. 1993;150:821–34. [PubMed] [Google Scholar]
- 17.Dzionek A, Fuchs A, Schmidt P, et al. BDCA-2, BDCA-3, and BDCA-4: three markers for distinct subsets of dendritic cells in human peripheral blood. J Immunol. 2000;165:6037–46. doi: 10.4049/jimmunol.165.11.6037. [DOI] [PubMed] [Google Scholar]
- 18.Arentz-Hansen EH, McAdam SN, Molberg Ø, et al. Production of a panel of recombinant gliadins for the characterization of T cell reactivity in coeliac disease. Gut. 2000;46:46–51. doi: 10.1136/gut.46.1.46. [DOI] [PMC free article] [PubMed] [Google Scholar]
- 19.Zhou LJ, Tedder TF. Human blood dendritic cells selectively express CD83, a member of the immunoglobulin superfamily. J Immunol. 1995;154:3821–35. [PubMed] [Google Scholar]
- 20.Athanassopoulos P, Vaessen LMB, Balk AHMM, et al. Impaired circulating dendritic cell reconstitution identifies rejecting recipients after clinical heart transplantation independent of rejection therapy. Eur J Cardio-Thor Sur. 2005;27:783–9. doi: 10.1016/j.ejcts.2004.12.032. [DOI] [PubMed] [Google Scholar]
- 21.Hardin JA. Dendritic cells: potential triggers of autoimmunity and targets for therapy. Ann Rheum. 2005;64:86–90. doi: 10.1136/ard.2005.044560. [DOI] [PMC free article] [PubMed] [Google Scholar]
- 22.Liu YJ, Kanzler H, Soumelis V, et al. Dendritic cell lineage, plasticity and cross-regulation. Nat Immunol. 2001;2:585–9. doi: 10.1038/89726. [DOI] [PubMed] [Google Scholar]
- 23.Tew JG, Phipps RP, Mandel TE. The maintenance and regulation of the humoral immune response: persisting antigen and the role of follicular antigen-binding dendritic cells as accessory cells. Immunol Rev. 1980;53:175–9. doi: 10.1111/j.1600-065x.1980.tb01044.x. [DOI] [PubMed] [Google Scholar]
- 24.Siegal FP, Kadowaki N, Shodell M, et al. The nature of the principal type 1 interferon-producing cells in human blood. Science. 1999;284:1835–7. doi: 10.1126/science.284.5421.1835. [DOI] [PubMed] [Google Scholar]
- 25.Monteleone G, Pender SLF, Alstead E, et al. Role of interferon alpha in promoting T helper cell type 1 responses in the small intestine in coeliac disease. Gut. 2001;48:425–9. doi: 10.1136/gut.48.3.425. [DOI] [PMC free article] [PubMed] [Google Scholar]
- 26.Monteleone G, Pender SLF, Wathen NC, et al. Interferon-α drives T cell-mediated immunopathology in the intestine. Eur J Immunol. 2001;31:2247–55. doi: 10.1002/1521-4141(200108)31:8<2247::aid-immu2247>3.0.co;2-4. [DOI] [PubMed] [Google Scholar]
- 27.Bilsborough J, Viney JL. In vivo enhancement of dendritic cell function. Ann NY Acad Sci. 2004;1029:83–7. doi: 10.1196/annals.1309.011. [DOI] [PubMed] [Google Scholar]
- 28.Matzinger P. The danger model: a renewed sense of self. Science. 2002;296:301–5. doi: 10.1126/science.1071059. [DOI] [PubMed] [Google Scholar]
- 29.Kubach J, Becker C, Schmitt E, et al. Dendritic cells: sentinels of immunity and tolerance. Int J Hematol. 2005;81:197–203. doi: 10.1532/IJH97.04165. [DOI] [PubMed] [Google Scholar]
- 30.Palova-Jelinkova L, Rozkova D, Pecharova B, et al. Gliadin fragments induce phenotypic and functional maturation of human dendritic cells. J Immunol. 2005;175:7038–45. doi: 10.4049/jimmunol.175.10.7038. [DOI] [PubMed] [Google Scholar]
- 31.Nikulina M, Habich C, Flohé SB, et al. Wheat gluten causes dendritic cell maturation and chemokine secretion. J Immunol. 2004;173:1925–33. doi: 10.4049/jimmunol.173.3.1925. [DOI] [PubMed] [Google Scholar]
- 32.Fasano A, Shea-Donohue T. Mechanisms of disease: the role of intestinal barrier function in the pathogenesis of gastrointestinal autoimmune diseases. Nat Clin Pract Gastroenterol Hepatol. 2005;2:416–22. doi: 10.1038/ncpgasthep0259. [DOI] [PubMed] [Google Scholar]
- 33.Barrett TA. Mechanisms of oral tolerance: dendritic cells. Ann NY Acad Sci. 2004;1029:94–100. [Google Scholar]
- 34.Banchereau J, Pascual V, Palucka AK. Autoimmunity through cytokine-induced dendritic cell activation. Immunity. 2004;20:539–50. doi: 10.1016/s1074-7613(04)00108-6. [DOI] [PubMed] [Google Scholar]
- 35.Theofilopoulos AN, Baccala R, Beutler B, et al. Type I interferons (alpha/beta) in immunity and autoimmunity. Annu Rev Immunol. 2005;23:307–36. doi: 10.1146/annurev.immunol.23.021704.115843. [DOI] [PubMed] [Google Scholar]
- 36.Ronnblom L, Eloranta ML, Alm GV. Role of natural interferon-alpha producing cells (plasmacytoid dendritic cells) in autoimmunity. Autoimmunity. 2003;36:463–72. doi: 10.1080/08916930310001602128. [DOI] [PubMed] [Google Scholar]


