

Abstract
T lymphocytes and/or their subpopulations from peripheral blood may represent molecular sensors to be used for the evaluation of gene expression modification in physiological and pathological conditions, providing a unique and easily available biological model for integrated studies of gene expression in humans. In this study, a proteomic approach was applied to evaluate the association between changes in T cell protein expression patterns and specific diseased conditions. In particular, two hyperandrogenic syndromes were studied, sharing many clinical and biochemical signs: polycystic ovary syndrome (PCOS) and congenital adrenal hyperplasia (CAH). Comparison of proteomic maps of T lymphocytes derived from patients affected by PCOS or CAH with those derived from healthy subjects showed that 14 proteins are expressed differentially in both PCOS and CAH, 15 exclusively in PCOS and 35 exclusively in CAH. Seventeen of these proteins have been identified by mass spectrometry analysis. Furthermore, proteomic data mining by hierarchical clustering was performed, highlighting T lymphocytes competence as a living biosensor system.
Keywords: biosensor, clustering, proteomics, T lymphocytes
Introduction
T cells, by expressing specific cell-surface molecules and secreting lymphokines and cytokines, regulate several immune functions, including the induction of antibody-producing B cells, the mobilization of the inflammatory response and the direct killing of target cells.
T lymphocytes and/or their subpopulations from peripheral blood may represent molecular sensors and can be used for evaluation of gene expression modification in physiological and pathological conditions. They provide a unique model for integrated studies of gene expression in humans, considering that: (i) they are extremely sensitive to the environment modifications, quickly reactive to different agents and able to record different molecular signals [1]; (ii) the variation of these stimuli determines modifications of the lymphocytes protein pattern which can be estimated by proteomic platforms combined with data mining; and (iii) they are easily available in large number from peripheral blood without any need for invasive and/or risky biopsy.
To assess the potentiality and usefulness of differential proteome analysis of peripheral T cells in clinical investigation, we designed an experiment in which the profiles of expressed proteins in patients affected by different pathological conditions were compared to those of healthy people, with the aim of detecting some association between the condition and the lymphocyte protein pattern. To also achieve a qualitative evaluation about the sensibility of T cells as potential biosensors, we chose two pathological states, polycystic ovary syndrome (PCOS) and congenital adrenal hyperplasia (CAH) which, although different, share many clinical and biochemical signs, such as hyperandrogenism with hirsutism, acne and alopecia, chronic anovulation, infertility, higher frequency of endometrial carcinoma, coagulation defects with hyperfibrinogenaemia and higher risk of cardiovascular disorders [2]. Dyslipidaemia, reduced glucose tolerance and diabetes mellitus are also observed.
Whereas CAH, transmitted as a recessive autosomal character, is due to enzyme deficiency (21-hydroxylase in about 90% of the cases) affecting the ability of converting cholesterol into corticosteroid hormones [3], the primary causes of PCOS remain undetermined.
The protein pattern of circulating T cells in these pathologies was analysed by two-dimensional gel electrophoresis and variations were evaluated by comparison with a reference expression profile obtained by healthy donors. Some of the differentially expressed proteins were also identified by mass spectrometry. Further analysis of proteomic data by hierarchical clustering techniques highlighted the association of a specific protein pattern with distinct clinical conditions. Such results support the hypothesis that lymphocytes can be considered suitable biosensors, functional for labelling pathologies with very similar clinical and biochemical signs.
Patients, materials and methods
Patients
All patients were enrolled at the Division of Endocrinology of the Azienda Ospedaliera Sant'Andrea, University of Rome ‘Sapienza’, Italy. The study was approved by the institutional ethics committee of the hospital, and the procedures were in accordance with the Helsinki Declaration of 1975, as revised in 2000. Blood samples were obtained after patients provided written informed consent.
We studied two groups composed of hyperandrogenic patients without metabolic and cardiovascular damage, free of any infection disease. The first group comprised 10 women affected by PCOS (mean age 25 ± 2); the second group comprised five women (mean age 27 ± 7) affected by CAH because of 21-hydroxylase deficiency (characterized by the V218L point mutation). A control group was composed by 10 sex- and age-matched healthy volunteers, matching the following parameters: female, mean age 27 ± 7, regular menstruation, normal weight, non-smoking, no anti-androgenic therapy, no pregnancy, no assumption of oral contraceptive, no acne, alopecia or hirsutism.
T cells isolation
About 25 ml of ethylenediamine tetraacetic acid (EDTA)-anti-coagulated peripheral blood was collected and processed immediately for purification of peripheral blood mononuclear cells (PBMC) by density gradient centrifugation over Ficoll-Hypaque (Nycomed Pharma, Oslo, Norway), according to the manufacturer's protocol. T cells were then isolated by negative selection (mean purity ≥ 95%) using a magnetic beads system (Pan T Cell Isolation Kit II, human; Miltenyi Biotec, Auburn, CA, USA), according to the manufacturer's instructions. Briefly, non-T cells are labelled indirectly with a cocktail of biotin-conjugated monoclonal antibodies as primary labelling reagent, and anti-biotin monoclonal antibodies conjugated to magnetic microbeads as secondary labelling reagent. The magnetically labelled non-T cells are depleted by retaining them on a magnetizable separation column which is placed in a strong permanent magnet, while the unlabelled T cells pass through the column. The PBMC and isolated T cells samples were counted on an Advia Hematology Analyser (Bayer Diagnostics division, Leverkusen, Germany).
Protein separation
Purified T cells were lysed in 0·1% sodium dodecyl sulphate (SDS)/2·3% dithioerythritol (DTE). Proteins were then precipitated with 80% (v/v) cold acetone followed by centrifugation (20 000 g for 10 min at 4°C). Pellets were dissolved in rehydration solution [8 M urea/4% 3-[(3-cholamidopropyl)-dimethylammonio]-1-propanesulphonate (CHAPS)] and protein content was determined by the Bradford assay. Equal amounts of proteins derived from the healthy subjects were mixed to make a reference control pool.
Two-dimensional gel electrophoresis
Isoelectric focusing (IEF) was performed on an Ettan IPG-Phor system (Amersham Biosciences, Uppsala, Sweden) at 16°C and under a current limit of 50 μA/strip. Sixty μg of proteins in a final volume of 350 μl of lysis buffer, containing 65 mM DTE, 0·5% (v/v) ampholine pH 3–10 non-linear (NL) and a trace of bromophenol blue, were loaded onto 18 cm pH 3–10 NL Immobiline DryStrip (IPG strip; Amersham Biosciences, Uppsala, Sweden). The strip rehydration step was carried out at 16°C at a constant voltage of 30 V for 4 h and an additional 50 V for 5 h. Damp electrode pads were positioned under the rehydrated strip over the electrodes. The IEF step was performed using the following parameters: 400 V, 2 h; 800 V, 1 h; 1200 V, 2 h; 3000 V, 3 h; 8000 V, 6–8 h, until the total voltage reached 70 kVh. Immediately after the IEF run, IPG strips were equilibrated for 12 min in 6 M urea, 30% (v/v) glycerol, 2% (w/v) SDS, 50 mM Tris-HCl, pH 6·8, 2% (w/v) DTE, and in a similar solution for 5 min, with a trace of bromophenol blue, in which 2% DTE was replaced with 2·5% (w/v) iodoacetamide. The second-dimension electrophoresis was run on 9–16% linear gradient polyacrylamide gels (18 cm × 20 cm × 1·5 mm) at 40 mA/gel constant current at 10°C for approximately 5 h until the dye front reached the bottom of the gel. Samples from each patient were run in triplicate, while the control pool was run in six technical replicates. Gels were stained with colloidal Coomassie blue.
Gel imaging and analysis
Gels were acquired on a Bio-Rad GS-800 Calibrated Imaging Densitometer (Bio-Rad, Veenendaal, the Netherlands) and image analysis was performed using the Bio-Rad PDQuest software, version 7·1·0. Spot volume was normalized to the total density in valid spots. The average spot quantities derived from each replicate group (CV ≤ 5%) were used to perform differential analysis. Spots which were at least twofold up- or down-regulated and with a t-test P-value less than 0·05 were considered as protein with significantly altered expression and were thus selected for identification by peptide mass fingerprinting (PMF).
Protein identification by matrix-assisted laser desorption ionization time-of-flight (MALDI-TOF) mass spectrometry
Protein spots were excised manually from the gel, washed with high-purity water and with 50% acetonitrile/water and dehydrated with 100% acetonitrile. The gel slices were swollen at room temperature in 20 μl of 40 mM NH4HCO3/10% acetonitrile containing 25 ng/μl trypsin (Trypsin Gold, mass spectrometry grade; Promega, Madison, WI, USA). After 1 h, 50 μl of 40 mM NH4HCO3/10% acetonitrile were added and digestion proceeded overnight at 37°C. The generated peptides were extracted with 50% acetonitrile/5% trifluoroacetic acid (TFA; two steps, 20 min at room temperature each), dried by vacuum centrifugation, suspended in 0·1% TFA, passed through micro ZipTip C18 pipette tips (Milllipore, Bedford, MA, USA) and eluted directly with the MS matrix solution (10 mg/ml α-cyano-4-hydroxycinnamic acid in 50% acetonitrile/1% TFA). Mass spectra of the tryptic peptides were obtained using a Voyager-DE MALDI-TOF mass spectrometer (Applied Biosystems, Foster City, CA, USA). Peptide mass fingerprinting database searching was performed using the mascot search engine (http://www.matrixscience.com) in the NCBInr/Swiss-Prot databases. Parameters were set to allow one missed cleavage per peptide, a mass tolerance of 0·5 Da and considering carbamido-methylation of cysteines as a fixed modification and oxidation of methionines as a variable modification. The criteria used to accept identifications included the extent of sequence coverage, number of matched peptides and probabilistic score, as detailed in Table 1.
Table 1.
Protein spots identified by peptide mass fingerprinting.
| Mascot search results | ||||||||||
|---|---|---|---|---|---|---|---|---|---|---|
| Fold-change | t-test P-value† | |||||||||
| SPOT no. | Protein | PCOS | CAH | UniProt (Accession no.) | Theoretical pI/Mw | No. of matched peptides | Sequence coverage (%) | Score* | PCOS | CAH |
| 1107 | Rho GDP-dissociation inhibitor 1 | −3·7 | −2·3 | P52565 | 5·02/23·3 | 9 | 29% | 81 | 1·45 × 10−6 | 1·56 × 10−4 |
| 3405 | F-actin capping protein alpha-1 subunit | −2·4 | −2·1 | P52907 | 5·45/33·1 | 7 | 25% | 78 | 2·19 × 10−4 | 1·65 × 10−2 |
| 6105 | Cofilin-1 | −2·4 | −3·1 | P23528 | 8·22/18·7 | 7 | 39% | 90 | 8·3 × 10−4 | 3 × 10⁻⁴ |
| 6604 | Alpha-enolase | −4·2 | −3·0 | P06733 | 7·01/47·5 | 11 | 37% | 111 | 1·2 × 10−4 | 3·19 × 10−3 |
| 9106 | Peroxiredoxin-1 | +2·0 | −2·1 | Q06830 | 8·27/22·1 | 6 | 43% | 98 | 1·3 × 10−2 | 3·49 × 10−2 |
| 4414 | Cathepsin D | −2·0 | – | P07339 | 6·10/45·0 | 8 | 20% | 77 | 5 × 10⁻³ | |
| 5301 | 3-Hydroxyisobutyrate dehydrogenase, mitochondrial | −4·5 | – | P31937 | 8·38/35·7 | 7 | 34% | 98 | 7·79 × 10−8 | |
| 5603 | Protein disulphide-isomerase A3 | −2·0 | – | P30101 | 5·98/57·2 | 9 | 24% | 84 | 6·9 × 10−3 | |
| 8110 | The Raf kinase inhibitor protein (RKIP) | −2·1 | – | P30086 | 7·01/21·2 | 7 | 49% | 103 | 8 × 10⁻⁵ | |
| 8012 | Platelet basic protein (precursor) | +9·3 | – | P02775 | 8·95/10·3 | 8 | 35% | 107 | 6·38 × 10−3 | |
| 8103 | Superoxide dismutase (Mn), mitochondrial (precursor) | +3·5 | – | P04179 | 8·35/24·9 | 8 | 38% | 104 | 1·07 × 10−3 | |
| 4202 | Glutathione S-transferase P | – | −2·0 | P09211 | 5·43/23·6 | 6 | 53% | 77 | 1·02 × 10−4 | |
| 4208 | Proteasome subunit beta type 4 | – | −2·5 | P28070 | 5·72/29·3 | 8 | 48% | 103 | 3·2 × 10−2 | |
| 5210 | Peroxiredoxin-3 | – | −2·0 | P30048 | 7·67/28·0 | 8 | 44% | 114 | 1·6 × 10−2 | |
| 5219 | Growth factor receptor-bound protein 2 | – | −2·5 | P29354 | 5·89/25·3 | 7 | 29% | 83 | 4·2 × 10−3 | |
| 5215 | Prefoldin subunit 2 | – | n.d. | Q9UHV9 | 6·2/16·7 | 6 | 48% | 101 | 5·2 × 10−3 | |
| 5217 | CCG1-interacting factor B | – | +2·4 | Q96IU4 | 5·94/22·5 | 8 | 56% | 105 | 1·6 × 10−2 | |
Mascot score represents the probability that the observed match is a random event. Protein scores greater than 76 are significant (P< 0·05).
P< 0·05 indicates a statistically significant differential expression compared to healthy control; n.d.: not detectable. PCOS: polycystic ovary syndrome; CAH: congenital adrenal hyperplasia; GDP: guanosine diphosphate.
Hierarchical clustering of proteomic data
Unsupervised analysis of proteomic data was performed by the GeneSpring GX 7·3 expression analysis software (Agilent Technologies, Wilmington, DE, USA). For each patient analysed, the average quantification of spot values inside its replicate group, reported as ratio to the average of the control replicate group, was imported as expression data. Clustering was performed according to an average linkage algorithm using the following parameters: similarity measure by Pearson correlation, similar branches merged with a separation ratio of 1, minimum distance 0·001.
Results
In order to detect differentially expressed proteins in T cells derived from patients affected by PCOS or CAH syndromes, we built a two-dimensional map of female healthy subjects by pooling protein samples obtained from 10 volunteers. A total of 37 spots in this map were assigned to a specific protein by peptide mass fingerprinting and/or matching with existing proteomic maps (data not shown) and an annotated version is available at http://w3.uniroma1.it/biocmed2/dima/.
Matching of the ‘control’ map with CAH and PCOS patient-derived electropherograms revealed a greater modification in protein expression of T cells derived from CAH patients compared to those obtained from PCOS patients (Fig. 1), as 49 protein spots in the former and 29 in the latter were recognized with significantly altered expression, with 14 spots shared by the two groups. Some of these proteins were identified by peptide mass fingerprinting (Table 1).
Fig. 1.
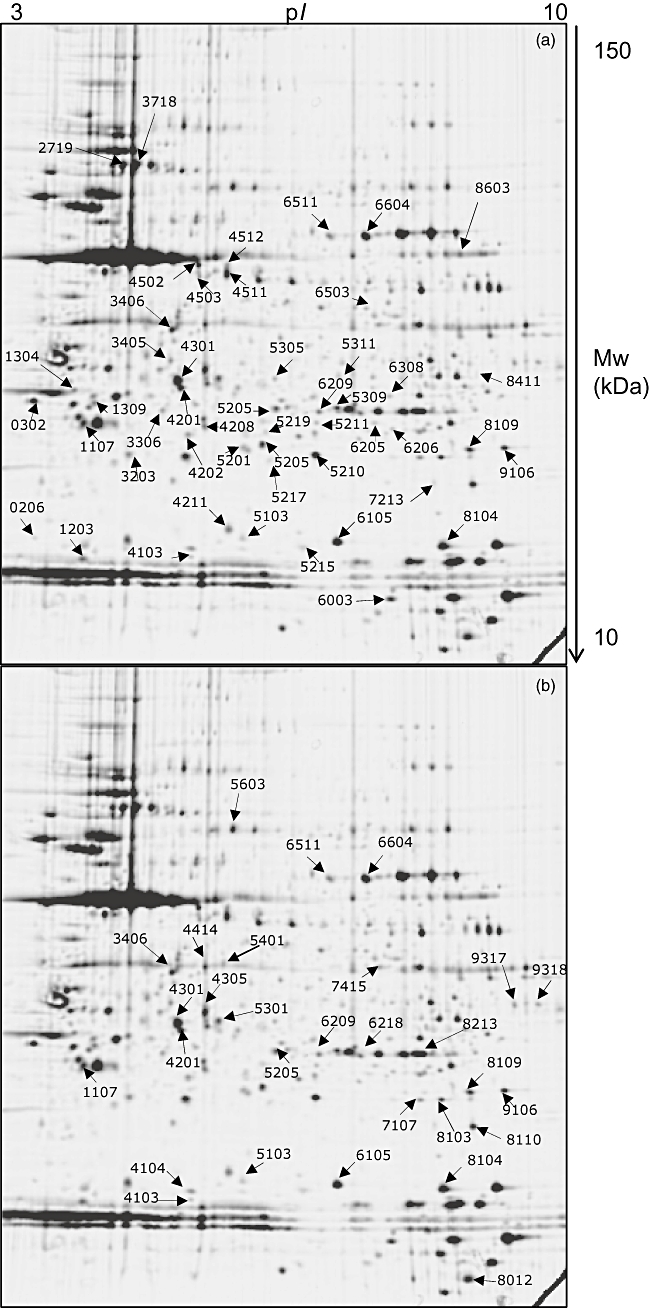
Two-dimensional maps of peripheral T lymphocyte. Spots marked by arrows and numbers correspond to differentially expressed proteins in congenital adrenal hyperplasia (CAH) (a) and polycystic ovary syndrome (PCOS) (b) patients; proteins identified by peptide mass fingerprinting are listed in Table 1.
In detail, the Rho guanosine diphosphate (GDP)-dissociation inhibitor 1, the F-actin capping protein alpha-1 subunit, cofilin-1 and alpha-enolase are down-expressed in both PCOS and CAH, while peroxiredoxin-1 is decreased in PCOS and increased in CAH compared to healthy subjects.
In T lymphocytes from PCOS patients, cathepsin D, 3-hydroxyisobutyrate dehydrogenase, protein disulphide-isomerase A3 and the Raf kinase inhibitor protein (RKIP) show decreased expression, whereas the platelet basic protein and superoxide dismutase are up-regulated. In CAH patients, expression of glutathione S-transferase P, proteasome subunit beta type 4, peroxiredoxin-3, growth factor receptor-bound protein 2 (Grb2) and subunit 2 of prefoldin are decreased, while the CCG1-interacting factor B (CIB) is over-expressed.
Together with the classic proteome analysis, for each sample the list of normalized expression values of all detected spots was imported into the GeneSpring GX version 7·3 software to perform hierarchical clustering of data, which resulted in a dendrogram where samples are grouped by similarity. As shown in Fig. 2, the software joins all the PCOS and all the CAH samples in two independent branches which are, in turn, separated from the healthy one.
Fig. 2.
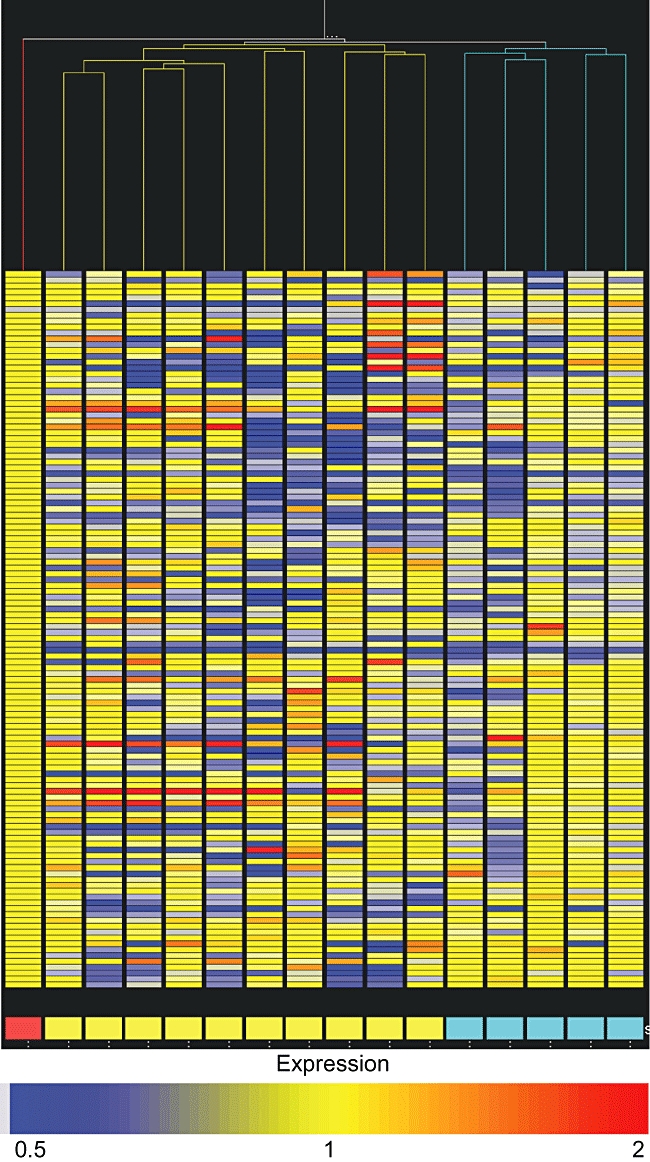
Dendrogram derived by hierarchical clustering of protein expression data. Columns represent the analysed samples; each horizontal lane represents the average quantity of a protein spot inside the replicate group of the corresponding sample. Red box: healthy pool; yellow boxes: polycystic ovary syndrome (PCOS) samples; azure boxes: congenital adrenal hyperplasia (CAH) samples.
Discussion
Because T lymphocytes play a critical role in disease pathogenesis, a rising interest in studying molecular mechanisms underlying specific actions of these immune cells has emerged, along with the availability of high-throughput technologies for broad-range analysis of gene and protein expression, such as DNA microarrays and proteomics. These approaches have been applied mainly to investigation of pathologies in which a direct correlation with the state of immune system was clearly established, as autoimmune disorders and neural disorders [4–6].
To assess the potential use of T lymphocytes proteome profiling as a tool for monitoring the immune response to diverse diseased conditions, we examined two groups of similar patients. PCOS and CAH syndromes share a number of clinical and biochemical signs, so they are generally thought to elicit similar effects on the organism homeostasis.
In order to detect differentially expressed proteins in T cells derived from these patients, a two-dimensional map of female healthy subjects was needed. However, definition of the ‘healthy’ profile cannot be absolute; an average value is necessary, obtained by the combination of proteome profiles of a representative group matching the adequate selection criteria. To minimize the experimental bias introduced by interindividual variability of protein expression due to biological and environmental factors, protein samples derived from 10 healthy subjects were pooled and analysed in technical replicates. This approach allows an experimental ‘mean’ of the protein expression pattern to be obtained and is helpful in increasing the number of technical replicates, which is often limited by the low amount of available biological samples [7].
Differential analysis revealed that, compared to the healthy one, the T cell proteome is altered in a different manner in PCOS and CAH patients.
Identification of differentially expressed proteins may help to characterize more clearly some aspects of these pathologies. Whereas the primary cause of CAH has been established as an enzyme deficiency, PCOS aetiopathology is not yet understood, although hyperandrogenism is generally thought to be the main source of the clinical signs associated with both the diseases.
Twelve proteins were detected with a concordant variation of expression in PCOS- and CAH-derived T cells compared to healthy subjects, possibly representing molecular events elicited by features common to both syndromes. Among them we identified alpha-enolase, a glycolytic enzyme involved in many processes, including the initiation of disease conditions, acting as a plasminogen surface receptor [8], and three proteins involved in the regulation of the cytoskeleton structure: cofilin 1, F-actin capping protein and Rho GDP-dissociation inhibitor 1 [9–11]. As rearrangement of the cytoskeleton is an essential step in T cell activation [12], changes in expression of the above-mentioned proteins might reflect the different functional state of the immune cellular system in PCOS- and CAH-affected patients compared to healthy subjects.
Two spots, one identified as peroxiredoxin-1 (an anti-oxidant enzyme involved in controlling the redox cellular state [13]), undergo opposite regulation in PCOS and CAH, perhaps representing differentiating steps of the immune reaction to the syndromes.
Among the spots expressed differentially in PCOS but not in CAH compared to healthy controls, six proteins were identified. Impaired expression was observed for cathepsin D, an aspartyl lysosomal protease involved in various biological processes such as apoptosis, angiogenesis and proliferation [14], the expression of which was shown to be down-regulated by androgens [15]. Down-expression was also detected for the Raf kinase inhibitor protein, a factor involved in several signalling cascades, which can inhibit activation of NF-κB [16], a transcription factor regulating a number of immune genes, and for 3-hydroxyisobutyrate dehydrogenase, a key enzyme in the valine oxidation pathway [17].
A protein showing increased expression is the platelet basic protein, by which the following secreted peptides can be generated by alternative proteolytic processing: connective tissue-activating peptide III, β-thromboglobulin and neutrophil-activating peptide 2. These peptides act as regulatory molecules of the immune response [18].
Finally, we found decreased expression of protein disulphide-isomerase and increased expression of superoxide dismutase. Similar regulation of these two proteins has been described recently in an in vitro model of insulin resistance [19], a typical condition found in hyperandrogenic syndromes.
Among spots expressed differentially in T lymphocytes from CAH patients we identified the CCG1-interacting factor B (CIB), a protein isolated as a molecular partner of CCG1 (cell cycle arrest in G1), the largest subunit of TFIIB, a multi-protein complex with a central role in transcription [20]; peroxiredoxin 3 and glutathione S-transferase, both related to oxidative stress [21] (a condition usually associated with insulin resistance); the growth factor receptor-bound protein 2, member of a class of adaptor molecules coupling different factors, known to bind a plethora of signal-transducing proteins in both resting and activated T lymphocytes [22]; the subunit 2 of prefoldin, a multi-complex protein with chaperone function; and the proteasome subunit beta type 4. By regulation of protein degradation rates, proteasome affects many processes, including turnover of the androgen receptors [23].
Even if identification and large-scale validation of differential expressed proteins in diseased conditions have, so far, been a main aim of proteome research, some limits of this approach have emerged in finding molecular markers of pathologies actually functional in clinical practice, so that proteomic studies often remain as a huge body of data, e.g. lists of proteins, of hard biological interpretation. On the other hand, one of the most difficult end-points of proteome analysis applied to clinical sciences is the design of tailored patient treatment due to the possibility of selecting specific therapy according to the individual proteome profile [24]. This goal will be feasible through recognition of the diagnostic pattern of protein expression related strictly to both clinical condition and individual biological background, but do not rely essentially on assignment of a protein identity to the differentially expressed species. Rather, it needs the application of supervised learning techniques to a large number of samples.
To gain some evidence about the suitability of T cells as biosensors to be used in this type of study, we proceeded to unsupervised analysis of our sample cohort. This approach allows the organization of heterogeneous data into similar groups, highlighting possible relationships between different members. The segregation of PCOS and CAH samples into different branches of the dendrogram derived by this analysis reveals the presence of some embedded pattern able to discriminate between the pathological states, in agreement with the supposed competence of the T cell protein profile to discern different conditions.
Hence, we propose the study of circulating lymphocytes as a promising tool towards the definition of clinically relevant expression patterns also considering its easy, swift and non-invasive way of sampling.
Acknowledgments
This work was supported in part with grants from ‘Ministero Università e Ricerca’ prot. number 2005052122_005 and the University Sapienza of Rome.
References
- 1.Samy TSA, Knoferl MW, Zheng R, Schwacha MG, Bland KI, Chaudry IH. Divergent immune responses in male and female mice after trauma-hemorrhage: dimorphic alterations in T lymphocyte steroidogenic enzyme activities. Endocrinology. 2001;142:3519–29. doi: 10.1210/endo.142.8.8322. [DOI] [PubMed] [Google Scholar]
- 2.Tsilchorozidou T, Overton C, Conway GS. The pathophysiology of polycystic ovary syndrome. Clin Endocrinol. 2004;60:1–17. doi: 10.1046/j.1365-2265.2003.01842.x. [DOI] [PubMed] [Google Scholar]
- 3.Therrell BL. Newborn screening for congenital adrenal hyperplasia. Endocrinol Metab Clin North Am. 2001;1:15–30. doi: 10.1016/s0889-8529(08)70017-3. [DOI] [PubMed] [Google Scholar]
- 4.Utz PJ. Protein arrays for studying blood cells and their secreted products. Immunol Rev. 2005;204:264–82. doi: 10.1111/j.0105-2896.2005.00251.x. [DOI] [PubMed] [Google Scholar]
- 5.Gladkevich A, Kauffman HF, Korf J. Lymphocytes as a neural probe: potential for studying psychiatric disorders. Prog Neuro-Psychopharmacol Biol Psychiatry. 2004;28:559–76. doi: 10.1016/j.pnpbp.2004.01.009. [DOI] [PubMed] [Google Scholar]
- 6.Chen DS, Davis MM. Molecular and functional analysis using live cell microarrays. Curr Opin Chem Biol. 2006;10:28–34. doi: 10.1016/j.cbpa.2006.01.001. [DOI] [PubMed] [Google Scholar]
- 7.Weinkauf M, Hiddemann W, Dreyling M. Sample pooling in 2-D gel electrophoresis: a new approach to reduce non-specific expression background. Electrophoresis. 2006;27:4555–8. doi: 10.1002/elps.200600207. [DOI] [PubMed] [Google Scholar]
- 8.Pancholi V. Multifunctional alpha-enolase: its role in diseases. Cell Mol Life Sci. 2001;58:902–20. doi: 10.1007/PL00000910. [DOI] [PMC free article] [PubMed] [Google Scholar]
- 9.Huang TY, DerMardirossian C, Bokoch GM. Cofilin phosphatases and regulation of actin dynamics. Curr Opin Cell Biol. 2006;18:26–31. doi: 10.1016/j.ceb.2005.11.005. [DOI] [PubMed] [Google Scholar]
- 10.Zigmond SH. Beginning and ending an actin filament: control at the barbed end. Curr Top Dev Biol. 2004;63:145–88. doi: 10.1016/S0070-2153(04)63005-5. [DOI] [PubMed] [Google Scholar]
- 11.Hall A. Rho GTPases and the control of cell behaviour. Biochem Soc Trans. 2005;33:891–5. doi: 10.1042/BST20050891. [DOI] [PubMed] [Google Scholar]
- 12.Miletic AV, Swat M, Fujikawa K, Swat W. Cytoskeletal remodeling in lymphocyte activation. Curr Opin Immunol. 2003;15:261–8. doi: 10.1016/s0952-7915(03)00054-2. [DOI] [PubMed] [Google Scholar]
- 13.Rhee SG, Chae HZ, Kim K. Peroxiredoxins: a historical overview and speculative preview of novel mechanisms and emerging concepts in cell signalling. Free Radic Biol Med. 2005;38:1543–52. doi: 10.1016/j.freeradbiomed.2005.02.026. [DOI] [PubMed] [Google Scholar]
- 14.Liaudet-Coopman E, Beaujouin M, Derocq D, et al. F cathepsin D: newly discovered functions of a long-standing aspartic protease in cancer and apoptosis. Cancer Lett. 2006;237:167–79. doi: 10.1016/j.canlet.2005.06.007. [DOI] [PubMed] [Google Scholar]
- 15.Hermo L, Andonian S. Regulation of sulfated glycoprotein-1 and cathepsin D expression in adult rat epididymis. J Androl. 2003;24:408–22. doi: 10.1002/j.1939-4640.2003.tb02690.x. [DOI] [PubMed] [Google Scholar]
- 16.Yeung KC, Rose DW, Dhillon AS, et al. Raf kinase inhibitor protein interacts with NF-kappaB-inducing kinase and TAK1 and inhibits NF-kappaB activation. Mol Cell Biol. 2001;21:7207–17. doi: 10.1128/MCB.21.21.7207-7217.2001. [DOI] [PMC free article] [PubMed] [Google Scholar]
- 17.Loupatty FJ, van der Steen A, Ijlst L, et al. Clinical, biochemical, and molecular findings in three patients with 3-hydroxyisobutyric aciduria. Mol Genet Metab. 2006;87:243–8. doi: 10.1016/j.ymgme.2005.09.019. [DOI] [PubMed] [Google Scholar]
- 18.Boehlen F, Clemetson KJ. Platelet chemokines and their receptors: what is their relevance to platelet storage and transfusion practice? Transfus Med. 2001;11:403–17. doi: 10.1046/j.1365-3148.2001.00340.x. [DOI] [PubMed] [Google Scholar]
- 19.Solomon SS, Buss N, Shull J, et al. Proteome of H-411E (liver) cells exposed to insulin and tumor necrosis factor-alpha: analysis of proteins involved in insulin resistance. J Lab Clin Med. 2005;145:275–83. doi: 10.1016/j.lab.2005.02.013. [DOI] [PubMed] [Google Scholar]
- 20.Padmanabhan B, Kuzuhara T, Adachi N, Horikoshi M. The crystal structure of CCG1/TAF(II)250-interacting factor B (CIB) J Biol Chem. 2004;279:9615–24. doi: 10.1074/jbc.M312165200. [DOI] [PubMed] [Google Scholar]
- 21.Scandalios JG. Oxidative stress: molecular perception and transduction of signals triggering antioxidant gene defenses. Braz J Med Biol Res. 2005;38:995–1014. doi: 10.1590/s0100-879x2005000700003. [DOI] [PubMed] [Google Scholar]
- 22.Koretzky GA. The role of Grb2-associated proteins in T cell activation. Immunol Today. 1997;18:401–6. doi: 10.1016/s0167-5699(97)01088-8. [DOI] [PubMed] [Google Scholar]
- 23.Zhang X, Beuron F, Freemont PS. Machinery of protein folding and unfolding. Curr Opin Struct Biol. 2002;12:231–8. doi: 10.1016/s0959-440x(02)00315-9. [DOI] [PubMed] [Google Scholar]
- 24.Calvo KR, Liotta LA, Petricoin EF. Clinical proteomics: from biomarker discovery and cell signaling profiles to individualized personal therapy. Biosci Rep. 2005;25:107–25. doi: 10.1007/s10540-005-2851-3. [DOI] [PubMed] [Google Scholar]