

Abstract
BACKGROUND
Racial and socioeconomic disparities have been identified in osteoporosis screening.
OBJECTIVE
To determine whether racial and socioeconomic disparities in osteoporosis screening diminish after hip fracture.
DESIGN
Retrospective cohort study of female Medicare patients.
SETTING
Entire states of Illinois, New York, and Florida.
PARTICIPANTS
Female Medicare recipients aged 65–89 years old with hip fractures between January 2001 and June 2003.
MEASUREMENTS
Differences in bone density testing by race/ethnicity and zip-code level socioeconomic characteristics during the 2-year period preceding and the 6-month period following a hip fracture.
RESULTS
Among all 35,681 women with hip fractures, 20.7% underwent bone mineral density testing in the 2 years prior to fracture and another 6.2% underwent testing in the 6 months after fracture. In a logistic regression model adjusted for age, state, and comorbidity, women of black race were about half as likely (RR 0.52 [0.43, 0.62]) and Hispanic women about 2/3 as likely (RR 0.66 [0.54, 0.80]) as white women to undergo testing before their fracture. They remained less likely (RR 0.66 [0.50, 0.88] and 0.58 [0.39, 0.87], respectively) to undergo testing after fracture. In contrast, women residing in zip codes in the lowest tertile of income and education were less likely than those in higher-income and educational tertiles to undergo testing before fracture, but were no less likely to undergo testing in the 6 months after fracture.
CONCLUSIONS
Racial, but not socioeconomic, differences in osteoporosis evaluation continued to occur even after Medicare patients had demonstrated their propensity to fracture. Future interventions may need to target racial/ethnic and socioeconomic disparities differently.
KEY WORDS: disparities, osteoporosis screening, hip fracture
INTRODUCTION
Osteoporosis screening rates are known to be lower among black and Hispanic women than among white women. Previous studies have found 20–50% lower use of bone density screening for black women, and 23% less testing for Hispanic women.1–3 Racial differences in screening are generally interpreted as indicators of poorer quality of care.4 However, there are possible legitimate explanations for racial differences in osteoporosis screening among women who have not had a fracture. Fracture rates are substantially lower for black and Hispanic women than for white women,5,6 and good evidence for the ability of bone density to predict fracture in nonwhite women has been published only recently.5,6 Also, evidence for fracture reduction with osteoporosis treatment is very limited for racial minorities, as clinical trials have enrolled substantially white populations.7–9 For these reasons, either doctors or patients might reasonably have concluded that bone density testing for primary screening offers uncertain benefits for minority women.
The situation changes, however, once a fracture occurs. Hip fracture patients in a large longitudinal study had a recurrent fracture risk of 10.4 fractures/100 person-years, 1.6 times greater than controls even after adjustment for fracture risk factors.10 There is no evidence that fracture recurrence rates vary by race. Therefore, once a fracture occurs, it is possible that a “catch-up” phenomenon in bone density testing could occur—that is that women who did not undergo primary screening prior to a fracture would receive testing after it. This should be especially true for Medicare patients with hip fractures, as hospitalization is almost universal and Medicare pays for testing. While an argument could be made for empiric osteoporosis treatment in this group, an empiric strategy might result in the treatment of many women who would not greatly benefit from a medication to improve bone density. Guidelines differ as to whether treatment should be instituted after fracture regardless of results of bone density testing. All major guidelines recommend, however, that if testing has not already been performed recently, it be done after fracture to determine disease severity and improve risk stratification.11–14
In this study, we performed a population-based study of women with hip fractures in 3 large states.15 We examined whether differences in testing rates by race or socioeconomic status were present prior to fracture, and then whether there was any evidence of improvement in disparities after fracture.
METHODS
Data Sources
Eligible subjects were identified from a database containing all women eligible for Medicare in 3 states chosen for their large populations, for their racial and ethnic diversity, and because they are in different regions of the country: Florida, Illinois, and New York. Since July 1 1998, Medicare has paid for bone density tests for all postmenopausal women every 2 years. Medicare files examined included (1) the inpatient standard analytical file (SAF), which contains inpatient hospital claims; (2) the carrier SAF file, which is derived from claims for physician services; and (3) the denominator file, which contains demographic information.
U.S. Census data were linked with the Medicare database to determine the population density and socioeconomic characteristics of the zip codes in which subjects resided. The institutional review board of the Medical College of Wisconsin approved the study design.
Study Population
Subjects were included in the study if they were female Medicare recipients who were residents of Florida, Illinois, or New York and had a fracture of the hip identified in claims during 2001, 2002, or the first 6 months of 2003. To have complete information about bone mineral density (BMD) testing prior to fracture, subjects were required to be Medicare-eligible throughout January 1 1999–December 30 2003 and to be aged 65–89 years old in 1999.
We identified hip fractures by adapting a validated algorithm for identifying hip fractures using diagnostic [International Classification of Diseases, 9th edition (ICD-9)] and current procedural terminology (CPT) codes.16 A complete description is included in the Appendix to the paper. In brief, patients with hip fracture were identified by ICD-9 code 820 or a procedure for hip fracture repair. Patients were excluded if the algorithm indicated that they were unlikely to have a hip fracture, for example, if they had no hip procedure and their codes for diagnoses came only from ambulatory settings or hospital admission, or if they had procedures that may be performed for other reasons (e.g., arthroplasty, which may be performed for osteoarthritis) and they had no fracture diagnosis.
Subjects were excluded if they had end-stage renal disease, had primary bone or metastatic cancer, or were in a health maintenance organization that does not submit individual claims to Medicare. Subjects were also excluded if the subject could not be linked to a zip code (n = 1,014) or if their race/ethnicity was not white, black, or Hispanic.
Definitions of Variables
A primary outcome measure of “bone density assessment” was created using CPT and Health Care Financing Administration Common Procedure Coding System codes for axial and appendicular skeleton dual energy x-ray absorptiometry or computed tomography, peripheral (appendicular) ultrasound, or photodensitometry. The precision error of densitometry is likely to exceed the yearly bone loss for the average postmenopausal woman,17,18 so Medicare will reimburse bone density testing only every 2 years for postmenopausal women. Bone density assessment was therefore examined for a 2-year time interval before the fracture. We attempted to balance the potential physical difficulty patients might have with testing shortly after hip fracture with the importance of timely institution of therapy, which can reduce subsequent fracture risk in 1–2 years. We concluded that testing for patients who had not previously been tested should be performed within 6 months after fracture, the same time frame as in a previous study of osteoporosis medication use.19 Bone density assessment was therefore examined for a 30-month interval from 2 years before to 6 months after the hip fracture.
Using Medicare denominator files, patient race and ethnicity were categorized as white, black, or Hispanic. Using 2000 census data linked to the patient’s zip code in the Medicare denominator file, we determined the median per capita income and the percent of all persons aged 25 and older who had completed high school in each subject’s zip code. Subjects were assigned to tertiles of these variables.20,21 We examined patient age at the date of hip fracture (categorized in 5-year increments) and state of residence as found in the denominator files.
Patient comorbidities identified from 2001 claims were measured using a comorbidity index of diagnoses and weights described by Charlson et al.22 and adapted to outpatient ICD-9-CM diagnoses by Deyo et al.23 and Klabunde et al.24 Each patient was assigned to a category of 0, 1, or 2 or more comorbidities.
Analysis
Descriptive statistics were used to characterize the study sample, and differences by race/ethnicity were examined using Chi-square and t tests as appropriate. The percent of patients who received a bone density test within the 24 months prior to fracture, 6 months after the fracture, and at any time during this period was calculated. The unadjusted relationships of patient race and other patient variables with bone density testing in each time period were examined using the chi square test.
We also developed a trichotomous logistic regression model using backward elimination of variables to examine whether there were differences by race, education, or income either before or after fractures occurred. Three outcomes were possible: never tested, tested within the 2 years prior to hip fracture, or not tested in the 2 prior years but tested in the 6 months after hip fracture. An outcome of bone density testing after fracture in this model would be conditional upon no receipt of testing in the 2-year interval prior to testing. The model included adjustments for patient age, state and urbanicity of residence, and comorbidity. Interactions between race, income, education, and all other variables were examined in this model. Results from the logistic regression model were converted from odds ratios to relative risk.25
RESULTS
The study examined 35,681 women with hip fractures, including over 1,000 black women and about 600 Hispanic women (Table 1). There were differences by race in age. Black and Hispanic women lived in lower-income and less-educated zip code areas and had greater comorbidity than white women.
Table 1.
Characteristics of Female White, Black, and Hispanic Medicare Patients with Hip Fracture During 1/1/2001–6/30/2003 (Percent)
| Patient characteristic | All (n = 35,681) | White (n = 34,039) | Black (n = 1,044) | Hispanic (n = 598) |
|---|---|---|---|---|
| Age | ||||
| 67–72 | 9.0 | 8.9 | 13.7 | 7.9 |
| 73–78 | 23.7 | 23.5 | 26.2 | 27.3 |
| 79–84 | 35.4 | 35.6 | 32.3 | 33.3 |
| 85–90 | 31.8 | 32.0 | 27.8 | 31.6 |
| Median per capita income in zip code* | ||||
| ≤$18,542 | 33.4 | 31.7 | 70.7 | 63.5 |
| $18,543–24,719 | 33.4 | 34.2 | 18.3 | 16.2 |
| ≥$24,720 | 33.2 | 34.1 | 11.0 | 20.2 |
| Percent high school graduates in zip code* | ||||
| ≤79.4% | 33.0 | 31.0 | 74.1 | 75.1 |
| 79.5–86.8% | 33.6 | 34.5 | 16.8 | 13.9 |
| ≥86.9% | 33.4 | 34.5 | 9.1 | 11.0 |
| State | ||||
| Florida | 34.2 | 33.8 | 29.3 | 70.9 |
| Illinois | 28.4 | 28.8 | 29.3 | 5.2 |
| New York | 37.3 | 37.4 | 41.4 | 23.9 |
| Nonurban residence† | 14.8 | 15.3 | 5.7 | 1.8 |
| Modified Charlson–Deyo score‡ | ||||
| 0 | 58.8 | 59.3 | 49.4 | 43.8 |
| 1 | 22.7 | 22.6 | 24.3 | 27.8 |
| 2 or more | 18.5 | 18.1 | 26.2 | 28.4 |
Patients were categorized as white, black, and Hispanic by the Center for Medicare and Medicaid Services. All P values for all characteristics shown differed by race with P < 0.001.
*According to 2000 U.S. Census
†Residence in a metropolitan statistical area with <1,000,000 residents
‡From co-morbidity index based on the diagnoses and weights described by Charlson et al.22 as adapted to ICD-9-CM diagnoses by Deyo et al.23 and Klabunde et al.24 (see text for further details)
Among the entire cohort, 20.7% of women had BMD testing during the 2 years prior to their fracture, and 6.2% additional women underwent BMD testing during the 6 months after the fracture, for a total of 26.9% who underwent testing during either time period. Racial differences in prefracture testing were prominent (Fig. 1), with black women about half as likely and Hispanic women about 3/4 as likely as white women (21.1% tested) to have had testing in the 2 years prior to their fracture. In the 6 months after the fracture, the racial differences were less marked, but 6.3% of the original cohort of white women were tested, making them again more likely than black (4.6% of the original cohort) or Hispanic women (4.0% of the original cohort) to have testing after the fracture. Therefore, racial differences remained prominent in testing rates overall.
Figure 1.
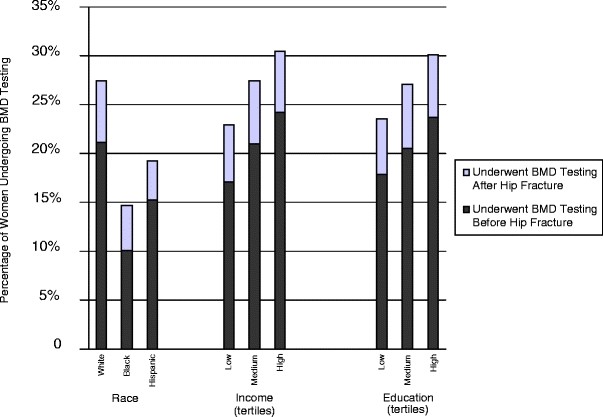
Receipt of bone density testing among women with hip fracture in the 24 months before and 6 months after fracture. Receipt of bone density testing among women aged 65–90 years old with a hip fracture during January 2001–June 30 2003 who were enrolled in Medicare in Florida, New York, and Illinois. The percentage of the total cohort of women and women stratified by race and socioeconomic status who underwent bone density testing before the fracture are shown in dark gray bars. The percentage of all women who received testing after (and not before) the fracture is shown in light gray bars above.
Differences in testing by income prefracture were also prominent (Fig. 1), as testing of women increased between 3 and 4% in a dose-dependent fashion from 17.0% for the lower-income tertile to 24.2% for the upper-income tertile. After fracture, women in the lowest tertile of income were less likely (5.9%) than women in the middle (6.4%) or upper tertiles (6.2%) to have had testing. Differences in testing by education showed a similar pattern to income.
A logistic regression model (Table 2) was developed to allow the examination of the independent effects of race and socioeconomic factors on testing, controlling for age, comorbidity, and state of residence. In the 2 years prior to fracture, women of black race were about half as likely (RR 0.52 [0.43, 0.62]) and Hispanic women about 2/3 as likely (RR 0.66 [0.54, 0.80]) as white women to receive testing. When compared with those residing in zip codes in the highest tertile of income, residents of the middle (RR 0.91 [0.86, 0.97]) or lowest tertile (RR 0.79 [0.73, 0.85]) were less likely to receive testing. There was a similar pattern for residence in a less-educated zip code (RR 0.93 [0.88, 0.99] for the middle tertile of education and RR 0.90 [0.84, 0.97] for the lowest tertile). Among those who did not undergo testing prior to the fracture, racial and ethnic differences persisted during the 6 months after the fracture. Both black (RR 0.66 [0.50, 0.88]) and Hispanic women (RR 0.58 [0.39, 0.87]) remained significantly less likely to undergo testing. However, there was no significant relationship of zip-code income or educational level with postfracture testing.
Table 2.
Effect of Patient Race and Socioeconomic Characteristics on Receipt of Bone Density Testing Among Women with Hip Fracture (Adjusted)
| Patient characteristic | Adjusted relative risk for receipt of bone density test | |
|---|---|---|
| Before fracture* | After fracture† | |
| Race/ethnicity | ||
| White | – | – |
| Black | 0.52 (0.43, 0.62) | 0.66 (0.50, 0.88) |
| Hispanic | 0.66 (0.54, 0.80) | 0.58 (0.39, 0.87) |
| Median per capita income in zip code ($) | ||
| ≥$24,720 | – | – |
| $18,543–24,719 | 0.91 (0.86, 0.97) | 1.00 (0.89, 1.13) |
| ≤$18,542 | 0.79 (0.73, 0.85) | 0.95 (0.82, 1.09) |
| High school graduates residing in zip code (%) | ||
| ≥86.9% | – | – |
| 79.4–86.8% | 0.93 (0.88, 0.99) | 0.99 (0.88, 1.12) |
| ≤79.3% | 0.90 (0.84, 0.97) | 0.88 (0.76, 1.02) |
| Age (years) | ||
| 67–72 | – | – |
| 73–78 | 0.89 (0.83, 0.96) | 0.78 (0.69, 0.89) |
| 79–84 | 0.71 (0.66, 0.76) | 0.57 (0.51, 0.66) |
| 85–90 | 0.51 (0.47, 0.55) | 0.35 (0.30, 0.41) |
| State of residence | ||
| Florida | – | – |
| Illinois | 0.56 (0.53, 0.59) | 0.80 (0.73, 0.89) |
| New York | 0.76 (0.72, 0.79) | 0.69 (0.63, 0.76) |
| Modified Charlson–Deyo score | ||
| 0 | – | – |
| 1 | 1.03 (0.98, 1.08) | 0.84 (0.75, 0.93) |
| 2 or more | 0.99 (0.93, 1.04) | 0.78 (0.70, 0.88) |
*Among all women in the cohort in the 24 months before fracture
†During the 6 months after fracture (among the 28,292 women who were not tested in the 24 months before the fracture)
Older age was strongly associated with reduced testing at both time intervals. There was also marked regional variation in bone density testing at both time intervals; women who had a hip fracture in either Illinois or New York were less likely than those in Florida to receive testing. There were no significant interactions between race/ethnicity, income, or education and any other variables, including state of residence, in the regression analysis.
DISCUSSION
In this study of over 35,000 insured women with hip fractures, women of black race were 48% and women of Hispanic ethnicity were 34% less likely to undergo bone density testing over a 2-year period prior to fracture, even with adjustment for age and comorbidity. Although women of these races may have lower baseline risk of fracture, there was no “catch-up” in testing for women of black race and Hispanic ethnicity in the 6 months after fracture, at which point their propensity for fracture had been established. Women residing in areas with lower education and income were also less likely to undergo bone density testing before their fractures. However, the disparities by income and education were no longer present during the 6 months after hip fracture.
Our findings of lower use of BMD in women of black race and Hispanic ethnicity for primary prevention before a fracture confirm other reports in the literature, mostly from single institutions or health maintenance organizations.1–3,26,27 These findings may have some legitimate explanations. Black and Hispanic women have a lower incidence of hip fracture and likely fewer fracture risk factors, and the predictive ability of BMD testing in these groups is not as well-studied as in white women.5,6 However, our findings that the disparities in primary prevention are not made up in testing for secondary prevention after fracture confirm a previous smaller report of 256 hip fracture patients in one health maintenance organization who reported never receiving testing.26 This disparity in testing after fracture cannot be easily justified, as existing professional guidelines11–14 clearly recommend testing after fracture, if it has not been performed earlier.
There are a range of patient and system-level factors previously shown to be involved in racial and ethnic disparities in medical care, and our study could not examine many of these. However, black women have previously been shown to be slightly older28 and have more comorbid illnesses29 at the time of their hip fractures, and we adjusted for both factors in our study. Any residual confounding effect, for example, from incomplete ascertainment of comorbidity because of our use of administrative data, would be unlikely to explain such large disparities. As fractures carry large risk of functional impairment and therapies can reduce fracture risk in a short time, current guidelines do not recommend variations in osteoporosis assessment by comorbidity. While we could not directly examine whether physician knowledge or even bias plays a role in our findings, evidence continues to mount that provider contributions to racial disparities can be important.4,30 It is possible that providers considering fracture prevention inappropriately apply population statistics to individual patients, a cognitive error sometimes also called misapplication of base rates or the ecological fallacy.30,31 If physicians overemphasize the differences in fracture risk by race/ethnicity, or perhaps perceive the risk in nonwhite women as so low as to be unimportant, they may reduce their attention to fracture prevention.
In contrast to the findings for race and ethnicity, socioeconomic status measured at the neighborhood level appeared to act primarily on receipt of bone density tests before fracture. Women in our study all had Medicare insurance and, therefore, access to BMD testing throughout the study period. Our finding that racial disparities in BMD testing persisted after fracture, but socioeconomic disparities did not, suggests the possibility of different mechanisms for racial and socioeconomic disparities in BMD screening. There are many components to access to care;32 for osteoporosis screening, availability of a bone densitometer and health care providers’ knowledge of reimbursement for testing may both be important. It is possible that access improves in some ways after fracture for lower-income and lower-education women but not for Hispanic or black women. Nearly all women with hip fractures contact the health care system through hospitalization, and half are then institutionalized in a subacute facility at least short-term.33 Hip fracture patients with lower income or less education, but not Hispanic or black patients, might have been more likely to receive bone density testing as they increased their contact with clinicians or care facilities experienced with geriatric care. To our knowledge, our study is the first to show a difference in the patterns of socioeconomic and racial osteoporosis testing disparities.
Our study was limited by examination of only bone density testing and not treatment, and thus, we may have underestimated the attention paid to osteoporosis in some patients. However, our results are consistent with previous research into racial disparities in medication use after fracture.19 It is possible that clinicians were aware that direct data on the relationship of bone density with fractures for black women was lacking at the time of our study. However, extensive epidemiologic data showed substantial rates of fracture among many nonwhite populations, clinical risk factors that work through lowering bone density had been shown to predict fractures in black women,34 and several large randomized controlled trials of bisphosphonates7,8 had included nonwhite patients. Several studies published after the study period5,35 have confirmed the predictive ability of bone density for nonwhite patients. Our study is also limited by the relatively short time prior to fracture that was examined. However, as this study period began just after Medicare initiated reimbursement for bone density, any testing performed prior to this would have been reimbursed only through private insurance. Few of our study’s population of older women would thus have had testing more than 2 years before the fracture, although women with fractures later in our study period would have had more opportunity. We could not ascertain reasons why bone density tests were not performed in this study, which might include patient preference, compliance with ordered tests, or access to care. Finally, education and income levels of all residents of a zip code are used as a proxy for individual socioeconomic status in this study. Although such measures may capture some important elements of community-level social deprivation,36 they could not account for differences between the socioeconomic status of individuals and others living near them.
In summary, in our study of women with hip fractures in 3 large states, we found that black and Hispanic women enrolled in Medicare are much less likely to undergo osteoporosis testing than their white counterparts. Of most concern, our study suggests that racial differences in osteoporosis care continue to occur even after a patient has demonstrated her propensity to fracture. It appears likely that physicians not only performed screening bone density tests at different rates for women of different races, but that they did not use hip fracture as a “signal” of bone fragility for patients of all races. Recent research showing the persistence of disparities in multiple types of medical care well into the 21st century37 suggests that simply increasing awareness in the medical community is not enough to improve the disparities we identified. Our research further suggests that interventions may need to be different for racial/ethnic disparities than for socioeconomic disparities in osteoporosis care. Such interventions might include attempts to reduce individual medical provider bias and stereotyping, which show promise in the psychological literature.4,30 Interventions targeted at health systems, such as use of clinical pathways, have been successful in improving outcomes in several diseases38 including primarily white patients with fragility fractures.39 Further investigation is needed to determine whether similar interventions or combinations of interventions could reduce racial disparities and improve osteoporosis care for all.
Acknowledgements
Presented at the 28th Annual Society of General Internal Medicine meeting in New Orleans, LA, May 12–14 2005. The study was funded by the National Institutes of Health, which had no role in determining the study design, analysis, interpretation of the data, writing of the report, or decision to submit the paper for publication. Grant support: PHS NIA #K08-AG021631 to Dr. Neuner.
Conflict of Interest None disclosed.
Appendix
Table 3.
Algorithm for identifying hip fractures
| Site | Diagnoses (ICD-9-CM) | Hospital procedures (ICD-9-CM) | Physician Identification (CPT) | Physician confirmation (CPT) |
|---|---|---|---|---|
| Hip | 733.14, 820 | 78.55, 79.05, 79.15, 79.25, 79.35, 79.65, 81.40, 81.51, 81.52, 81.61, 81.62 | 27125–27127, 27230, 27232, 27234–27236, 27238, 27240, 27242, 27244, 27246, 27248 | 27130, 27131, 29010, 29015, 29020, 29025, 29035, 29040, 29044, 29046, 29305, 29325, 29345, 29355, 29358, 29365, 29505, 29520, 29799 |
| Femoral shaft | 733.15, 821 | 27500, 27502, 27504, 27506, 27508, 27510, 27512, 27514 | Same as hip | |
| Arthroplasty | 715 (primary) | 81.3–81.9 | ||
| Old fracture or other bone disease | 733.4, 733.8, 733.9, 905.4, 996.4, 996.6, 996.7, E878.1, V54.0, V66.4, V67.4 |
Inclusion criteria:
Continously enrolled in non-health maintenance organization, Medicare parts A and B January 1999 to December 2003
White, black, and Hispanic females
Continuously residing in Florida, Illinois, or New York from 1999 to 2003
Aged +65 years old as of January 1 1999
Residential zip code available and corresponding U.S. Census data available
- Each patient has at least one of the following:
- An inpatient SAF claim with a hip/femoral shaft fracture discharge diagnosis
- An inpatient SAF claim with a hip fracture hospital procedure
- An inpatient SAF claim with a hip/femoral shaft fracture admission diagnosis and/or a carrier SAF claim with a hip/femoral shaft fracture diagnosis
- A carrier SAF claim with a hip/femoral shaft fracture physician identification procedure
- A carrier SAF claim with a hip/femoral shaft fracture physician confirmation procedure
Exclusion criteria:
Care of anthroplasty, old fracture, or other bone disease
Orthopedic surgeon claims present with no identification nor confirmation procedures
Hospital procedure only
Hospital admission diagnosis and/or physician diagnosis only
Physician confirmation procedure only
A hip fracture found prior to January 1 2001
No hip fracture found during the period from January 1 2001 to June 30 2003
Age at time of fracture >90 years
References
- 1.Neuner JM, Binkley N, Sparapani RA, Laud PW, Nattinger AB. Bone density testing in older women and its association with patient age. J Am Geriatr Soc. 2006;54(3):485–9. [DOI] [PubMed]
- 2.Solomon DH, Brookhart MA, Gandhi TK, et al. Adherence with osteoporosis practice guidelines: a multilevel analysis of patient, physician, and practice setting characteristics. Am J Med. 2004;117(12):919–24. [DOI] [PubMed]
- 3.Miller RG, Ashar BH, Cohen J, et al. Disparities in osteoporosis screening between at-risk African-American and white women. J Gen Intern Med. 2005;20(9):847–51. [DOI] [PMC free article] [PubMed]
- 4.Smedley BD, Stith AY, Nelson AR. Unequal Treatment: Confronting Racial and Ethnic Disparities in Healthcare. Washington, DC: The National Academies Press; 2002. [PubMed]
- 5.Cauley JA, Lui L-Y, Ensrud KE, et al. Bone mineral density and the risk of incident nonspinal fractures in black and white women. JAMA. 2005;293(17):2102–8. [DOI] [PubMed]
- 6.Barrett-Connor E, Siris ES, Wehren LE, et al. Osteoporosis and fracture risk in women of different ethnic groups. J Bone Miner Res. 2005;20(2):185–94. [DOI] [PubMed]
- 7.Cummings SR, Black DM, Thompson DE, et al. Effect of alendronate on risk of fracture in women with low bone density but without vertebral fractures: results from the Fracture Intervention Trial. JAMA. 1998;280(24):2077–82. [DOI] [PubMed]
- 8.Harris S, Watts N, Genant H, et al. Effects of risedronate treatment on vertebral and nonvertebral fractures in women with postmenopausal osteoporosis: a randomized controlled trial. JAMA. 1999;282:1344–52. [DOI] [PubMed]
- 9.Liberman UA, Weiss SR, Broll J, et al. Effect of oral alendronate on bone mineral density and the incidence of fractures in postmenopausal osteoporosis. The Alendronate Phase III Osteoporosis Treatment Study Group. N Engl J Med. 1995;333(22):1437–43. [DOI] [PubMed]
- 10.Colon-Emeric C, Kuchibhatla M, Pieper C, et al. The contribution of hip fracture to risk of subsequent fractures: data from two longitudinal studies. Osteoporos Int. 2003;14(11):879. [DOI] [PubMed]
- 11.U.S. Department of Health and Human Services. Bone Health and Osteoporosis: A Report of the Surgeon General. Rockville, MD: U.S. Department of Health and Human Services, Office of the Surgeon General; 2004.
- 12.Hodgson SF, Watts NB, Bilezikian JP, et al. American Association of Clinical Endocrinologists 2001 medical guidelines for clinical practice for the prevention and management of postmenopausal osteoporosis. Endocr Pract. 2001;7(4):293–312. [PubMed]
- 13.National Osteoporosis Foundation. Physicians’ Guide to Prevention and Treatment of Osteoporosis. Washington, DC: National Osteoporosis Foundation; 1999.
- 14.NIH. Osteoporosis Prevention, Diagnosis, and Therapy. NIH Consensus Statement Online March 27–29 2000. (Accessed 2006 November 21); 17(1):1–36. [PubMed]
- 15.Center for Medicare and Medicaid Services. Data User’s Reference Guide. 2000. Available at http://www.resdac.umn.edu/Medicare/data_file_descriptions.asp#rif. (Accessed 2007 June 2).
- 16.Ray WA, Griffin MR, Fought RL, Adams ML. Identification of fractures from computerized Medicare files. J Clin Epidemiol. 1992;45(7):703–14. [DOI] [PubMed]
- 17.U.S. Department of Health and Human Services. Health Technology Assessment. Number 6: Bone Densitometry: Patients with Asymtomatic Hyperparathyroidism. AHRQ Publication No. 96-0004. Rockville, MD: Agency for Health Care Policy and Research, U.S. Department of Health and Human Services; 1995.
- 18.Bates DW, Black DM, Cummings SR. Clinical use of bone densitometry: clinical applications. JAMA. 2002;288(15):1898–900. [DOI] [PubMed]
- 19.Solomon DH, Finkelstein JS, Katz JN, Mogun H, Avorn J. Underuse of osteoporosis medications in elderly patients with fractures. Am J Med. 2003;115(5):398–400. [DOI] [PubMed]
- 20.Krieger N. Overcoming the absence of socioeconomic data in medical records: validation and application of a census-based methodology. Am J Public Health. 1992;82:703–10. [DOI] [PMC free article] [PubMed]
- 21.Geronimus AT, Bound J. Use of census-based aggregate variables to proxy for socioeconomic group: evidence from national samples. Am J Epidemiol. 1998;148(5):475–86. [DOI] [PubMed]
- 22.Charlson M, Pompei P, Ales K, MacKenzie C. A new method of classifying prognostic comorbidity in longitudinal studies. J Chronic Dis. 1987;40(5):373–83. [DOI] [PubMed]
- 23.Deyo RA, Cherkin DC, Ciol MA. Adapting a clinical comorbidity index for use with ICD-9-CM administrative databases. J Clin Epidemiol. 1992;45(6):613–9. [DOI] [PubMed]
- 24.Klabunde CN, Potosky AL, Legler JM, Warren JL. Development of a comorbidity index using physician claims data. J Clin Epidemiol. 2000;53(12):1258–67. [DOI] [PubMed]
- 25.Zhang J, Yu KF. What’s the relative risk? A method of correcting the odds ratio in cohort studies of common outcomes. JAMA. 1998;280(19):1690–1. [DOI] [PubMed]
- 26.Mudano AS, Casebeer L, Patino F, et al. Racial disparities in osteoporosis prevention in a managed care population. South Med J. 2003;96(5):445–51. [DOI] [PubMed]
- 27.Wilkins CH, Goldfeder JS. Osteoporosis screening is unjustifiably low in older African-American women. J Natl Med Assoc. 2004;96(4):461–7. [PMC free article] [PubMed]
- 28.Jacobsen SJ, Goldberg J, Miles TP, Brody JA, Stiers W, Rimm A. Race and sex differences in mortality following fracture of the hip. Am J Public Health. 1992;82(8):1147–50. [DOI] [PMC free article] [PubMed]
- 29.Furstenberg A, Mezey M. Differences in outcome between black and white elderly hip fracture patients. J Chronic Dis. 1987;40(10):931–8. [DOI] [PubMed]
- 30.Burgess DJ, Fu SS, van Ryn M. Why do providers contribute to disparities and what can be done about it? J Gen Intern Med. 2004;19(11):1154–9. [DOI] [PMC free article] [PubMed]
- 31.Balsa AI, McGuire TG. Prejudice, clinical uncertainty and stereotyping as sources of health disparities. J Health Econ. 2003;22(1):89–116. [DOI] [PubMed]
- 32.Pathman D, Fowler-Brown A, Corbie-Smith G. Differences in access to outpatient medical care for black and white adults in the Rural South. Med Care. 2006;44(5):429–38. [DOI] [PubMed]
- 33.U.S. Congress Office of Technology Assessment. Hip Fracture Outcomes in People Age 50 and Over—Background Paper. OTA-BP-H-120. Washington, DC: U.S. Government Printing Office; 1994.
- 34.Grisso JA, Kelsey JL, Strom BL, et al. Risk factors for hip fracture in black women. N Engl J Med. 1994;330(22):1555–9. [DOI] [PubMed]
- 35.Barrett-Connor E, Siris ES, Wehren LE, et al. Osteoporosis and fracture risk in women of different ethnic groups. J Bone Miner Res. 2005;20(2):185–94. [DOI] [PubMed]
- 36.Braveman PA, Cubbin C, Egerter S, et al. Socioeconomic status in health research: one size does not fit all. JAMA. 2005;294(22):2879–88. [DOI] [PubMed]
- 37.Lurie N. Health disparities—less talk, more action. N Engl J Med. 2005;353(7):727–9. [DOI] [PubMed]
- 38.Campbell H, Hotchkiss R, Bradshaw N, Porteous M. Integrated care pathways. BMJ. 1998;316(7125):133–7. [DOI] [PMC free article] [PubMed]
- 39.Harrington JT, Barash HL, Day S, Lease J. Redesigning the care of fragility fracture patients to improve osteoporosis management: a health care improvement project. Arthritis Rheum. 2005;53(2):198–204. [DOI] [PubMed]