

Abstract
BACKGROUND
Intensive lifestyle intervention significantly reduces the progression to diabetes in high-risk individuals.
OBJECTIVE
It is not known whether a program of moderate intervention might effectively reduce metabolic abnormalities in the general population.
DESIGN
Two-arm randomized controlled 1-year trial.
PATIENTS
Three hundred and thirty-five patients participated from a dysmetabolic population-based cohort of 375 adults aged 45–64 years in northwestern Italy.
MEASUREMENTS
We compared the effectiveness of a general recommendation-based program of lifestyle intervention carried out by trained professionals versus standard unstructured information given by family physicians at reducing the prevalence of multiple metabolic and inflammatory abnormalities.
RESULTS
At baseline, clinical/anthropometric/laboratory and lifestyle characteristics of the intervention (n = 169) and control (n = 166) groups were not significantly different. The former significantly reduced total/saturated fat intake and increased polyunsaturated fat/fiber intake and exercise level compared to the controls. Weight, waist circumference, high-sensitivity C-reactive protein, and most of the metabolic syndrome components decreased in the intervention group and increased in the controls after 12 months. Lifestyle intervention significantly reduced metabolic syndrome (odds ratio [OR] = 0.28; 95% CI 0.18–0.44), with a 31% (21–41) absolute risk reduction, corresponding to 3.2 (2–5) patients needing to be treated to prevent 1 case after 12 months. The intervention significantly reduced the prevalence of central obesity (OR = 0.33; 0.20–0.56), and hypertriglyceridemia (OR = 0.48; 0.31–0.75) and the incidence of diabetes (OR = 0.23; 0.06–0.85).
CONCLUSION
A lifestyle intervention based on general recommendations was effective in reducing multiple metabolic/inflammatory abnormalities. The usual care by family physicians was ineffective at modifying progressive metabolic deterioration in high-risk individuals.
KEY WORDS: C-reactive protein, family physicians, hyperglycemia, lifestyle intervention, metabolic syndrome
INTRODUCTION
Background
Intensive programs to effect lifestyle changes significantly reduce or delay the onset of diabetes in high-risk individuals.1–3 Their cost-effectiveness is indeed uncertain,4, 5 and some programs have proven too expensive for National Health implementation.5
There is a continuing epidemic of metabolic syndrome, the concurrence of hyperglycemia, dyslipidemia, hypertension, and visceral obesity, which substantially increases the risk of type-2 diabetes and cardiovascular diseases.6, 7 A simple set of criteria for its diagnosis has been provided,8 which has been validated by many prospective studies9 despite being recently criticized.10 C-reactive protein (CRP), a sensitive systemic inflammation marker, is strongly associated with all metabolic syndrome components.11
The efficacy of lifestyle interventions in reducing metabolic syndrome prevalence has been evaluated by a few studies that have adopted a very intensive approach,12 very low-energy diets13 or specific diets.14–16
It is unknown if a less intensive, lower-cost intervention program might also be effective in the general population. In addition, although a brief 15-minute educational intervention by family physicians was effective in inducing weight loss,17 it is unknown how lifestyle advice provided by general practitioners during their usual practice might affect the prevalence of multiple metabolic abnormalities.
Objective
Our aim was to compare the effectiveness of two different modalities that recommend a healthier lifestyle to reduce multiple metabolic abnormalities—a lifestyle intervention program with general recommendations carried out by trained professionals and standard unstructured information given by the family physician—in a dysmetabolic population-based cohort.
PATIENTS AND METHODS
Participants
The prevalence of the metabolic syndrome was evaluated in a representative sample of adults from Asti (Northwestern Italy) between 2001 and 2003.18 Briefly, all subjects aged 45–64 (n = 1,877) from 6 family physicians, representative of the local Health Districts, were contacted. A metabolic screen was carried out on 1,658 subjects (88.3%). Results showed 383 patients with metabolic syndrome8 and 120 with two components of metabolic syndrome plus high-sensitivity CRP (hs-CRP) serum values ≥3 mg/L, the cutoff point that differentiates high-risk groups for future cardiovascular events.11
These 503 patients were further evaluated in September 2004 for eligibility. Exclusion criteria included the following diseases, which require specific diet and exercise recommendations: diabetes, cardiovascular diseases, chronic liver or kidney disease, and advanced cancer. Thirteen additional patients died or moved away. A total of 375 dysmetabolic patients were thus considered eligible (Fig. 1).
Figure 1.
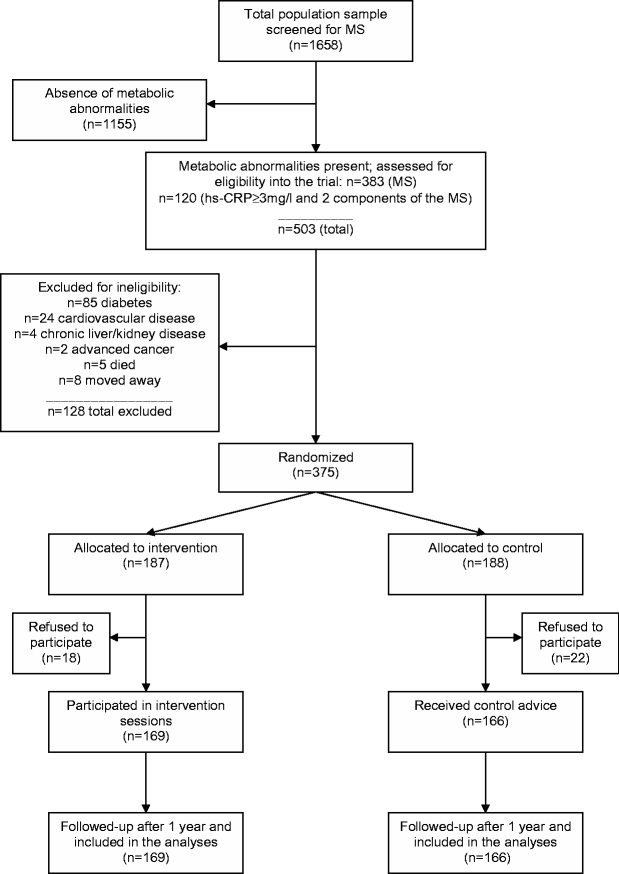
Flow of participants. MS= metabolic syndrome; hs-CRP= high-sensitivity C-reactive protein. All the 45- to 64-year-old residents in the province of Asti (n = 1,877) from 6 family physicians, whose patients were representative of the local sanitary districts, were contacted. Of these, 1,658 subjects (88.3%) participated in the metabolic screening.
The study was approved by the local Ethical Committee. All procedures were in compliance with the Helsinki Declaration principles.
Interventions
Between October and November 2004, all subjects received general information, emphasizing the importance of a healthy lifestyle from their family physicians, who gave advice according to their usual clinical practice and were blinded to the group assignment. No written information or recommendation was given by the family physicians. The general practitioners had previously participated in at least 3 meetings on standard practice lifestyle recommendations and the preventive efficacy of lifestyle changes.
The controls did not receive further specific individualized programs. They were reevaluated at the end of the follow-up after 1 year.
In addition to the family physician advice, the intervention group received detailed verbal and written individualized recommendations from trained professionals (nutritionists, specialists in endocrinology, and internal medicine). From December 2004 to December 2005, 5 sessions of at least 60 minutes covering diet, exercise, and behavior modifications were held, the first was a one-to-one meeting and was followed by group sessions based on behavioral counseling and focusing on practical lifestyle tips (Table 1).
Table 1.
Organization of Educational Sessions in the Intervention Group
| Session | Topics |
|---|---|
| First Individual Session | Each participant received: |
| - An individually prescribed written normo- or hypocaloric diet, tailored to the individual weight and reported dietary intake (recommended caloric distribution: 50–60% carbohydrates, 15–20% proteins, <30% fat, <10% saturated fat, up to 10% polyunsaturated fat, 20- to 30-g fiber) | |
| - General written dietary recommendations (about cooking, lowering fat intake, reducing salt intake, reducing beverages and food with added sugars, and counting calories from alcoholic beverages) and written options for dining out, such as eating a sandwich or a single dish instead of a meal | |
| - Written recommendations for physical activity | |
| - A brief written guide on behavior change | |
| - A copy of the food pyramid | |
| - Explanations about benefits of diet and exercise in controlling metabolic abnormalities | |
| - Individualized exercise and weight loss goals | |
| Subsequent 4 Interactive Group Sessions (about 10–12 patients per group): | - A session on: food composition, how to identify total/saturated fat and high-calorie density foods, how to choose high-fiber foods, the food pyramid |
| - A session on: portion control, identification of common dietary mistakes, suggestion of low calorie, low fat alternatives and related behavioral counseling | |
| - A session on: strategies for out-of-home eating and healthful food shopping and related behavioral suggestions | |
| - A session on: physical activity benefits, how to increase daily exercise and to include physical movement into habitual activities. |
During the first session, an individually prescribed diet was given, in line with existing guidelines.19 Similarly, advice on exercise was individualized,19 mainly by suggesting moderate-intensity activity, such as brisk walks for at least 150 minutes/week.
To minimize the potential lack of fidelity, the professional health care providers (n = 8) were assigned to the sessions in a quasirandomized mode (i.e., a scheduled rotation of experts among sessions to assure a balanced intervention for all subjects), and the delivered information was controlled. Each provider checked messages previously given and patients’ expectations. The sessions had a flexible structure, sensitive to cultural differences and patient expectations, that combined a structured core (common topics, recommendations, and educational leaflets) with flexibility in verbal presentation tailored to requirements and retention capacity. The sessions might therefore deal with arguments of the previous session, if these had not completely retained. This allowed supervision of the previously delivered information, rehearsal of sensitive topics, management of difficult patients, and high patient acceptability.
Patient compliance was assessed by evaluating questionnaires and meeting attendance; the result was similar between patient subgroups.
Outcomes
The primary end point was the between-group change in metabolic syndrome prevalence after 1 year from randomization. Secondary end points were the within- and between-group variations in each metabolic and inflammatory variable measured.
Sample Size
With a total sample of 375 subjects and a two-tailed 0.05 α value, the study achieved a 90% power to detect a 0.15 difference in the between-group metabolic syndrome prevalence (−5% controls, −20% intervention group).
Randomization: Sequence Generation
Participants were stratified according to age, sex, education level, general practitioner, area of residence, and number of metabolic syndrome components. Members of the same family who lived and ate together were considered as a cluster. After collecting baseline data for all participants, the randomization procedure was automatically performed by a statistician using an SAS program developed to minimize the differences between the two groups for all stratifying variables. The patients were randomly allocated to receive either standard lifestyle recommendations from their physicians (control group, n = 188) or a structured lifestyle intervention program for 1 year carried out by health professionals (intervention group, n = 187).
Randomization: Allocation Concealment
Random allocation with a minimization algorithm was centrally performed in a single step. The researchers then received the two lists of nominative data. The possibility for researchers to predict or influence the allocation of participants was thus completely prevented.
For practical reasons, informed consent was collected after the randomization procedure.
Blinding
Because of the nature of the intervention, blinding participants and health professionals was not possible. Family physicians, the physicians who collected data, the dietician, and the laboratory personnel were blinded to the group assignment.
Measurements
All subjects completed a validated semiquantitative food-frequency questionnaire20 and the Minnesota-Leisure-Time-Physical-Activity questionnaire21 before and after the study.
A dietician blindly checked all questionnaires for completeness, internal coherence, and plausibility. Weight, waist circumference, and blood pressure were measured. Fasting glucose, insulin, triglycerides, high-density lipoprotein (HDL) cholesterol, uric acid, and hs-CRP values were measured before and after the study in both groups. Laboratory methods have been previously described.18
Diabetes and impaired fasting glucose were defined according to published recommendations22 Metabolic syndrome was defined by the National Cholesterol Education Program criteria as having ≥3 of the following five criteria: fasting glucose ≥6.1 mmol/L; blood pressure ≥ 130/85 mmHg; triglycerides ≥1.69 mmol/L; high-density lipoprotein (HDL) cholesterol <1.29 mmol/L (females) or <1.04 mmol/L (males), and waist circumference >88 cm (females) or >102 cm (males).8 Individuals reporting either current antihypertensive or triglyceride-lowering medications were considered positive for the respective criterion regardless of values measured.
Insulin resistance was calculated from the Homeostasis-Model-Assessment score for insulin resistance.23
The physical activity level was calculated as the product of duration and frequency of each activity (in hours/week), weighted by an estimate of the metabolic equivalent of the activity, and summed for activities performed.
Statistical Analyses
The t test for paired data was applied to investigate within-group variable variations (after–before); the t test for independent samples, assuming either equal or unequal variances, was performed to assess between-group differences in these variations. Because the distributions of hs-CRP, insulin, Homeostasis-Model-Assessment score and triglyceride values were positively skewed, we used Wilcoxon rank-sum (Mann–Whitney) test to evaluate between-group changes. For these variables, the confidence intervals for median differences were calculated by Hodges–Lehmann test.
A multiple logistic regression model, using the after-study presence of metabolic abnormalities as the dependent variable, evaluated their association with the intervention after adjusting for age, sex, and education level.
Ordinal logistic regression was used to analyze the relationship between the number of components and the type of intervention received. Because the score test result for the proportional odds assumption was nonsignificant, a cumulative odds model was fitted after adjusting for age, sex, and education level. Exploratory analyses, including interaction terms in the models, were performed to assess important effect modifications in subgroups.
RESULTS
Written informed consent to participate was not given by 18 of 187 (9.6%) and 22 of 188 (11.7%) subjects from the intervention group and the control group, respectively. The final distribution was 169 and 166 subjects, respectively (Fig. 1).
All 335 participants completed the study and both questionnaires.
No significant difference was evident at baseline between groups, both for clinical and laboratory characteristics (Table 2) and for nutrient intake and exercise level (Table 3).
Table 2.
Clinical and Laboratory Baseline Characteristics of the Patients
| Characteristics* | Intervention Group (n = 169) | Control Group (n = 166) |
|---|---|---|
| Age (years) | 55.7 ± 5.7 | 55.7 ± 5.6 |
| Males (%) | 41.4 | 42.2 |
| Non-smoking (%) | 78.1 | 78.3 |
| Education level (%): | ||
| University | 7.1 | 3.0 |
| Secondary school | 14.2 | 17.5 |
| Primary school | 78.7 | 79.5 |
| Leisure physical activity (metabolic equivalent of the activity—hr/week) | 18.9 ± 13.3 | 18.1 ± 16.0 |
| Alcohol (g/day) | 15.9 ± 23.6 | 16.5 ± 23.2 |
| Height (m) | 1.65 ± 9.9 | 1.65 ± 9.6 |
| Weight (kg) | 81.7 ± 14.9 | 81.3 ± 13.5 |
| Waist (cm) | 99.6 ± 11.6 | 99.8 ± 10.6 |
| BMI (kg/m2) | 29.7 ± 4.1 | 29.8 ± 4.6 |
| Systolic pressure (mmHg) | 142.6 ± 14.1 | 141.5 ± 15.2 |
| Diastolic pressure (mmHg) | 88.2 ± 8.8 | 87.8 ± 9.5 |
| Fasting glucose (mmol/L) | 5.8 ± 0.8 | 5.8 ± 0.7 |
| Total cholesterol (mmol/L) | 5.8 ± 1.1 | 6.0 ± 1.1 |
| HDL-cholesterol (mmol/L) | 1.4 ± 0.3 | 1.4 ± 0.3 |
| Triglycerides (mmol/L)† | 1.9 (0.9) | 1.9 (0.9) |
| Fasting insulin (pmol/L)† | 20.4 (24.0) | 21.3 (31.2) |
| Homeostasis-Model-Assessment score for Insulin Resistance (mmol/L×μU/mL)† | 0.81 (1.11) | 0.84 (1.33) |
| Hs-CRP (mg/L)† | 3.50 (4.60) | 3.10 (3.60) |
| Uric acid (μmol/L) | 216.7 ± 56.3 | 223.6 ± 59.5 |
| Metabolic syndrome (%)‡ | 70.4 | 72.3 |
| Hs-CRP ≥ 3 mg/L (%) | 56.2 | 50.6 |
| No components of the metabolic syndrome‡ | ||
| 2 | 29.6 | 27.7 |
| 3 | 56.2 | 60.2 |
| ≥ 4 | 14.2 | 12.1 |
| Taking antihypertensive drugs (%) | 36.1 | 33.7 |
| Taking statin/fibrates (%) | 6.5 | 6.0 |
All data are complete.
BMI=body mass index; hs-CRP=high-sensitivity C-reactive protein
*If not otherwise specified, data are reported as means (± standard deviation)
†Median ± inter-quartile range for not normally distributed values
‡The metabolic syndrome was defined in the presence of ≥3 of the following five criteria: fasting glucose ≥6.1 mmol/L; blood pressure ≥130/85 mmHg; triglycerides ≥1.69 mmol/L; HDL cholesterol <1.29 mmol/L (females) or <1.04 mmol/L (males) and waist circumference >88 cm (females) or >102 cm (males)8.
Table 3.
Dietary Intake and Exercise Before-and-After Lifestyle Intervention
| Variables* | Intervention Group (n = 169) | Control Group (n = 166) | P‡ | ||||||||
|---|---|---|---|---|---|---|---|---|---|---|---|
| Before | After | Difference | 95% CI | p† | Before | After | Difference | 95% CI | p† | ||
| Total calories (kcal/day) | 1,978.6 ± 692.5 | 1,904.0 ± 631.6 | −74.6 | −153.3 41.4 | .06 | 1,993.1 ± 633.8 | 2,018.8 ± 583.1 | 25.8 | −43.7 95.2 | .46 | .06 |
| Total fat (% energy) | 35.3 ± 5.2 | 32.7 ± 6.5 | −2.64 | −3.52 −1.76 | <.001 | 35.0 ± 5.8 | 35.0 ± 6.8 | −0.02 | −1.30 1.25 | .97 | <.001 |
| Saturated fat (% energy) | 12.3 ± 2.6 | 10.3 ± 3.7 | −1.97 | −2.53 −1.41 | <.001 | 12.0 ± 2.6 | 11.8 ± 3.3 | −0.17 | −0.72 0.38 | .54 | <.001 |
| Polyunsaturated fat (% energy) | 4.3 ± 1.3 | 5.3 ± 1.8 | 0.99 | 0.73 1.25 | <.001 | 4.1 ± 1.2 | 4.1 ± 1.5 | −0.04 | −0.32 0.24 | .78 | <.001 |
| Carbohydrate (% energy) | 48.2 ± 7.1 | 50.3 ± 7.7 | 2.14 | 1.02 3.26 | <.001 | 48.7 ± 7.0 | 47.8 ± 8.2 | −0.89 | −2.33 0.55 | .22 | .001 |
| Protein (% energy) | 16.5 ± 2.3 | 16.6 ± 5.6 | 0.09 | −0.80 0.98 | .84 | 16.3 ± 2.4 | 16.1 ± 4.7 | −0.21 | −0.89 0.47 | .54 | .60 |
| Fiber (g/day) | 19.2 ± 6.4 | 20.9 ± 6.6 | 1.70 | 1.11 2.29 | <.001 | 19.4 ± 7.8 | 19.6 ± 7.9 | 0.17 | −0.30 0.64 | .47 | <.001 |
| Physical activity (metabolic equivalent of activity –hr/week) | 18.9 ± 13.3 | 23.6 ± 17.7 | 4.73 | 2.91 6.55 | <.001 | 18.1 ± 16.0 | 17.8 ± 15.2 | −0.26 | −0.92 0.40 | .43 | <.001 |
All data are complete.
*Descriptive data, before and after intervention, are expressed as means ± standard deviation; absolute difference (end-of-study minus baseline values) with 95% CI
†p values obtained by comparing differences in the variable values within each group, using t test for paired-data
‡p values obtained by comparing differences in the variable values between the two groups, using Student’s t test.
The intervention group significantly reduced total/saturated fat intake and increased exercise levels and polyunsaturated fat and fiber intake (Table 3). No significant change was reported in the controls. Alcohol intake did not change in either group (data not reported).
Weight, waist circumference, body mass index (BMI), diastolic blood pressure, fasting glucose, triglycerides, hs-CRP, and uric acid values significantly decreased in the intervention group, while most variables worsened in the controls (Table 4). The between-group differences proved significant for all variables apart from total cholesterol values (Table 4).
Table 4.
Clinical Characteristics and Blood Variables Before-and-After Lifestyle Intervention
| Variables* | Intervention Group (n = 169) | Control Group (n = 166) | P‡ | ||||||||
|---|---|---|---|---|---|---|---|---|---|---|---|
| Before | After | Difference | 95% CI | p† | Before | After | Difference | 95% CI | p† | ||
| Weight (kg) | 81.7 ± 14.9 | 81.0 ± 15.7 | −0.75 | −1.49 −0.003 | .049 | 81.3 ± 13.5 | 82.9 ± 14.0 | 1.63 | 0.83 2.42 | <.001 | <.001 |
| Waist (cm) | 99.6 ± 11.6 | 97.1 ± 11.8 | −2.55 | −3.33 −1.76 | <.001 | 99.8 ± 10.6 | 101.7 ± 10.4 | 1.96 | 0.95 2.98 | <.001 | <.001 |
| BMI (kg/m2) | 29.7 ± 4.1 | 29.4 ± 4.4 | −0.29 | −0.56 −0.02 | .017 | 29.8 ± 4.6 | 30.4 ± 4.8 | 0.61 | 0.31 0.91 | <.001 | <.001 |
| Systolic pressure (mmHg) | 142.6 ± 14.1 | 140.7 ± 17.7 | −1.99 | −4.82 0.84 | .17 | 141.5 ± 15.2 | 146.3 ± 18.2 | 4.79 | 2.21 7.38 | <.001 | <.001 |
| Diastolic pressure (mmHg) | 88.2 ± 8.8 | 85.7 ± 8.9 | −2.57 | −3.97 −1.16 | <.001 | 87.8 ± 9.5 | 87.6 ± 10.6 | −0.28 | −1.80 1.24 | .72 | .03 |
| Fasting glucose (mmol/L) | 5.8 ± 0.8 | 5.6 ± 0.9 | −0.26 | −0.36 −0.16 | <.001 | 5.8 ± 0.7 | 5.9 ± 0.9 | 0.07 | −0.02 0.16 | .13 | <.001 |
| Total cholesterol (mmol/L) | 5.8 ± 1.1 | 5.8 ± 1.1 | −0.0006 | −0.13 0.13 | .99 | 6.0 ± 1.1 | 6.1 ± 1.1 | 0.06 | −0.08 0.19 | .41 | .55 |
| HDL cholesterol (mmol/L) | 1.4 ± 0.3 | 1.4 ± 0.3 | 0.02 | −0.003 0.04 | .10 | 1.5 ± 0.3 | 1.4 ± 0.3 | −0.07 | −0.09 −0.04 | <.001 | <.001 |
| Triglycerides (mmol/L)§ | 1.9 (0.9) | 1.6 (0.7) | −0.24∥ | −0.33 −0.15 | <.001 | 1.9 (0.9) | 1.8 (1.1) | −0.06∥ | −0.16 0.03 | .09 | <.001¶ |
| Fasting insulin (pmol/L)§ | 20.4 (24.0) | 20.4 (32.4) | 0∥ | −2.40 2.16 | .85 | 21.3 (31.2) | 57.0 (49.0) | 33.0∥ | 27.6 39.0 | <.001 | <.001¶ |
| HOMA (μU/mL×mmol/L)§ | 0.81 (1.11) | 0.80 (1.27) | −0.03∥ | −0.13 0.07 | .21 | 0.84 (1.33) | 2.51 (2.37) | 1.42∥ | 1.16 1.69 | <.001 | <.001¶ |
| Hs-CRP (mg/L)§ | 3.50 (4.60) | 2.40 (2.80) | −0.80∥ | −1.20 −0.40 | <.001 | 3.10 (3.60) | 4.00 (4.00) | 0.60∥ | 0.40 0.90 | <.001 | <.001¶ |
| Uric acid (μmol/L) | 216.7 ± 56.3 | 202.4 ± 60.0 | −14.3 | −20.0 −8.6 | <.001 | 223.6 ± 59.5 | 284.2 ± 76.6 | 60.7 | 52.6 68.7 | <.001 | <.001 |
All data are complete.
BMI=body mass index; HOMA=Homeostasis-Model-Assessment score for Insulin Resistance; hs-CRP=high-sensitivity C-reactive protein
*Descriptive data, before and after intervention, are expressed as means ± standard deviation; absolute difference (end-of-study minus baseline values) with 95% CI
†p values obtained by comparing differences in the variable values within each group, using t test for paired data
‡p values obtained by comparing differences in the variable values between the two groups, using Student t test (except for p values marked with ¶);
§Median ± inter-quartile range for not normally distributed values;
∥End-of-study minus baseline median differences, (the median difference is not necessarily the difference between medians); 95% CI calculated by robust Hodges–Lehmann test;
¶p values obtained by comparing differences in the variable values between the two groups using Wilcoxon rank sum (Mann–Whitney) test.
Lifestyle changes strongly reduced the prevalence of metabolic syndrome in the intervention group compared to controls (Table 5), with an absolute risk reduction (ARR) of 31% (95% CI 21–41) and a relative risk reduction (RRR) of 47% (95% CI 33–58). The number needed to treat (NNT) to prevent 1 case of metabolic syndrome was 3.2 (95% CI 2–5).
Table 5.
Association Between Intervention and Each After-Study Metabolic Condition
| Metabolic Conditions: | Intervention Group (n = 169) | Control Group (n = 166) | OR* | 95% CI | P | ||
|---|---|---|---|---|---|---|---|
| Before | After | Before | After | ||||
| Metabolic syndrome or hs-CRP ≥ 3 mg/L plus 2 components (%) | 100 | 52.1 | 100 | 92.8 | 0.08 | 0.04–0.16 | <.001 |
| Metabolic syndrome (%)† | 70.4 | 34.9 | 72.3 | 65.7 | 0.28 | 0.18–0.44 | <.001 |
| Metabolic syndrome components(%)† | |||||||
| Central obesity | 76.9 | 60.4 | 75.9 | 80.7 | 0.33 | 0.20–0.56 | <.001 |
| Hypertension | 94.1 | 84.6 | 93.4 | 89.2 | 0.67 | 0.35–1.29 | .23 |
| Hyperglycemia | 37.3 | 16.0 | 39.8 | 48.8 | 0.19 | 0.11–0.32 | <.001 |
| Low HDL cholesterol | 18.3 | 18.3 | 15.1 | 15.1 | 1.26 | 0.70–2.26 | .43 |
| Hypertriglyceridemia | 63.9 | 39.1 | 65.1 | 56.6 | 0.48 | 0.31–0.75 | .001 |
| Hs-CRP ≥ 3 mg/L (%) | 56.2 | 34.9 | 50.6 | 66.3 | 0.26 | 0.16–0.41 | <.001 |
| Diabetes (%) | – | 1.8 | – | 7.2 | 0.23 | 0.06–0.85 | .03 |
| Impaired fasting glucose (%) | 37.3 | 14.2 | 39.8 | 41.6 | 0.22 | 0.13–0.39 | <.001 |
| Overweight (BMI ≥ 25 kg/m2) | 91.7 | 83.4 | 85.5 | 89.8 | 0.58 | 0.30–1.10 | .10 |
| No. of components of the metabolic syndrome: | OR‡ | 95% CI | P | ||||
| 0–1 | – | 21.3 | – | 6.6 | |||
| 2 | 29.6 | 43.8 | 27.7 | 27.7 | |||
| 3 | 56.2 | 29.0 | 60.2 | 35.5 | 0.24 | 0.16–0.37 | <.001 |
| ≥4 | 14.2 | 5.9 | 12.1 | 30.1 | |||
Hs-CRP= high-sensitivity C-reactive protein
*OR and 95% CI estimated through a multiple logistic regression model for each metabolic condition at the end of the study (intervention vs control group), adjusted for age, sex, and level of education.
†The metabolic syndrome was defined in the presence of ≥3 of the following five criteria: fasting glucose ≥6.1 mmol/L; blood pressure ≥ 130/85 mmHg; triglycerides ≥1.69 mmol/L; HDL cholesterol <1.29 mmol/L (females) and <1.04 mmol/L (males); waist circumference >88 cm (females) and >102 cm (males) [8].
‡Ordinal logistic regression (score test for the proportional odds assumption: p = .20)
Results did not change after adjusting for the number of sessions attended.There was a weak positive correlation between the number of metabolic syndrome components at baseline and patient compliance: the average number of sessions attended increased from 4.1 for subjects with 2 components to 4.5 for those with ≥4 components (p for trend test = 0.28). No important effect modifications were evident for sex, age (>55 vs ≤55 years) or BMI (≥30 vs <30 kg/m2). Patients with primary school education showed a significantly higher prevalence of metabolic syndrome (37.6% in the intervention and 62.9% in the control group) compared to patients with secondary school/university education (25.0% vs 76.5%, respectively; p = 0.04 for the interaction term).
The prevalence of multiple metabolic/inflammatory abnormalities (combination of metabolic syndrome or hs-CRP ≥ 3 mg/L plus two components) was sharply reduced in the intervention group when compared to controls, corresponding to ARR = 40.7 (95% CI 32.2–49.2), RRR = 43.9 (95% CI 34.7–51.7) and NNT = 2.5 (95% CI 2–3). Most metabolic abnormalities, except overweight, hypertension, and low HDL cholesterol, significantly decreased in the intervention group, with odds ratios (ORs) between 0.2 and 0.5. The number of metabolic syndrome components was analyzed with an ordinal logistic regression model; the risk of having a higher score was 4 times lower in the intervention group (Table 5). Data did not change after adjusting for the number of sessions attended.
The prevalence of impaired fasting glucose was greatly reduced in the intervention group, and the incidence of diabetes was more than 3-fold lower than in the controls (NNT = 18.3; 95% CI 10–100) (Table 5).
A sensitivity analysis based on all 375 subjects (intent-to-treat population), assuming none of the refusals had improved during the study, was performed. The results were very similar to those based on the participants only: OR = 0.33 (0.21–0.50) for metabolic syndrome and OR = 0.09 (0.04–0.17) for multiple metabolic/inflammatory abnormalities.
There were 32 households, 16 in each group, representing <10% of patients. Changes in the before–after prevalence of metabolic conditions were very similar between households and other participants.
No adverse events were noted.
DISCUSSION
Lifestyle intervention, inducing a modest BMI and waist reduction, substantially affected the prevalence of metabolic syndrome and its components in a dysmetabolic population-based cohort. The efficacy of a modest weight loss on multiple metabolic abnormalities has already been proven,2,3 and might be mediated by a preferential reduction in visceral fat,24 as suggested by the relatively higher waist circumference reduction in our patients.
The intervention strategy determined an ARR = 31% in the prevalence of metabolic syndrome and an ARR = 40.7% in the prevalence of multiple metabolic/inflammatory abnormalities. Such a regimen seems highly effective because it requires very few patients to successfully treat one case (NNT = 3.2; 95% CI 2–5, and NNT = 2.5; 95% CI 2–3, respectively). These reductions are similar to those reported in previous studies using a more intensive approach.12–15 One example of such an intensive approach for intervention called for 1 session every 10 days for the first 24 weeks, monthly contacts thereafter, group courses lasting 4–6 weeks quarterly during maintenance, two supervised group exercise sessions per week, and a tool box approach (strategies include incentives, loaning aerobic exercise tapes or other home exercise equipment, liquid formula diets, home visits, etc.) to help participants achieve their goals.12 These intensive lifestyle interventions decreased the incidence and prevalence of metabolic syndrome by 41%12 and 55–80%, respectively.13–15
It should be noted that the definition of metabolic syndrome is based on components that may encompass borderline and not categorical risk factors; thus, a small reduction in a borderline positive value is sufficient to return to normality.
In contrast to other studies, the effects of lifestyle appear to be more strongly related to the correction of triglyceride, glucose, and waist circumference values, rather than blood pressure, weight, or HDL cholesterol.2,12,14,15 Possible explanations for this might be differences in ethnicity and dietary intake and higher weight loss obtained in other studies. Total caloric intake was not significantly reduced by our lifestyle program, another difference from other interventions,12,14,15,25 but a significant modification in exercise level, dietary fiber and lipid composition, with an increase in the ratio of polyunsaturated-to-saturated fat, was obtained in the intervention group. A detrimental role for saturated fat and benefits of polyunsaturated fat and a high-fiber diet on insulin sensitivity and low-grade inflammation have already been suggested.26–30 Both the fatty acid composition of membranes and the number and affinity of insulin receptors seem to be related to the fatty acid composition of diets.28 Similarly, an increase in exercise is related to widespread beneficial effects on metabolic syndrome, its components, and inflammatory markers.31,32
Indeed, a significant reduction in hs-CRP values was evident in the intervention group, even after adjusting for weight/waist modifications. These findings suggest that a healthier lifestyle might reduce the chronic subclinical inflammatory state associated with metabolic syndrome through other pathways, independent from the modest effect on anthropometric values. These results are concordant with the effect of a Mediterranean-style diet on markers of vascular inflammation.14
Overall, after a 1-year follow-up, the cumulative incidence of diabetes was 4.5% (n = 15). Even if the number of events was small, the lifestyle intervention significantly reduced progression to diabetes (1.8% vs 7.2%) with an NNT = 18.3.
The lifestyle intervention effects were similar for different ages, BMIs, and sex groups; however, a significant effect of education level was evident, in line with cross-sectional data demonstrating an inverse association between metabolic syndrome and education level.33 These data suggested that applicability/implementation of intervention programs should be carefully designed and targeted according to the individual education level.
It is important to point out the inefficacy of usual care by family physicians because most metabolic variables worsened and weight increased. Assessment of the lifestyle intervention trial control groups demonstrated a progressive increase in cardiovascular risk factor prevalence.16,34 The natural history for people at high risk for metabolic disturbances is weight gain and glucose tolerance deterioration.35 Our overweight and less educated subjects seem to be at a particularly high risk.
The efficacy of lifestyle interventions carried on by general practitioners is controversial.17,36 Brief personalized educational intervention by the family physician, based on a brochure about diet and health and a short explanation, induced multiple dietary changes and BMI reductions in healthy adults.17 However, the controls, who received simpler and nonpersonalized conversations without brochure use, did not show any BMI improvement.17 An individualized approach, with a specific dedicated effort to motivate patients, is probably mandatory to obtain any change in lifestyle habits in the general population.
Limitations and Strengths
The exclusion of the subjects, who refused to participate, did not seem to affect results because they were well-balanced between both groups. Moreover, the sensitivity analysis based on the intent-to-treat population confirmed the results based on participants only. Patients with metabolic syndrome were included together with subjects having only two components plus high hs-CRP values. The causal association between CRP and metabolic syndrome was criticized.37 However, the lack of a pathogenetic role does not mean that CRP is not strongly associated with the syndrome.37
Our study follow-up was limited to 1 year, and it has been demonstrated that the efficacy of lifestyle interventions reduces over time.5 Intermediate end points were examined and not all the “ameliorations” found in the intervention group would necessarily be stable and translate into clinically significant health improvements.
The possibility of a reporting bias cannot be excluded because patients might have overestimated exercise levels and underestimated dietary intake after follow-up. Nevertheless, this possibility seems unlikely because the reported changes showed consistent variations with laboratory variables, which were tested in blind.
To avoid contamination, trained professionals gave information to the intervention group only, subjects living and eating together were allocated in the same arm, data were collected by physicians blinded to group assignments, and all laboratory samples were run blindly.
The strengths of this study consisted of a large proportion of subjects enrolled from a defined community and the relative simplicity and efficiency of the intervention, which increases the possibility of replication and generalization of the findings.
CONCLUSIONS
A lifestyle intervention, carried out by trained professionals according to general guidelines, significantly improves dietary and exercise patterns in the short-term and provides substantial reductions in the prevalence of multiple metabolic and inflammatory abnormalities, even with modest weight loss. However, the usual care provided by family physicians is ineffective in contrasting the tendency of a high-risk group to worsen their metabolic condition. The transferability of the results of pragmatic intervention trials to other settings indeed remains questionable.
A longer follow-up period of this relatively simple intervention is needed to confirm adherence to behavioral changes and to verify its impact and cost-effectiveness on major clinical outcomes.
Acknowledgments
We are indebted to Federica Ghione, Sabrina Guidi, Pia Mangiameli, Elisabetta Pisu, Elena Repetti, Marina Rivetti, Elisa Tiozzo, and Ileana Baldi for their precious assistance.
This study was supported by a grant from Regione Piemonte
Conflicts of Interest None disclosed.
References
- 1.Pan XR, Li GW, Hu YH, et al. Effects of diet and exercise in preventing NIDDM in people with impaired glucose tolerance. The Da Qing IGT and Diabetes Study. Diabetes Care. 1997;20:537–44. [DOI] [PubMed]
- 2.Tuomilehto J, Lindström J, Eriksson JG, et al. Prevention of type 2 diabetes by changes in lifestyle among subjects with impaired glucose tolerance. N Engl J Med. 2001;344:1343–50. [DOI] [PubMed]
- 3.The Diabetes Prevention Program Research Group. Reduction in the incidence of type 2 diabetes with lifestyle intervention or metformin. N Engl J Med. 2002;346:393–403. [DOI] [PMC free article] [PubMed]
- 4.Herman WH, Herger TJ, Brandle M, et al. The cost-effectiveness of lifestyle modification on metformin in preventing type 2 diabetes in adults with impaired glucose tolerance. Ann Intern Med. 2005;142:323-32. [DOI] [PMC free article] [PubMed]
- 5.Eddy DM, Schlessinger L, Kahn R. Clinical outcomes and cost-effectiveness of strategies for managing people at high risk for diabetes. Ann Intern Med. 2005;143:251–64. [DOI] [PubMed]
- 6.Isooma B, Almgren P, Tuomi T, et al. Cardiovascular morbidity and mortality associated with the metabolic syndrome. Diabetes Care. 2001;24:683–9. [DOI] [PubMed]
- 7.Lorenzo C, Okoloise M, Williams K, et al. The metabolic syndrome as predictor of type 2 diabetes. Diabetes Care. 2003;26:3153–9. [DOI] [PubMed]
- 8.National Institute of Health. Executive summary of the third report of the National Cholesterol Education Program (NCEP) Expert Panel on Detection, Evaluation and Treatment of High Blood Cholesterol in Adults (Adult Treatment Panel III). JAMA. 2001;285:2486–97. [DOI] [PubMed]
- 9.Ford ES. Risk for all-cause mortality, cardiovascular disease, and diabetes associated with the metabolic syndrome. A summary of the evidence. Diabetes Care. 2005;28:1769–78. [DOI] [PubMed]
- 10.Kahn R, Buse J, Ferranini E, Stern M. The metabolic syndrome: time for a critical appraisal. Joint statement from the American Diabetes Association and the European Association for the Study of Diabetes. Diabetologia. 2005;48:1684–99. [DOI] [PubMed]
- 11.Ridker PM, Buring JE, Cook NR, Rifai N. C-reactive protein, the metabolic syndrome, and risk of incident cardiovascular events. Circulation. 2003;107:391–7. [DOI] [PubMed]
- 12.Orchard TJ, Temprosa M, Goldberg R, et al. The effect of metformin and intensive lifestyle intervention on the metabolic syndrome: the Diabetes Prevention Program Randomized Trial. Ann Intern Med. 2005;142:611–9. [DOI] [PMC free article] [PubMed]
- 13.Kukkonen-Harjula KT, Borg PT, Nenonen AM, Fogelholm MG. Effects of a weight maintenance program with or without exercise on the metabolic syndrome: a randomized trial in obese men. Prev Med. 2005;41:784–90. [DOI] [PubMed]
- 14.Esposito K, Marfella R, Ciotola M, et al. Effect of a Mediterranean-style diet on endothelial dysfunction and markers of vascular inflammation in the metabolic syndrome. JAMA. 2004;292:1440–6. [DOI] [PubMed]
- 15.Azadbakht L, Mirmiran P, Esmaillzader A, et al. Beneficial effects of a Dietary Approaches to Stop Hypertension eating plan on features of the metabolic syndrome. Diabetes Care. 2005;28:2823–31. [DOI] [PubMed]
- 16.Poppitt SD, Keogh GF, Prentice AM, et al. Long-term effects of ad libitum low-fat, high-carbohydrate diets on body weight and serum lipids in overweight subjects with metabolic syndrome. Am J Clin Nutr. 2002;75:11–20. [DOI] [PubMed]
- 17.Sacerdote C, Fiorini L, Rosato R, et al. Randomized controlled trial: effect of nutritional counseling in general practice. Int J Epidemiol. 2006;35:409–15. [DOI] [PubMed]
- 18.Bo S, Gentile L, Ciccone G, et al. The metabolic syndrome and high C-reactive protein: prevalence and difference by sex in a southern-European population-based cohort. Diabetes Metab Res Rev. 2005;21:515–24. [DOI] [PubMed]
- 19.The practical guide. Identification, evaluation, and treatment of overweight and obesity in adults. NIH Publication number 00-4084; October 2000
- 20.Bo S, Menato G, Lezo A, et al. Dietary fat and gestational hyperglycemia. Diabetologia. 2001;44:972-8. [DOI] [PubMed]
- 21.Taylor HL, Jacobs DR Jr, Schucker B, et al. Questionnaire for the assessment of leisure time physical activities. J Chronic Dis. 1978;31:741–55. [DOI] [PubMed]
- 22.The Expert Committee on the Diagnosis and Classification of Diabetes Mellitus. Report of the Expert Committee on the Diagnosis and Classification of Diabetes Mellitus. Diabetes Care. 2003;26:S5–20. [DOI] [PubMed]
- 23.Matthews DR, Hosker JP, Rudenski AS, et al. Homeostasis model assessment: insulin resistance and β-cell function from fasting plasma glucose and insulin concentrations in man. Diabetologia. 1985;28:412–9. [DOI] [PubMed]
- 24.Ross R, Dagnone D, Jones PJH, et al. Reduction in obesity and related comorbid conditions after diet-induced weight loss or exercise-induced weight loss in men. Ann Intern Med. 2000;133:92–103. [DOI] [PubMed]
- 25.Lindström J, Louheranta A, Mannelin M, et al. The Finnish Diabetes Prevention Study. Lifestyle intervention and 3-year results on diet and physical activity. Diabetes Care. 2003;26:3230–6. [DOI] [PubMed]
- 26.Marshall JA, Bessesen DH, Hamman RF. High saturated fat and low starch and fiber are associated with hyperinsulinaemia in a non-diabetic population: the San Luis Valley Diabetes Study. Diabetologia. 1997;40:430–8. [DOI] [PubMed]
- 27.McKeon NM, Meigs JB, Liu S, et al. Carbohydrate nutrition, insulin resistance, and the prevalence of the metabolic syndrome in the Framingham Offspring Cohort. Diabetes Care. 2004;27:538–46. [DOI] [PubMed]
- 28.Freire RD, Cardoso MA, Gimeno SGA, Ferreira SRG. Dietary fat is associated with metabolic syndrome in Japanese Brazilians. Diabetes Care. 2005;28:1779–85. [DOI] [PubMed]
- 29.Klein-Platat C, Drai J, Oujaa M, et al. Plasma fatty acid composition is associated with the metabolic syndrome and low-grade inflammation in overweight adolescents. Am J Clin Nutr. 2005;82:1178–84. [DOI] [PubMed]
- 30.Basu A, Devaraj S, Jialal I. Dietary factors that promote or retard inflammation. Arterioscler Thromb Vasc Biol. 2006;26:995–1001. [DOI] [PubMed]
- 31.Laaksonen DE, Lakka HM, Salonen JT, et al. Low levels of leisure-time physical activity and cardiorespiratory fitness predict development of the metabolic syndrome. Diabetes Care. 2002;25:1612–8. [DOI] [PubMed]
- 32.Aronson D, Sella R, Sheikh-Ahmad M, et al. The association between cardiorespiratory fitness and C-reactive protein in subjects with the metabolic syndrome. J Am Coll Cardiol. 2004;44:2003–7. [DOI] [PubMed]
- 33.Dallongeville J, Cottel D, Ferrières J, et al. Household income is associated with the risk of metabolic syndrome in a sex-specific manner. Diabetes Care. 2005;28:409–15. [DOI] [PubMed]
- 34.The Diabetes Prevention Program Research Group. Impact of intensive lifestyle and metformin therapy on cardiovascular disease risk factors in the Diabetes Prevention Program. Diabetes Care. 2005;28:888–94. [DOI] [PMC free article] [PubMed]
- 35.Hillier TA, Fagot-Campagna A, Eschwège E, et al. Weight change and changes in the metabolic syndrome as the French population moves towards overweight: the DESIR Cohort. Int J Epidemiol. 2006;35:190–6. [DOI] [PMC free article] [PubMed]
- 36.Thompson RL, Summerbell CD, Hooper L, et al. Relative efficacy of differential methods of dietary advice: a systematic review. Am J Clin Nutr. 2003;77:1052S–1057S. [DOI] [PubMed]
- 37.Timpson NJ, Lawlor DA, Harbord RM, et al. C-reactive protein and its role in metabolic syndrome: mendelian randomisation study. Lancet. 2005;366:1954–9. [DOI] [PubMed]