

Abstract
The signature domain of thrombospondins consists of tandem epidermal growth factor-like modules, 13 calcium-binding repeats, and a lectin-like module. Although very similar, the signature domains of thrombospondin-1 and -2 differ in several potentially important ways from the domains of thrombospondin-3, -4, and -5. We have compared matching recombinant segments representing the signature domains of thrombospondin-2 and -4. In the presence of 2 mm CaCl2, the far UV circular dichroism spectra of thrombospondin-2 and -4 constructs contain a strong negative band at 202 nm, but only the thrombospondin-2 construct has a band at 216 nm. Chelation of calcium shifted the negative bands to lower magnitudes. Titrations of the spectra demonstrated lower cooperativity and affinity for binding of calcium to thrombospondin-4 compared with thrombospondin-2. Atomic absorption spectroscopy demonstrated that the thrombospondin-4 constructs bind seven less calcium than the thrombospondin-2 construct at 0.6 mm CaCl2. In 2 mm CaCl2, the near UV circular dichroism spectra of thrombospondin -2, but not thrombospondin-4, contain a positive band at 292 nm that disappears upon calcium chelation. Intrinsic fluorescence spectra for both proteins were also sensitive to calcium, but the changes were simpler and more marked for thrombospondin-2 than for thrombospondin-4. In differential scanning calorimetry, the thrombospondin-2 construct melted in two distinct transitions at 53.5 and 81.8 °C, whereas the first transition for thrombospondin-4 constructs was observed at 63.5 °C. Thus, the studies revealed significant differences between the signature domains of thrombospondin-2 and thrombospondin-4 in calcium binding, fine structure, and inter-modular interactions.
The thrombospondin (TSP)2 (1) family of extracellular matrix glycoproteins consists of five members in vertebrates, TSP-1, -2, -3, -4, and -5 (1, 2). TSPs are modular multimeric proteins that can be divided into two groups, subgroup A comprising TSP-1 and TSP-2 and subgroup B comprising TSP-3, -4, and -5. TSP-1 and -2 in subgroup A are homotri-meric proteins composed of three identical 150-kDa monomers connected by disulfide bridges. Each monomer contains an N-terminal module (N), an oligomerization domain (O), a procollagen module (C), three properdin modules (P123), three epidermal growth factor (EGF)- like modules (E123), calcium-binding repeats, and a C-terminal globe (G) (Fig. 1). Subgroup B TSPs form pentamers, do not contain C or P modules, and have one extra E module (E2′) (Fig. 1). The “signature domain” of a TSP, therefore, is its C-terminal portion composed of the E, calcium-binding repeats, and G modules. The calcium-binding repeats and G modules have been highly conserved among all TSPs (1, 2). Calcium binding is associated with major conformational and functional changes associated with this region (reviewed in Ref. 3).
FIGURE 1. Schematic diagram of TSP constructs.

The N-terminal heparin-binding module (N), oligomerization domain (O), procollagen module (C), properdin modules (P), EGF-like modules (E), Ca2+-binding repeats (Ca), and C-terminal sequence (G) are indicated in the diagram. The TSP-4 monomer lacks the procollagen and properdin modules and contains a fourth EGF-like module. An arrow marks the location of Ala387 in TSP-4 that is changed to Pro387 in the polymorphism (14). The constructs described in the paper are named according to the modules present and from which TSP form the modules are derived.
The signature domain is cysteine-rich with six cysteines/EGF-like module, 17 cysteines in the calcium-binding repeats, and one (TSP-2) or two (TSP-1, -3, -4, and -5) cysteines in G. The cysteines of the EGF-like modules of TSP-2 form disulfides in a typical 1–3, 2–4, 5–6 pattern (4). The disulfide connectivity of the 18 absolutely conserved cysteines in CaG-2 of TSP-2 is sequential, thereby separating the structure into 13 calcium-binding motifs (5). Crystallographic analyses of the six most C-terminal calcium-binding repeats and G of TSP-1 and the entire signature domain of TSP-2 reveal a novel structure in which the polypeptide chain of the 13 calcium-binding repeats is organized around a core of 26 calcium ions forming a “wire” module (4, 6). In addition, E2 binds one calcium ion, and the lectin-like β-sandwich of the G module binds four (TSP-1) or three (TSP-2) calcium ions. The TSP-2 structure shows that the wire interacts at its two ends with the third EGF-like module and the lectin-like G module. This structure agrees with biophysical data of an E3CaG-2 construct from TSP-2 that indicate that the calcium-binding repeats are well structured by themselves but interact with E3 and G to form a complex structural unit (7).
TSP-4 is expressed by muscle interstitial cells and neurons, promotes neurite outgrowth, and accumulates at the neuromuscular junction (8). High levels of TSP-4 mRNA have been detected in heart and skeletal muscles (9), and human endothelial cells and vascular smooth muscle cells from brain blood vessels and coronary arteries have been shown to express TSP-4 mRNA (10). The signature domain of TSP-4 binds to collagens I, II, III, and V as well as laminin-1, fibronectin, and matrilin-2 (11). TSP-4 is overexpressed in muscular dystrophies (12) and can support myoblast adhesion (13). An A387P single nucleotide polymorphism of TSP-4 has been linked to susceptibility to premature myocardial infarction (14–16).
Comparison of the TSP-4 sequence to the TSP-2 sequence reveals several differences that are striking considering the overall high identity (Fig. 2). Compared with TSP-2, TSP-4 has an extra EGF-like module (E2′) that has a calcium-binding site and the unusual cysteine spacing pattern present in E2 of TSP-2 (4, 17). In addition, calcium-binding repeat 1C is three residues shorter in TSP-4 and lacks an N glycosylation site, calcium-binding repeat 11C in TSP-4 has a four-residue insertion, TSP-4 has an unpaired cysteine in G, and TSP-4 has an extra 18 residues added to its C terminus. To test the hypothesis that these differences result in structural differences between the signature domains of TSP-2 and -4, we have analyzed recombinant E123CaG-2 and E122′3CaG-4 using intrinsic fluorescence, circular dichroism (CD), atomic absorption spectroscopy, and differential scanning calorimetry (DSC). As part of these comparisons, we tested TSP-4 constructs that harbored either the Ala387 or Pro387 allele in the E2′ module.
FIGURE 2. Sequence alignment of hTSP-4 and hTSP-2.
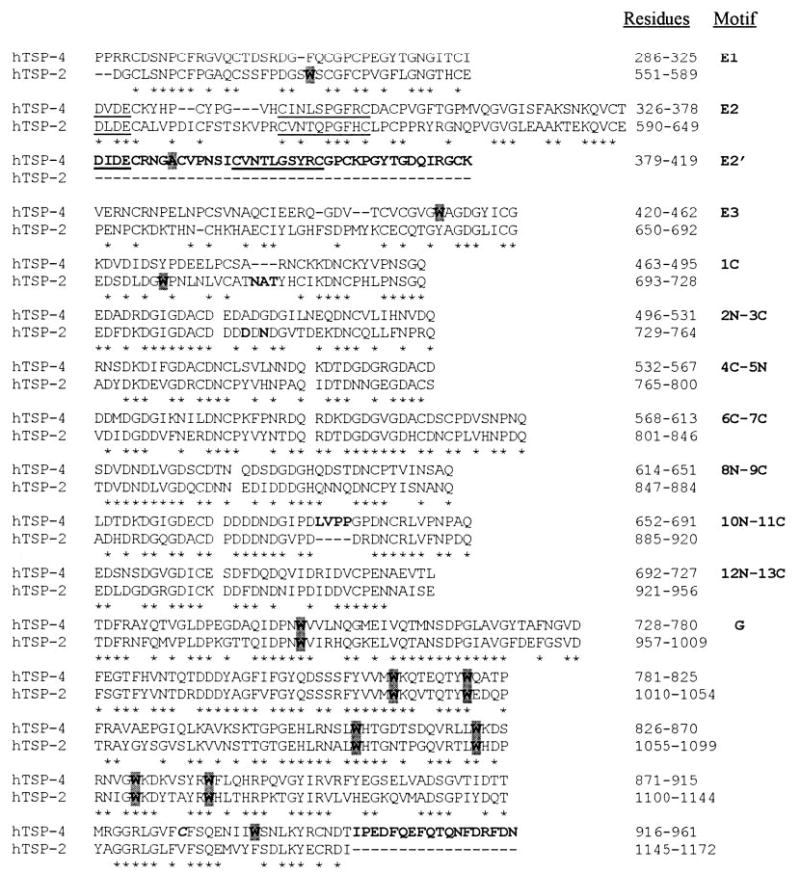
The amino acid sequences of the C-terminal regions of hTSP-4 and hTSP-2 are aligned and numbered starting with the initiating methionine. Identical residues are indicated with an * underneath the sequences. The modules are labeled according to TSP-2 nomenclature: EGF-like modules E1, E2, E2′, and E3; calcium-binding domain subdivided into its 13 repeats of either C-type or N-type calcium binding (4, 6); and the C-terminal globe, G. The areas where TSP-4 and TSP-2 differ are coded: the extra EGF in TSP-4 (E2′) is bold, Ala387 is highlighted gray, the site of N-glycosylation in the calcium-binding repeat 1C of TSP-2 that is deleted in TSP-4 is bold, Asp744 and Asn746 in calcium-binding repeat 3C of TSP-2 are bold, the four-residue insertion in the calcium-binding repeat 11C of TSP-4 is bold, the extra residues in the C-terminal tail of TSP-4 are bold, and the extra cysteine (Cys925) in the C-terminal globe of TSP-4 is bold and italicized. The calcium binding and β hydroxylation consensus sequences in the EGF-like modules are underlined (17). The tryptophan residues are highlighted gray.
MATERIALS AND METHODS
Cloning of E122′3CaG-4 Ala387 and E122′3CaG-4 Pro387
The pAcGP67.coco baculovirus transfer vector, which contains DNA encoding a signal peptide 5′ to and a six-histidine tag (His tag) 3′ to the cloning site, was used to facilitate baculovirus-mediated protein expression (18). E122′3CaG-4 Ala387 (residues 286–961) was PCR-amplified from a full-length clone of human TSP-4 (a generous donation of Drs. Jack Lawler, Harvard Medical School, Boston, MA; and Faye Hui Chen, Columbia University, New York, NY), and inserted into pAcGP67.coco. The TSP-4 clone has a Val at position 737 (as indicated in Swiss-Prot entry P35443) instead of the Gly737 originally published for human TSP-4 (19). Swiss-Prot describes rat, mouse, and Xenopus TSP-4 as having Val at the equivalent position. The Pro387 polymorphism was introduced by PCR mutagenesis into E122′3CaG-4. Correct orientation and sequence of PCR-amplified DNA were verified by automated sequencing.
Expression and Purification of Recombinant Proteins
The proteins were expressed by infecting High Five insect cells in SF900II serum-free medium at 22 °C with high titer virus (>108 plaque-forming units/ml) at a multiplicity of infection of 5. Conditioned medium was collected ~65 h post-infection. Histidine-tagged proteins were purified from the medium in the presence of 2 mm CaCl2 using Ni2+-nitrilotriacetic acid resin (Qiagen) as described previously (4, 7, 18). Protein concentration was determined using absorbance at 280 nm and calculated extinction coefficients of 1.07 and 1.24 ml mg−1 cm−1 for E122′3CaG-4 and E123CaG-2, respectively (20).
Calcium Binding
The ability of purified proteins to bind Ca2+ was measured directly using atomic absorption spectroscopy (7). Atomic absorption quantification of calcium content was done at the University of Wisconsin Chemistry Department using a Solaar Unicam 969 flame atomic absorption spectrometer. Prior to analysis, the proteins were dialyzed into 10 mm MOPS, 0.15 m NaCl, pH 7.5 containing 0.6 mm CaCl2. Protein solution and dialysis buffer were analyzed for calcium using calcium carbonate as the standard. Atomic absorption values are expressed as the mean ± S.E. of 3–4 experiments.
Circular Dichroism
CD studies were done at the University of Wisconsin Biophysics Instrumentation Facility using an Aviv 62A DS CD spectrometer. Far UV light measurements were taken at 37 °C in a 0.1-cm path length cuvette using protein (0.08–0.10 mg/ml) dialyzed into 5 mm MOPS, 100 mm NaCl, 2 mm CaCl2, pH 7.5. Calcium titrations were analyzed as described previously (7) by comparing the fractional change (R) in mean residue ellipticity at 210 nm at given calcium concentrations divided by the difference in values observed when no further changes occur upon the addition of EDTA. The Hill equation that describes this plot is log(R/1 − R) = nlog[Ca2+] + log K, where n is the Hill coefficient and K is an equilibrium dissociation constant (21). Near UV light measurements were taken at 25 °C in a 1 cm path length cuvette using protein (0.8–1.2 mg/ml) dialyzed into 10 mm MOPS, 150 mm NaCl, 2 mm CaCl2, pH 7.5.
Differential Scanning Calorimetry
DSC was done at the University of Wisconsin Biophysics Instrumentation Facility using a Microcal differential scanning calorimeter with proteins (0.8–1.5 mg/ml) dialyzed into 10 mm MOPS, 150 mm NaCl, 2 mm CaCl2, pH 7.5. Scans were from 15 to 95 °C at a rate of 60 °/h.
Intrinsic Fluorescence
Fluorescence emission spectra of purified proteins (0.04–0.05 mg/ml) in 5 mm MOPS, 100 mm NaCl, 2 mm CaCl2, pH 7.5 were obtained at 37 °C using a JY Fluoromax-3 fluorometer with excitation at 295 nm. Fluorescence spectra were obtained for each protein after each addition of EDTA. Calcium titrations were analyzed by calculating the relative fluorescence intensities at 332 nm at each calcium concentration (fluorescence intensity at a given calcium concentration divided by the fluorescence intensity at 2 mm CaCl2). Fluorescence was also monitored during thermal denaturation and upon denaturation with guanidine hydrochloride. Proteins were dialyzed into 5 mm MOPS, 100 mm NaCl, 2 mm CaCl2, pH 7.5 prior to denaturation.
RESULTS
For comparisons of the TSP-4 signature domain to the E123CaG-2 signature domain of TSP-2, for which there is a crystal structure (4), we expressed E122′3CaG-4 containing either Ala or Pro at position 387 in E2′(Fig. 1). When the sequences of TSP-2 and -4 are aligned, it is apparent that E2 of TSP-4 is most like E2 of TSP-2, and the extra EGF-like module (E2′), although most like E2, is the EGF-like module that is present in TSP-4 and missing in TSP-2 (Fig. 2). The proteins were cloned and expressed using a baculovirus expression system and purified using nickel chelate chromatography (7, 18). The yields of purified TSP-4 proteins were 10–40 mg/liter conditioned medium. This level of expression is comparable with the expression of the TSP-2 proteins (7) and much higher than the secretion of intact TSP-1 or -2 under the same conditions (data not shown). All truncated proteins were soluble and amenable to structural and functional analyses.
Far UV Circular Dichroism
In the presence of calcium, both E122′3CaG-4 constructs and E123CaG-2 have a negative band at 202 nm (Fig. 3). The E122′3CaG-4 spectra, however, lack a negative band at 216 nm that is apparent in E123CaG-2 (Fig. 3A), as well as full-length TSP-1 (21) and E3CaG-2 (7). Calcium chelation shifts the spectra of all three proteins to lower magnitudes (Fig. 3B), as was observed for TSP-1 (21) and E3CaG-2 (7). Calcium sensitivity of the proteins was monitored by measuring the change in ellipticity at 210 nm upon the addition of increasing amounts of EDTA (Fig. 4). The titration curves reveal that E122′3CaG-4 Ala387 and Pro387 gradually transition with EC50 values of 660 and 580 μm calcium and Hill coefficients of 3 and 2. E123CaG-2, in contrast, has an EC50 value of 410 μM calcium and a steep titration curve with a Hill coefficient of 7, indicating a more cooperative process than for the TSP-4 constructs.
FIGURE 3. Far UV CD spectra.
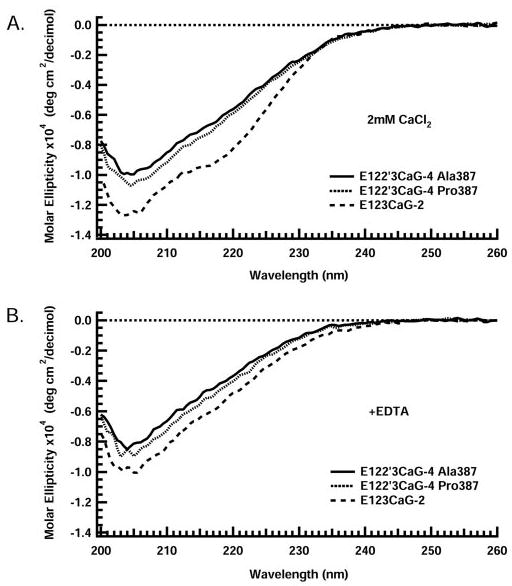
Far UV CD spectra for E123CaG-2 (dashed line), E122′3CaG-4 Ala387 (solid line), and E122′3CaG-4 Pro387 (dotted line) are shown in the presence of 2 mm CaCl2 (A) and upon removal of CaCl2 by the addition of 2 mM EDTA (B). Spectra were measured at 37 °C in 5 mm MOPS, 100 mm NaCl, 0 –2 mm CaCl2, pH 7.5. Representative spectra are shown.
FIGURE 4. Far UV CD titration curves.
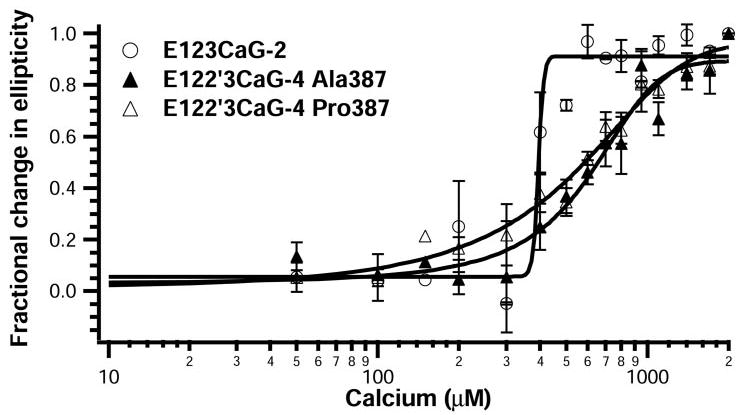
Far UV CD spectra for E123CaG-2 (open circles), E122′3CaG-4 Ala387 (closed triangles), and E122′3CaG-4 Pro387 (open triangles) were measured at 37 °C in 5 mm MOPS, 100 mm NaCl, 0 –2 mm CaCl2, pH 7.5. Protein, initially in 2 mm CaCl2, was treated with increasing amounts of EDTA to remove CaCl2. Results were analyzed by comparing the fractional change in molar ellipticity at 210 nm at a given calcium concentration divided by the difference in values observed when no further changes occur upon the addition of EDTA (7). Values are expressed as the mean ± S.E. of four experiments.
Calcium Binding
Calcium binding of the constructs in buffer containing 0.6 mm CaCl2 was measured using atomic absorption spectroscopy. Because the analysis requires subtraction of the calcium content in dialysis buffer from the calcium content of the protein solution, this was the highest calcium concentration at which there was enough enrichment in the protein solutions to obtain an accurate measurement. E123CaG-2 bound 28 ± 1 Ca2+/protein. This result is consistent with what we reported previously for E3CaG-2 (7) and in agreement with the 30 bound calcium ions found in the crystal structure of E123CaG-2 (4). The TSP-4 constructs bound seven less calcium ions than the TSP-2 construct, 21 ± 2 Ca2+/protein for E122′3CaG-4 Ala387 and 20 ± 1 Ca2+/protein for E122′3CaG-4 Pro387.
Differential Scanning Calorimetry
Thermal stability of the proteins was measured using DSC. In 2 mm CaCl2, E123CaG-2 melted with two transitions (53.5 and 81.8 °C) (Fig. 5), similar to the reported transitions for E3CaG-2 (50.5 and 82.7 °C) (7). Under identical conditions, we were only able to measure one transition for E122′3CaG-4 Ala387 and Pro387 at 63.3 and 63.5 °C, respectively (Fig. 5). We do not know whether a higher transition is present, because both E122′3CaG-4 constructs precipitated between 75 and 80 °C, and the experiments had to be discontinued.
FIGURE 5. Differential scanning calorimetry.

Thermal melting curves were measured for E123CaG-2 (dashed line), E122′3CaG-4 Ala387 (solid line), and E122′3CaG-4 Pro387 (dotted line) in 10 mm MOPS, 150 mm NaCl, 2 mm CaCl2, pH 7.5, using DSC at a rate of 60°/h. The TSP-4 proteins precipitated between 75– 80 °C as indicated by the breaks in the curves.
Near UV Circular Dichroism
The near UV CD spectra of E122′3CaG-4 Ala387 and Pro387 are similar to each other but different from E123CaG-2 (Fig. 6). In the presence of calcium, E123CaG-2 has a peak at 292 nm that can be attributed to the tryptophan residues, whereas the E122′3CaG-4 proteins do not have this peak. Upon chelation of calcium, the 292-nm peak disappears. This calcium-sensitive peak was previously observed in E3CaG-2 and CaG-2 but not E3Ca-2 and Ca-2, so it is believed to be due to one or several of the tryptophan residues in G (7). Both E123CaG-2 and E122′3CaG-4 contain nine tryptophans, seven of which are conserved and located in G (Fig. 2). A tryptophan is also present in the first calcium-binding repeat of E123CaG-2 but not of E122′3CaG-4.
FIGURE 6. Near UV CD.

Near UV CD spectra for E123CaG-2 (dashed line), E122′3CaG-4 Ala387 (solid line), and E122′3CaG-4 Pro387 (dotted line) are shown in the presence of 2 mm CaCl2 (A) and upon removal of CaCl2 by the addition of 2 mM EDTA (B). Spectra were measured at 25 °C in 10 mm MOPS, 150 mm NaCl, 0 –2 mm CaCl2, pH 7.5. Representative spectra are shown.
Fluorescence Spectroscopy
Intrinsic fluorescence of tryptophan residues is sensitive to perturbations in the local protein structure. The intrinsic fluorescence of the seven conserved tryptophans has been shown to be calcium-sensitive and to dominate the fluorescence spectra of E3CaG-2 (7). Because G has been found to bind three calcium ions in TSP-2 (4) and 4 calcium ions in TSP-1 (6) and to interact intimately with the calcium binding repeats of thrombospondin and E3, the tryptophan fluorescence could be influenced by removal of calcium from G or disruption of interactions of G with the calcium binding repeats of thrombospondin and the EGF-like repeats.
The local tryptophan environment was examined by measuring intrinsic fluorescence after excitation at 295 nm (Fig. 7). The fluorescence emission spectra for all three proteins are sensitive to the presence of calcium. In the presence of calcium, the wavelength of maximum fluorescence (λmax) is about 332 nm for the three proteins, but the shift in λmax upon removal of calcium is more for E123CaG-2 than for E122′3CaG-4 Ala387 or E122′3CaG-4 Pro387. The λmax for E123CaG-2 increased 4.5 nm from 332.5 nm at 2 mm Ca2+to 337 nm at 0 mm Ca2+, whereas the λmax for the E122′3CaG-4 proteins only increased 1.5 nm from 332 to 333.5 nm (TABLE ONE). Calcium sensitivity of the intrinsic fluorescence was examined in more detail by titration of calcium-replete E122′3CaG-4 Ala387, E122′3CaG-4 Pro387, and E123CaG-2 with increasing amounts of EDTA (Fig. 8). The fluorescence intensity of E122′3CaG-4 Ala or Pro387 initially decreased gradually as calcium was removed and then jumped back to the starting intensity with an EC50 value of 560 μm for the second transition. The fluorescence intensity of E123CaG-2, however, continually decreased as calcium was removed, with a resulting EC50 value of 980 μm calcium.
FIGURE 7. Intrinsic fluorescence.

Intrinsic fluorescence spectra for E123CaG-2 (A), E122′3CaG-4 Ala387 (B), and E122′3CaG-4 Pro387 (C) are shown in the presence of 2000 μm CaCl2 (solid line), 800 μm CaCl2 (dashed-dotted line), and 0 μm CaCl2 (dotted line). Spectra were measured at 37 °C in 5 mm MOPS, 100 mm NaCl, 0 –2 mm CaCl2, pH 7.5, with excitation at 295 nm. Protein, initially in 2 mm CaCl2, was treated with increasing amounts of EDTA to remove CaCl2. Representative spectra are shown expressed as fluorescence intensity.
TABLE ONE. Wavelength of maximum fluorescence.
Intrinsic fluorescence was monitored for E123CaG-2, E122′3CaG-4 Ala387, and E122′3CaG-4 Pro387 under various conditions as described under “Materials and Methods.” The wavelength of maximum fluorescence is presented for each condition.
| Protein | 2 mmCa2+37 °C | 0 mmCa2+37 °C | 2 mmCa2+70 °C | 5mGuHCl 2 mmCa2+37 °C |
|---|---|---|---|---|
| nm | nm | nm | nm | |
| E123CaG-2 | 332.5 | 337 | 339 | 348 |
| E122′3CaG-4 Ala387 | 332 | 333.5 | 339 | 348 |
| E122′3CaG-4 Pro387 | 331.5 | 333.5 | 338 | 348 |
FIGURE 8. Titration of intrinsic fluorescence.
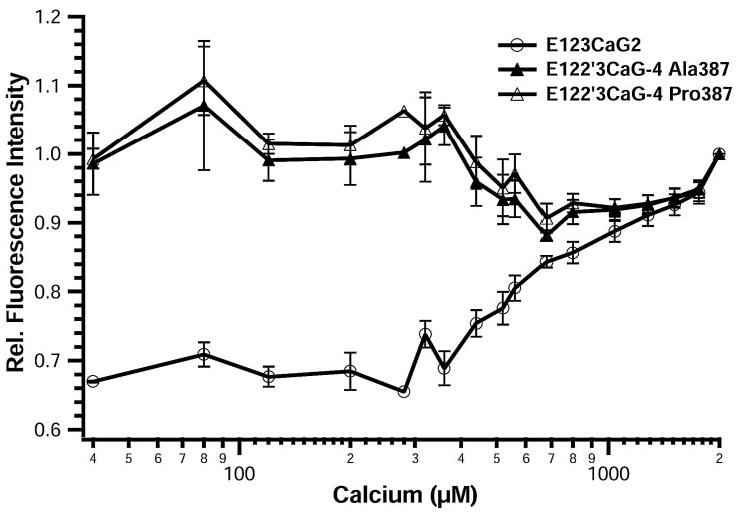
Intrinsic fluorescence spectra of E123CaG-2 (open circles), E122′3CaG-4 Ala387 (closed triangles), and E122′3CaG-4 Pro387 (open triangles) were measured at 37 °C in 5 mm MOPS, 100 mm NaCl, 0 –2 mm CaCl2, pH7.5, after excitation at 295 nm. Titration curves were made by the addition of increasing amounts of EDTA. Results at different calcium concentrations are compared by calculating the fluorescence intensity relative to that observed at 2 mm CaCl2 (7). Values are expressed as the mean ± S.E. of four experiments.
An increase in λmax indicates the local area around the tryptophan residues unfolds, resulting in an increased exposure of the tryptophan residues to water. Intrinsic fluorescence was also monitored during thermal denaturation and titration with guanidine hydrochloride. In all cases, the degree of unfolding observed, as measured by change in λmax, was less upon removal of calcium by EDTA than upon thermal denaturation or denaturation with 5 m guanidine hydrochloride (TABLE ONE). The λmax for all three proteins at 37 °C in 2 mm CaCl2 was ~332 nm and shifted to 338–339 nm upon heating to 70 °C or to 348 nm upon the addition of 5 m guanidine hydrochloride, suggesting that calcium depletion does not denature either protein, but rather, shifts the proteins to new folded states.
DISCUSSION
Comparison of the TSP-4 E122′3CaG-4 constructs to the analogous TSP-2 construct E123CaG-2 using CD, fluorescence, atomic absorption, and calorimetry reveal significant differences in structure and calcium-binding properties between the signature domains of the two TSPs. Because the signature domain of TSP-4 is most similar to that of TSP-3 and next most similar to TSP-5 (3), the analyses of TSP-4 structure are pertinent to understanding all three of the pentameric TSPs.
Atomic absorption spectroscopy showed that, in 0.6 mm CaCl2, E122′3CaG-4 binds seven less calcium ions than E123CaG-2. The 28 ± 1 calcium ions bound to E123CaG-2 using atomic absorption spectroscopy agrees with the crystal structure of E123CaG-2. The far UV CD titration data indicate that the structural change in E123CaG-2 upon calcium binding is complete by 0.5 mm CaCl2, but only 40–50% complete for E122′3CaG-4 (Fig. 4). Therefore, complete binding would not be expected for the TSP-4 constructs at 0.6 mm CaCl2, in which case E122′3CaG-4 may lack fewer than 7 calcium-binding sites when fully saturated. Asp744 and Asn746 of repeat 3C of TSP-2 are replaced with Ala and Gly, respectively, in TSP-4 (Fig. 2). The crystal structure of E123CaG-2 shows that the side chains of Asp744 and Asn746 help coordinate two calcium ions (4). Loss of at least two calcium-binding sites in TSP-4 is, therefore, predicted. These sites are also likely lacking in TSP-3 and -5. The presence of four extra residues in repeat 11C of E122′3CaG-4 may hinder the repeat from adopting its distinctive calcium-binding fold and further compromise calcium binding to TSP-4 (4). Because TSP-3 also contains this insertion (3), its folding would be predicted to be similarly affected. Numerous studies indicate that alterations in one calcium-binding repeat change the kinetics of binding to adjacent repeats. The N700S polymorphism in calcium-binding repeat 1C of TSP-1, which results in the loss of a single calcium-binding site, is associated with lower affinity binding and decreased rate of binding to the next three calcium-binding repeats (22). In TSP-5, single missense mutations in the calcium-binding repeats associated with pseudoachondroplasia or multiple epiphyseal dysplasia have been found to result in a reduction in the amount of calcium bound, the affinity of binding, and the cooperativity of binding (23–25). It seems reasonable to hypothesize, therefore, that the loss of two binding sites in repeat 3C and the possible altered conformation of repeat 11C lead to the observed decreases in affinity and cooperativity of TSP-4.
Intrinsic fluorescence, near UV CD, and far UV CD data suggest that the structure of G differs in TSP-2 and TSP-4. The far UV CD spectra of both E122′3CaG-4 and E123CaG-2 have a negative band at 202 nm, but only E123CaG-2 has a negative band at 216 nm (Fig. 3). This negative band at 216 nm in TSP-2 can be attributed to G inasmuch as it is present in C-terminal TSP-2 constructs containing G but absent in constructs lacking G (7). The near UV CD spectra of TSP-4 are lacking a positive band at 292 nm (Fig. 6), which has been shown to be attributable to the tryptophan residues in G of TSP-2 (7). CD bands in the near UV spectra are observed when aromatic residues are immobilized in an asymmetric environment (26). The lack of a peak at 292 nm indicates that the tryp-tophan residues are either not immobilized in an asymmetric environment or are immobilized in different orientations, and the resulting CD bands cancel each other out. Such differences in tryptophan, in addition to differences in secondary structure, may contribute to changes in far UV CD spectra as well (26). Differences in intrinsic tryptophan fluorescence of the TSP-4 and -2 proteins (Figs. 7 and 8) are also primarily due to changes in the environment of the conserved tryptophans of G (7). Although the calcium-replete fluorescence spectra are similar, with a λmax value of ~332 nm (Fig. 7), removal of calcium red shifts the λmax value of 4.5 nm for E123CaG-2 and only 1.5 nm for E122′3CaG-4 (TABLE ONE), and calcium titration curves monitored using fluorescence have two transitions for TSP-4 and only one for TSP-2 (Fig. 8).
DSC revealed differences in the thermal stability of the TSP-4 and -2 proteins. E123CaG-2 melts with transitions at 53.5° and 81.8 °C (Fig. 5). Previously, we found that E3CaG-2 melts with transitions at 50.5° and 82.7 °C (7). The first transition was assigned to unfolding of the inter-modular interface among E3, the calcium-binding repeats, and G, whereas the second transition was assigned to the unfolding of the calcium-binding repeats (7). The increase in the first transition, when E12 is added to E3CaG-2, is compatible with the observed interaction between the C-terminal part of the calcium-binding repeats and E2 in the crystal structure of E123CaG-2 (4). Only one transition at 63.5 °C was observed for the TSP-4 proteins before they precipitated (Fig. 5). Because the proteins precipitated between 75° and 80 °C, it is unknown whether another transition would have occurred if the experiment could have been completed. In other words, the 63.5° transition may be the only transition, thereby corresponding to both the unfolding of the calcium-binding repeats and the unfolding of the intermodular interface, or it may be the first transition corresponding to the unfolding of the interface only. Either way, a difference in stability is apparent between the E122′3CaG-4 constructs and the homologous E123CaG-2 construct. Without a crystal structure for TSP-4, however, the exact nature of the difference is unknown.
Because of the putative role of the A387P TSP-4 polymorphism in premature myocardial infarction (14–16), we expressed the C-terminal region of hTSP-4 as both the common (Ala387) and polymorphic (Pro387) forms. High levels of TSP-4 mRNA have been detected in heart and skeletal muscles (9), and human endothelial cells and vascular smooth muscle cells from brain blood vessels and coronary arteries have been shown to express TSP-4 mRNA (10). A recombinant E122′3Ca piece of TSP-4 with the Pro387 allele suppresses endothelial cell adhesion and proliferation, suggesting that it is a “gain of function” polymorphism that is proatherogenic (10). Recently, an E122′3 Pro387 construct has been reported to have an additional Tb3+-binding site (27). However, our analyses failed to reveal significant structural differences in E122′3CaG-4 due to the polymorphism. Atomic absorption spectroscopy indicated that both TSP-4 proteins bind the same number of calcium ions. Far UV CD, near UV CD, and intrinsic fluorescence spectra for E122′3CaG-4 Ala387 and Pro387 are virtually identical (Figs. 3, 4, 6, and 7), and DSC showed similar thermal stabilities (Fig. 5). Therefore, the A387P single nucleotide polymorphism does not appear to affect the overall protein structure of E122′3CaG-4 nor does it alter its calcium-binding properties. The polymorphic TSP-4 contains a Pro instead of an Ala at position 387 in the third EGF-like module (E2′) of TSP-4 (Fig. 2). Comparative NMR analysis of a proline to alanine (P1148A) missense mutation in calcium binding EGF13 of fibrillin-1 has revealed that the fibrillin mutation also does not result in a structural defect in EGF13 or the adjacent EGFs (28). Similar to Pro1148 of fibrillin-1, Pro387 of TSP-4 is in a calcium-binding EGF and is expected to be in a turn (not a β-sheet) (4). The striking differences in the effects of the constructs based on common and polymorphic TSP-4 on the phenotype of endothelial cells (10) is, therefore, likely due to an altered interaction with some cellular component caused by a local structural change in the third EGF rather than by an overall structural change.
Together, the calcium binding, spectroscopic, and calorimetric data reveal significant structural differences in the C-terminal regions of TSP-2 and -4, especially in the lectin-like G domain. Further analysis of TSP-4 is necessary to determine which structural differences account for the altered calcium-binding properties. It may not be any single difference but rather a combination of differences that leads to fewer calcium-binding sites in TSP-4, a decrease in cooperativity of binding, and differences in fluorescence and CD spectra.
Acknowledgments
We acknowledge the University of Wisconsin-Madison Biophysics Instrumentation Facility, which is supported by the University of Wisconsin-Madison and Grants BIR-9512577 (National Science Foundation) and S10 RR13790 (NIH).
Footnotes
* This work was supported by National Institutes of Health Grant HL54462.
The abbreviations used are: TSP, thrombospondin; CD, circular dichroism; E, epidermal growth factor-like module of thrombospondin; EGF, epidermal growth factor; E122′3CaG-4, residues 286 –961 of human thrombospondin-4; E123CaG-2, residues 551–1172 of human thrombospondin-2; G, C-terminal globe of thrombospondin; λmax, wavelength of maximum fluorescence; DSC, differential scanning calorimetry; MOPS, 4-morpholinepropanesulfonic acid.
References
- 1.Adams, J. C., Tucker R. P., Lawler, J. (1995) The Thrombospondin Gene Family, Molecular Biology Intelligence Unit, R. G. Landes Company, Austin, TX
- 2.Adams JC, Monk R, Taylor AL, Ozbek S, Fascetti N, Baumgartner S, Engel J. J Mol Biol. 2003;328:479–494. doi: 10.1016/s0022-2836(03)00248-1. [DOI] [PubMed] [Google Scholar]
- 3.Adams JC. Int J Biochem Cell Biol. 2004;36:1102–1114. doi: 10.1016/j.biocel.2004.01.022. [DOI] [PubMed] [Google Scholar]
- 4.Carlson CB, Bernstein DA, Annis DS, Misenheimer TM, Hannah BL, Mosher DF, Keck JL. Nat Struct Mol Biol. 2005;12:910–914. doi: 10.1038/nsmb997. [DOI] [PMC free article] [PubMed] [Google Scholar]
- 5.Misenheimer TM, Hahr AJ, Harms AC, Annis DS, Mosher DF. J Biol Chem. 2001;276:45882–45887. doi: 10.1074/jbc.M104218200. [DOI] [PubMed] [Google Scholar]
- 6.Kvansakul M, Adams JC, Hohenester E. EMBO J. 2004;23:1223–1233. doi: 10.1038/sj.emboj.7600166. [DOI] [PMC free article] [PubMed] [Google Scholar]
- 7.Misenheimer TM, Hannah BL, Annis DS, Mosher DF. Biochemistry. 2003;42:5125–5132. doi: 10.1021/bi026983p. [DOI] [PubMed] [Google Scholar]
- 8.Arber S, Caroni P. J Cell Biol. 1995;131:1083–1094. doi: 10.1083/jcb.131.4.1083. [DOI] [PMC free article] [PubMed] [Google Scholar]
- 9.Lawler J, Duquette M, Whittaker CA, Adams JC, McHenry K, DeSimone DW. J Cell Biol. 1993;120:1059–1067. doi: 10.1083/jcb.120.4.1059. [DOI] [PMC free article] [PubMed] [Google Scholar]
- 10.Stenina OI, Desai SY, Krukovets I, Kight K, Janigro D, Topol EJ, Plow EF. Circulation. 2003;108:1514–1519. doi: 10.1161/01.CIR.0000089085.76320.4E. [DOI] [PubMed] [Google Scholar]
- 11.Narouz-Ott L, Maurer P, Nitsche DP, Smyth N, Paulsson M. J Biol Chem. 2000;275:37110–37117. doi: 10.1074/jbc.M007223200. [DOI] [PubMed] [Google Scholar]
- 12.Chen YW, Zhao P, Borup R, Hoffman EP. J Cell Biol. 2000;151:1321–1336. doi: 10.1083/jcb.151.6.1321. [DOI] [PMC free article] [PubMed] [Google Scholar]
- 13.Adams JC, Lawler J. Mol Biol Cell. 1994;5:423–437. doi: 10.1091/mbc.5.4.423. [DOI] [PMC free article] [PubMed] [Google Scholar]
- 14.Topol EJ, McCarthy J, Gabriel S, Moliterno DJ, Rogers WJ, Newby LK, Freedman M, Metivier J, Cannata R, O’Donnell CJ, Kottke-Marchant K, Mu-rugesan G, Plow EF, Stenina O, Daley GQ. Circulation. 2001;104:2641–2644. doi: 10.1161/hc4701.100910. [DOI] [PubMed] [Google Scholar]
- 15.Wessel J, Topol EJ, Ji M, Meyer J, McCarthy JJ. Am Heart J. 2004;147:905–909. doi: 10.1016/j.ahj.2003.12.013. [DOI] [PubMed] [Google Scholar]
- 16.Cui J, Randell E, Renouf J, Sun G, Han FY, Younghusband B, Xie YG. Arterioscler Thromb Vasc Biol. 2004;24:e183–e184. doi: 10.1161/01.ATV.0000147304.67100.ee. [DOI] [PubMed] [Google Scholar]
- 17.Selander-Sunnerhagen M, Ullner M, Persson E, Teleman O, Stenflo J, Drakenberg T. J Biol Chem. 1992;267:19642–19649. doi: 10.2210/pdb1ccf/pdb. [DOI] [PubMed] [Google Scholar]
- 18.Mosher DF, Huwiler KG, Misenheimer TM, Annis DS. Methods Cell Biol. 2002;69:69–81. doi: 10.1016/s0091-679x(02)69008-9. [DOI] [PubMed] [Google Scholar]
- 19.Lawler J, McHenry K, Duquette M, Derick L. J Biol Chem. 1995;270:2809–2814. doi: 10.1074/jbc.270.6.2809. [DOI] [PubMed] [Google Scholar]
- 20.Mach H, Middaugh CR, Lewis RV. Anal Biochem. 1992;200:74–80. doi: 10.1016/0003-2697(92)90279-g. [DOI] [PubMed] [Google Scholar]
- 21.Lawler J, Simons ER. J Biol Chem. 1983;258:12098–12101. [PubMed] [Google Scholar]
- 22.Hannah BL, Misenheimer TM, Pranghofer MM, Mosher DF. J Biol Chem. 2004;279:51915–51922. doi: 10.1074/jbc.M409632200. [DOI] [PubMed] [Google Scholar]
- 23.Chen H, Deere M, Hecht JT, Lawler J. J Biol Chem. 2000;275:26538–26544. doi: 10.1074/jbc.M909780199. [DOI] [PubMed] [Google Scholar]
- 24.Maddox BK, Mokashi A, Keene DR, Bachinger HP. J Biol Chem. 2000;275:11412–11417. doi: 10.1074/jbc.275.15.11412. [DOI] [PubMed] [Google Scholar]
- 25.Thur J, Rosenberg K, Nitsche DP, Pihlajamaa T, Ala-Kokko L, Heinegard D, Paulsson M, Maurer P. J Biol Chem. 2001;276:6083–6092. doi: 10.1074/jbc.M009512200. [DOI] [PubMed] [Google Scholar]
- 26.Creighton, T. E. (ed) (1997) Protein Structure, A Practical Approach, 2nd Ed., pp. 287–296, Oxford University Press, Oxford
- 27.Stenina OI, Ustinov V, Krukovets I, Marinic T, Topol EJ, Plow EF. FASEB J. 2005;19:1893–1895. doi: 10.1096/fj.05-3712fje. [DOI] [PubMed] [Google Scholar]
- 28.Whiteman P, Downing AK, Handford PA. Protein Eng. 1998;11:957–959. doi: 10.1093/protein/11.11.957. [DOI] [PubMed] [Google Scholar]