

Abstract
In aqueous solution some proteins undergo large-scale movements of secondary structures, subunits or domains - referred to as protein ‘breathing’ - that define a native-state ensemble of structures. These fluctuations are sensitive to the nature and concentration of solutes and other proteins and are thereby expected to be different in the crowded interior of a cell than in dilute solution. Here we use a combination of wide angle x-ray scattering (WAXS) and computational modeling to derive a quantitative measure of the spatial scale of conformational fluctuations in a protein solution. Concentration-dependent changes in the observed scattering intensities are consistent with a model of structural fluctuations in which secondary structures undergo rigid-body motions relative to one another. This motion increases with decreasing protein concentration or increasing temperature. Analysis of a set of five structurally and functionally diverse proteins reveals a diversity of kinetic behaviors. Proteins with multiple disulfide bonds exhibit little or no increase in breathing in dilute solutions. The spatial extent of structural fluctuations appears highly dependent on both protein structure and concentration and is universally suppressed at very high protein concentrations.
Keywords: x-ray scattering, protein conformation, crowding, rigid body motion, protein stability
Introduction
The function of most, if not all, proteins require some movement of structural elements relative to one another. This may involve individual side chains, loops, folds or entire domains. Often the movement corresponds to a transition between two or more functional states such as a conformational change that occurs in response to binding of a ligand. A functional state is not strictly a single, rigid conformation, but rather an ensemble of structures that are accessible to one another through relatively low energy conformational transitions. The magnitude of the structural fluctuations within the ensemble that corresponds to the canonical ‘native state’ of a protein is of critical importance for proper protein function1; 2; 3. The scale of these fluctuations has been studied by a wide variety of biophysical tools including NMR4 ; H/D exchange5; x-ray crystallography6; 7; 8; inelastic neutron scattering9; and Raman spectroscopy10; as well as computational approaches such as molecular dynamics simulations and normal mode analysis11; 12. Fluctuations within the native ensemble of a protein involve motions that range from atomic vibrations to slow, large-scale movements of subunits or domains that are sometimes referred to as protein ‘breathing’13.
Because of the wide range of time scales under which these motions occur, the corresponding differences in length scales, and the diversity of experimental approaches that have been applied to their study, a uniform view of the nature of these fluctuations and their impact on function has not yet developed. In part this is due to the fact that different experimental methods may require rather different concentrations, temperature, buffer or other environmental conditions. The form and scale of motion may be highly sensitive to differences in these conditions. Motion may even be affected by crystal contacts in different crystal forms of the same protein8; 14; 15. Furthermore, since most experimental approaches are applied to proteins in either a relatively dilute environment or a highly ordered crystal, their relevance to in vivo protein function is uncertain. The crowded interior of a cell gives rise to a multitude of protein-protein interactions that may alter the nature and magnitude of structural fluctuations exhibited by proteins and potentially leads to functional properties very different from those in dilute solutions16. The effect of this ‘macromolecular crowding’ is to stabilize proteins17; 18; 19; 20 and increase their rates of folding and refolding21; 22; 23. Proteins can be ‘crowded’ by other macromolecules or by smaller metabolites or osmolytes. Osmolytes frequently shift the native state ensemble towards species with more ordered, compact conformations24, strongly suggesting that crowding, whether due to osmolytes or macromolecules, will suppress conformational fluctuations.
Although in theory, wide-angle x-ray scattering from proteins in solution (WAXS) contains structural information about proteins in solution the relative weakness of the scattering signal has restricted its use. The availability of high flux, well-collimated x-ray beams at third generation synchrotron sources has made possible the collection of high quality WAXS data from proteins in solution out to 2 Å spacing and has been shown to provide information about the conformational changes induced by either ligands25 or changes in oxidation state26; secondary structure content27; and radiation damage28.
X-ray solution scattering provides information about the ensemble average of the scattering from all proteins in solution. As the nature of the ensemble changes, corresponding changes in scattering are detectable29; 30. The Debye formula for intensity of scattering from randomly oriented objects such as protein molecules in solution expresses the intensity in terms of the distribution of interatomic vector lengths in the object31. The intensity scattered from a random ensemble of proteins is the sum of that from the individual proteins. As the polymorphism of an ensemble increases, sharp features in the scattering pattern will blur or become less distinct. A simple example is the scattering pattern from a uniform population of non-interacting spheres of radius A, and another from a uniform population of slightly different radius B. Each will have sharp, well defined maxima and minima but at somewhat different scattering angles. Mix equal amounts of the two populations together and, in the absence of intermolecular interference effects, to a very close approximation the scattering pattern from the mixture will be the sum of the patterns from the individual homogeneous populations. The peaks and troughs will lose sharpness because they represent the sum of two patterns in which the peaks and troughs are at slightly different positions.
Here we use a combination of wide angle x-ray scattering and computational modeling to demonstrate that the loss of sharpness relative to a reference diffraction pattern can be used to derive a quantitative measure of the degree of structural polymorphism in a protein solution. This approach, when applied to multiple proteins representing a range of tertiary and quaternary structures, demonstrates that structural fluctuations are highly dependent on both protein structure and protein concentration and are suppressed at very high protein concentrations.
Results
WAXS as a function of protein concentration
To probe the effect of protein concentration on the native ensemble, WAXS data from a broad concentration range for five representative proteins was collected and processed as previously described25; 28. WAXS data was collected from solutions of bovine hemoglobin; hen egg white lysozyme; hen egg white avidin; bovine serum albumin and equine myoglobin over a broad concentration range (0.5 to 300 mg/ml) at 5°C with additional hemoglobin data sets collected at 25°C, 37°C and 45°C. All of the protein solutions were in phosphate-buffered saline except for lysozyme which was suspended in acetate buffer, pH 4.5 to maximize solubility. WAXS patterns were collected and azimuthally integrated to generate one-dimensional scattered intensity plots (see Methods;27). Figure 1 shows the radial trace of a WAXS pattern collected from a solution of hemoglobin at 150 mg/ml, along with corresponding traces of scattering from buffer filled capillary and empty capillary. Subtraction of scattering from capillary and excluded volume-weighted scattering from buffer is used to calculate scattering from the protein (top trace in Figure 1). Figure 2 shows radial traces of WAXS patterns from (a) hemoglobin prepared at concentrations of 1 to 300 mg/ml and (b) lysozyme prepared at concentrations of 1 to 300 mg/ml. The observed intensities are very similar over the entire concentration range, with signal-to-noise ratio dropping as anticipated for data collected from very low concentration solutions (i.e. below 10 mg/ml). Protein concentration was estimated using three techniques: biochemically; scaling of diffraction patterns normalized to incident photon counts; and from excluded volume estimates based on wide-angle scattering data. Data were scaled to minimize the difference between each pattern and a reference pattern, optimizing the fit by variation of the scale factor and excluded volume. Estimates of concentration based on scale factor and excluded volume compared very well with expectations up to the limit of solubility of 250 mg/ml for hemoglobin and 150 mg/ml for lysozyme. Above these concentrations, both scaling and estimation of excluded volume indicated a plateau in concentration reflecting the fact that the solubility limit had been reached (data not shown).
Figure 1.

Measured scattering intensities as a function of spacing (1/d = 2 sin (θ)/λ). For each specimen, data was collected for empty capillary (dotted curve); buffer-filled capillary (long dashed curve); and protein solution-filled capillary (bottom black solid curve). From these three measurements, the scattering from buffer alone (short dashed curve) was estimated as was the scattering from protein (upper solid curve (multiplied ×10)).
Figure 2.

WAXS as a function of 1/d. (a) WAXS from bovine met hemoglobin. The figure is a superposition of 21 traces from solutions prepared at concentrations of 1; 2; 8.2; 10.2; 12.8; 16; 20; 25; 30; 35; 40; 47; 55; 64; 87; 102; 119; 162; 189; 257; and 300 mg/ml. (b) WAXS from hen egg white lysozyme. The figure is a superposition of 24 traces from scattering from solutions prepared at concentrations of 1; 2; 4.1; 8.2; 10.2; 12.8; 16; 20; 25; 30; 35; 47; 55; 64; 75; 87; 102; 119; 139; 162; 189; 220; 257; and 300 mg/ml. Data from solutions of 55-300 mg/ml were nearly indistinguishable. Data from 1 and 2 mg/ml solutions are readily identified due to their increased statistical fluctuations. Scaling of patterns indicated that under the conditions used, hemoglobin had a solubility of approximately 250 mg/ml and lysozyme a solubility of approximately 150 mg/ml. Scattering from solutions prepared at concentrations greater than this were virtually identical as judged by scaling, estimated excluded volume and intensity distribution.
Although WAXS patterns from hemoglobin prepared at concentrations of 1 to 300 mg/ml appear very similar over the entire concentration range, examination of the x-ray scattering patterns reveals that in those collected at concentrations below 50 mg/ml the intensity at positions of peaks and troughs is highly dependent on concentration (Figure 2a). This is more readily apparent in the comparison of scattering from hemoglobin at 4 mg/ml and 47 mg/ml shown in Figure 3a. Scattering from lysozyme does not exhibit this behavior, with very little change in the intensities at peaks or troughs apparent when intensity distributions are compared (Figures 2b and 3b). Peak and trough intensities from hemoglobin and lysozyme patterns plotted as a function of concentration (Figures 4 and 5) demonstrate that scattered intensity is relatively constant as a function of concentration above 50 mg/ml but may change by 10% or more at lower concentrations. The progressively lower signal-to-noise ratio of data from low concentration solutions does not account for the observed changes in intensities observed in this concentration range for hemoglobin as seen by the magnitude of the error bars relative to the intensity changes (Figures 3a; 4). The small changes in intensity observed at concentrations above 50 mg/ml are linear as a function of concentration and confined to relatively small angles of scattering, indicating that they are due largely to decrease in contrast at progressively higher protein concentrations. The large intensity changes observed at low concentrations (less than 50 mg/ml) of hemoglobin appear to reflect an increase in the structural polymorphism of the native ensemble of the molecule in dilute solution. Small changes in scattering from lysozyme at concentrations less than 20 mg/ml (Figure 5) are suggestive, but not convincingly larger than the expected errors in the weak scattering from these dilute solutions.
Figure 3.
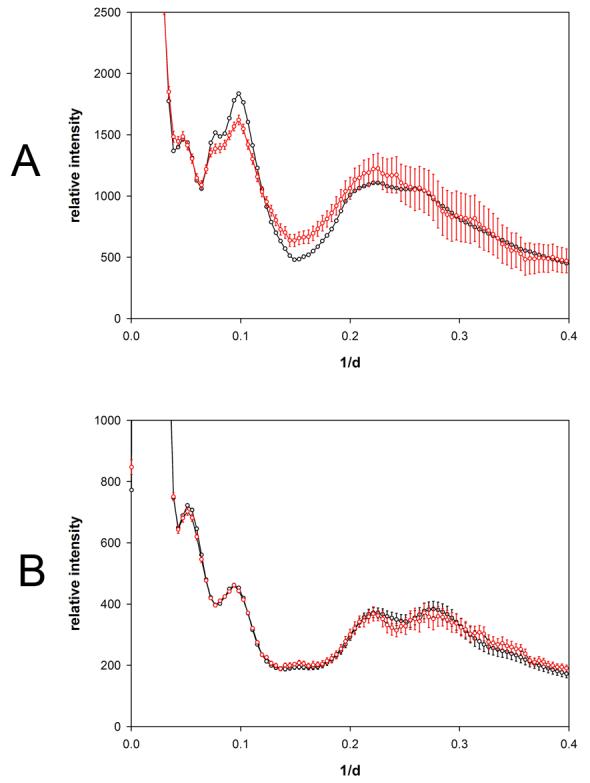
Comparison of solution scattering from hemoglobin and lysozyme. Solution x-ray scattering from (a) hemoglobin and (b) lysozyme as observed from specimens at 47 mg/ml (black curves) and 4.1 mg/ml (red curves). Error bars represent +/− the standard deviation of 7 independent measurements of solution scattering using 4 buffer and 4 empty capillary patterns (see Materials and Methods). The red error bars in (a) appear significantly larger than the random fluctuation in measurements due to the fact that the error calculation included estimates of the error in the scale factor which could introduce systematic errors into the intensity calculation.
Figure 4.

Scattering intensity from hemoglobin as a function of concentration. The observed scattering intensities at selected 1/d values have been plotted as a function of concentration. Error bars represent ± standard deviation of 5-11 individual observations. The solid lines represent fitting of the data to a function of the form I + A exp(−aC/c1/2) + BC as described in the text. Approximate magnitude of the fluctuations giving rise to the effect were estimated as described for hemoglobin and then extrapolated to zero concentration in order to aid comparison among different proteins. Scattering from hemoglobin at the 1/d values indicated normalized for I0. Each of the 1/d values chosen for these representative plots corresponds to a peak or trough in the scattering curves in Figure 2a ((a) 1/d = 0.0253; (b) 1/d = 0.0400 Å−1; (b) 1/d = 0.0636 Å−1; (b) 1/d = 0.0981 Å−1)). Note the vertical scale in (a) is compressed in order to visualize the magnitude of the effect.
Figure 5.

Scattering intensity as a function of concentration of lysozyme. The observed scattering intensities at selected 1/d values have been plotted as a function of concentration. (a-d) scattering from lysozyme at the 1/d values indicated. Each of the 1/d values chosen for these representative plots corresponds to a peak or trough in the scattering curves in Figure 2b ((a) 1/d = 0.0428; (b) 1/d = 0.0523; (c) 1/d = 0.0783; (d) 1/d = 0.0943 Å−1)). Error bars and fit curves were calculated as described in Figure 4.
Hemoglobin Structural Fluctuations Resemble Rigid Body Motions
The observed changes in intensity at low concentrations were used to discriminate between alternative models of the polymorphism by computing the effect of different forms of disorder on the scattering pattern from a reference (high concentration) structure. The reference structure was chosen to be hemoglobin at ∼47 mg/ml because virtually all the change in intensity at higher concentrations was due to change in contrast and at lower concentrations was due to increase in disorder. Since the reference structure corresponds to a molecule that is itself undergoing an unknown degree of structural fluctuation this construction provides a measure of the difference in fluctuations between reference and model as opposed to an absolute measure of fluctuation in the model.
Modeling of disorder was carried out in real space through transformations of the pair correlation function, p(r), the distribution of all interatomic vector lengths in the specimen. The pair correlation function was derived from the measured intensities through the autocorrelation function, a(r), which was calculated from the measured intensities by32:
| (1) |
where I(s) is the distribution of scattered intensities, s = 2 sin(θ)/λ, 2θ is the scattering angle andλ is the wavelength of incident x-rays The autocorrelation function is the spherically averaged Patterson function (the map of all interatomic vectors in the scattering particles). The pair correlation function (also called pair distribution function) is derived from the autocorrelation function by multiplying a(r) by 4πr2 to generate the distribution of interatomic vector lengths.
Predicted patterns for the model ensembles were computed by replacing each interatomic vector in the pair correlation function of the reference structure by a set of vectors with a Gaussian distribution of lengths. Models were constructed using both a wide range of Gaussian distribution widths, and by varying the way in which those widths varied with the length of the interatomic vector. The calculations were carried out by (i) extrapolation of the observed reference-structure diffraction pattern to zero scattering angle using the Guinier approximation; (ii) calculation of the autocorrelation function of the protein by a spherical Fourier transform of the reference intensities (equation (1)); (iii) multiplication of the autocorrelation function by 4πr2 to generate the pair correlation function; (iv) convolution of that pair correlation function by a Gaussian [or set of Gaussians] that replaces all interatomic vectors of a given length by a distribution of vector lengths representing the range of motion for that interatomic vector length; (v) generation of the new autocorrelation function by dividing by 4πr2; and (vi) carrying out the reverse Fourier transform to obtain a diffraction pattern predicted for the model ensemble. This process is similar to one used to model disorder in crystalline proteins on the basis of diffuse scattering15.
The properties of the ensemble of structures giving rise to the model diffraction pattern are reflected in the details of the convolution carried out on the pair correlation function. The pair correlation function corresponding to the model structural ensemble, (eq. 2) pm(r), is computed from the convolution of the pair correlation function of the reference structure, pr(r), and a Gaussian of half width σ(r) (which may be a function of the interatomic vector length r).
| (2) |
The ‘*’ in equation (2) denotes convolution. The form of this construction is sufficiently general to be useful for a broad range of model types. The simplest model is one in which each atom undergoes uniform uncorrelated fluctuations about an equilibrium position as might be observed in a crystal. The effect of this type of fluctuation can be modeled by convolution of the pair correlation function of the reference structure with a Gaussian of width, σ, that is independent of the length of the interatomic vector (the Uniform Disorder Model). According to the convolution theorem this operation corresponds to multiplying the WAXS pattern by a Gaussian with half-width inversely proportional to σ. Disorder of this kind would result in a progressive reduction of scattered intensity as scattering angle increases. This trend is not observed in the experimental data as the predominant signature of the observed concentration effects is that scattering is not significantly reduced at larger scattering angles. This indicates that the structural fluctuations have a greater effect on long interatomic vectors than on shorter ones and implies that the observed effect is due to fluctuations of rigid bodies in which short interatomic vectors are relatively fixed in length.
To more closely approximate these observations, two additional models for disorder were tested. In these models the fluctuations in interatomic distance increase in magnitude for longer interatomic vectors. In the first of these models (the Nearest Neighbor Model), σ(r) was chosen to increase proportional to ∼r0.5. This type of model is often used to model disorder in one-dimensional systems where next-nearest neighbor distances are distributed as the convolution of two nearest neighbor distributions. This model also predicts a significant decrease in intensity at large angles and is thereby inconsistent with the observed data.
However, when fluctuations are modeled as proportional to interatomic vector length (σ(r) ∝ r; Rigid Body Model) the predicted scattering at wide angles remains relatively constant while peaks and troughs at moderate angle are blurred with a character similar to that observed. In this model smaller structural elements of the protein move only slightly, resulting in small changes of the intensity patterns at high scattering angles. However, larger structural elements such as domains or secondary structures shift relatively more, affecting intensities at smaller scattering angles. The value of σ(r) giving rise to the calculated scattering pattern that most closely approximates the observed low concentration (4.2 mg/ml) pattern for hemoglobin is σ(r) =0.12 (+/− 0.03) r. In other words, to construct this model ensemble, each interatomic vector of length 10 Å in the reference structure was replaced by a Gaussian distribution of vectors with average length 10 Å and standard deviation of 1.2 Å (0.12r). Corresponding replacements were made for interatomic vectors of all lengths.
A highly sensitive measure of the effect of structural polymorphism on a diffraction pattern is the ratio of intensities measured from the reference structure to those computed for the model ensemble. This ratio was calculated and compared to the corresponding ratio of diffraction intensities measured from proteins at the reference concentration (47 mg/ml) to that measured from proteins at low concentration (4.2 mg/ml) as shown in Figure 6a for hemoglobin. The computed ratio in red derived from the model corresponds well to the observed ratio in black over the full range of scattering angles, indicating that the form and scale of the model ensemble closely approximates the fluctuations occurring in hemoglobin at 4.2 mg/ml. The quality of data is sufficient to reject models in which the scale of fluctuations is outside the range 0.12 ± 0.03 r. Extrapolated to zero concentration, the estimated fluctuation range for hemoglobin is 0.15 ± 0.03 r – in other words, structural elements with characteristic length of 10 Å would need to exhibit motions of about 1.0 to 1.5 Å relative to one another to account for the observations.
Figure 6.
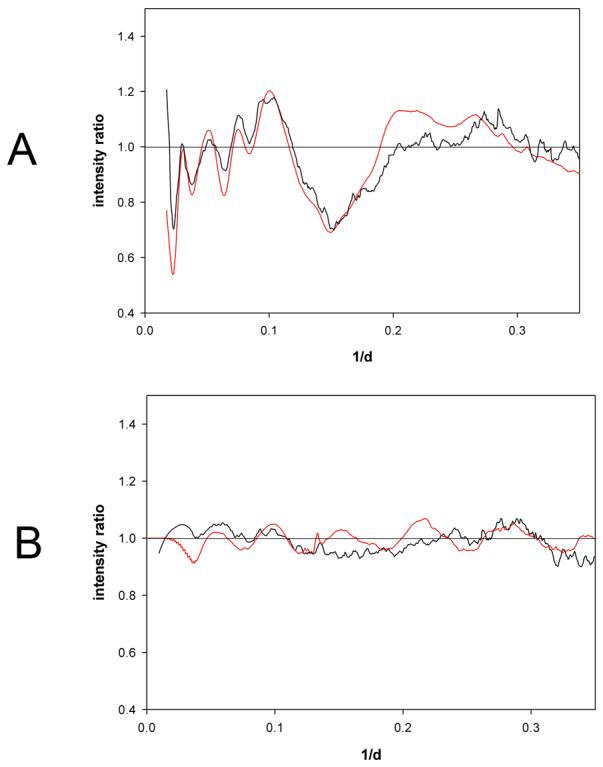
Ratio of intensities from reference state and low concentration state. Intensity ratios from the reference state (47 mg/ml) and low concentration state (4.1 mg/mL) calculated directly from scattering data (black curves) compared from the corresponding ratio computed from the reference state intensity and a model for disorder as described in text (red curves). (a) Hemoglobin observed ratio compared to that calculated using a model for structural fluctuations in which each interatomic vector was replaced by a distribution of vectors corresponding to a Gaussian with half-width of 0.15 times the length of the vector. (b) Lysozyme observed ratio compared to that calculated using a model for structural fluctuations in which each interatomic vector was replaced by a distribution of vectors corresponding to a Gaussian with half-width of 0.06 times the length of the vector.
Structural fluctuations in other proteins
The observed intensities indicate that the structural fluctuations exhibited by lysozyme (Figures 2b, 3b) at low concentration are far smaller in magnitude than those observed for hemoglobin. The intensity ratio observed for lysozyme (Figure 6b) is closest to that computed using a Gaussian of width σ(r) =0.06 r. Fluctuations this small produce changes in scattered intensity that are not significantly greater than the noise level of the data and any Gaussian with width in the range σ =0.06 ± 0.05 r is consistent with the measured data.
At very low concentrations (≤ 2 mg/ml), wide angle scattering (0.15-0.3 Å−1) from lysozyme exhibits some decrease in intensity, suggesting an increase in local fluctuations of residues (see Figure 2b). This effect is also observed in scattering from myoglobin and to varying degrees in the other protein data sets. Although the weak scattering from proteins at these concentrations makes it difficult to quantitate the effect, it suggests that at the lowest concentrations studied here an increase in local fluctuations on the scale of residues (rather than secondary structures or domains) does occur in most proteins.
Results of analogous WAXS experiments from solutions over a wide concentration range for hen egg white avidin (Figure 7); bovine serum albumin (Figure 8) and myoglobin (Figure 9) are summarized in Table 1. At each scattering angle, the concentration dependence of intensity was approximated by [I = A exp(−aC/c1/2) + BC] where C is the concentration, A provides a measure of the magnitude of the effect of structural fluctuations, c1/2 is the concentration at which the effect is half maximum and ‘a’ is a constant of proportionality (= −ln(2)). The linear term, BC, is due to change in contrast over the concentration range studied. Intensity was fit to this functional form at every scattering angle, and the average values of c1/2 tabulated (Table 1). Approximate magnitude of the fluctuations giving rise to the effect were estimated as described for hemoglobin (above) and then extrapolated to zero concentration. BSA exhibits a modest but statistically significant effect at very low concentrations (<15 mg/ml). Myoglobin and avidin exhibit significant increases in fluctuations with a magnitude comparable to that of hemoglobin as indicated by their σ(r)/r values.
Figure 7.

Scattering intensity as a function of concentration of avidin. The observed scattering intensities at selected 1/d values have been plotted as a function of concentration. (a-d) scattering from avidin at the 1/d values indicated. Each of the 1/d values chosen for these representative plots corresponds to a peak or trough in the scattering curves in Supplementary Figure 3 ((a) 1/d = 0.0546; (b) 1/d = 0.0669; (c) 1/d = 0.1449; (d) 1/d = 0.2381 Å−1)). Error bars and fit curves were calculated as described in Figure 4.
Figure 8.

Scattering intensity as a function of concentration of BSA. The observed scattering intensities at selected 1/d values have been plotted as a function of concentration. (a-d) scattering from BSA at the 1/d values indicated. Each of the 1/d values chosen for these representative plots corresponds to a peak or trough in the scattering curves in Supplementary Figure 2 ((a) 1/d = 0.0452; (b) 1/d = 0.0603; (c) 1/d = 0.0891; (d) 1/d = 0.1552 Å−1)). Error bars and fit curves were calculated as described in Figure 4.
Figure 9.

Scattering intensity as a function of concentration of myoglobin. The observed scattering intensities at selected 1/d values have been plotted as a function of concentration. (a-d) scattering from myoglobin at the 1/d values indicated. Each of the 1/d values chosen for these representative plots corresponds to a peak or trough in the scattering curves in Supplementary Figure 3 ((a) 1/d = 0.0570; (b) 1/d = 0.0835; (c) 1/d = 0.1028; (d) 1/d = 0.1562 Å−1)). Error bars and fit curves were calculated as described in Figure 4.
Table 1.
Comparison of fluctuation and protein characteristics for representative proteins. σo(r)/r is the estimated increase in half-width of fluctuations from the reference state to zero concentration assuming that at each scattering angle, the concentration dependence of intensity could be approximated by [I = A exp(−aC/c1/2) + BC] where C is the concentration, A provides a measure of the magnitude of the effect of structural fluctuations, c1/2 is the concentration at which the effect is half maximum and ‘a’ is a constant of proportionality (= −ln(2)). The linear term, BC, is due to change in contrast over the concentration range studied. Structure class is protein fold class according to SCOP54. EC = extracellular; IC = intracellular.
| Protein | σo(r)/r |
c1/2 (mg/ml) |
subunits | # disulfide bonds |
structure class |
MW | location |
|---|---|---|---|---|---|---|---|
| BSA (5°C) |
0.06+ 0.02 | 2.3 | monomer | 17 | all α | 67 KDa | EC (secreted) |
| Lysozyme (5°C) |
0.03+ 0.02 | 9.2 | monomer | 4 | α + β | 14 KDa | EC (secreted) |
| Avidin (5°C) |
0.20+ 0.10 | 8.7 | tetramer | 1 per chain |
all β | 57 KDa | EC (secreted) |
| Myoglobin (5°C) |
0.17+ 0.04 | 9.9 | monomer | 0 | all α | 17 KDa | IC |
| hemoglobin (5°C) |
0.15+ 0.03 | 9.9 | tetramer | 0 | all α | 46 KDa | IC |
| hemoglobin (37°C) |
0.16+ 0.04 | 10.7 | tetramer | 0 | all α | 46 KDa | IC |
The effect of temperature on hemoglobin breathing
The structural fluctuations observed in hemoglobin are temperature dependent, increasing modestly as temperature rises. At higher temperatures, the fluctuations appear to occur at higher concentrations before being suppressed by crowding as reflected in the c1/2 values (Table 1). The effect is most clearly observed at small scattering angles. Figure 10 compares small angle scattering patterns from hemoglobin at 5°, 37° and 45° C for 20 mg/ml solutions (Figure 10a) and 150 mg/ml solutions (Figure 10b). In the 150 mg/ml solutions, statistically significant, temperature-dependent differences were observed only at the first maximum (0.0253 Å−1) which decreases in intensity (by roughly 9%) and sharpness with increasing temperature. At lower concentration similar behavior is observed but the scale of the effect is larger. At 20 mg/ml, the first maximum is flattened out compared to that at 150 mg/ml, and the effect of temperature is to further decrease its intensity (by about 18%) and sharpness. Also, at low concentration statistically significant, temperature-dependent differences are observed at the positions of several minima and maxima at wider angles in the scattering pattern (data not shown). At the higher concentration (150 mg/ml) macromolecular crowding appears to suppress the increase in structural fluctuations induced by increased temperature. At all concentrations of hemoglobin analyzed, the data indicate the presence of greater structural fluctuations in the specimen at higher temperature, with the effect of temperature amplified at lower concentrations.
Figure 10.
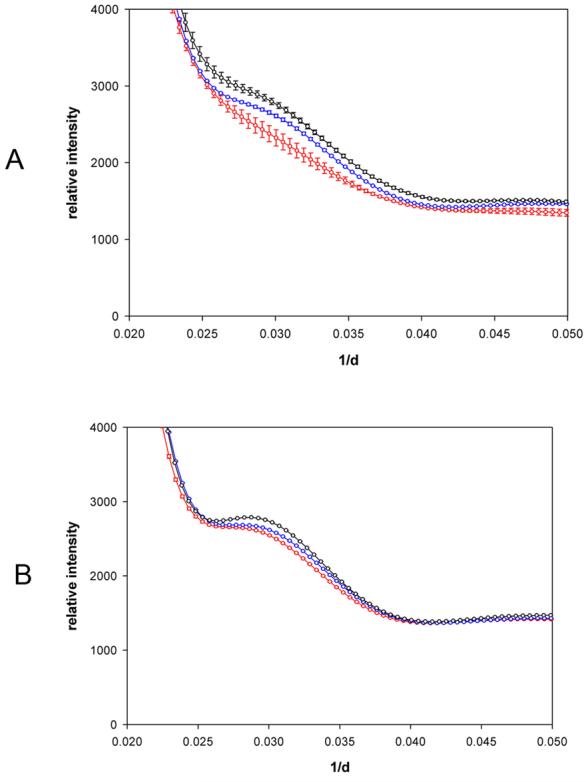
Effect of temperature on the observed scattering intensity from hemoglobin. The observed scattered intensities at low angle (1/d values from 0.020 to 0.050) have been plotted for hemoglobin solutions at 5°C (black); 37°C (blue) and 45°C (red). Error bars were calculated as in Figure 4. Data from hemoglobin at 20 mg/ml (a) and 150 mg/ml (b) was collected as detailed in Methods.
Discussion
The data presented here demonstrate concentration-dependent trends in the WAXS patterns for a variety of proteins of different size and structure. We have interpreted these trends as due to increase in the scale of collective motion of the proteins - that is, increase in the breadth of the native ensemble - as protein concentration decreases. Alternatively, this trend could be due to systematic changes in the structure of the proteins or to oligomerization or aggregation of the proteins.
We believe that structural changes are unlikely to account for the observations because of the similarity of the effect of decreasing concentration with the effect of increasing temperature. An increase in the breadth of the native ensemble as temperature increases is expected on the basis of first principles. Furthermore, there is no reason to believe that increased temperature and decreased concentration should lead to similar changes in the structure of hemoglobin. The fact that both increased temperature and decreased concentration lead to increases in fluctuations is not only self-consistent but consistent with trends expected in response to changes of these environmental variables.
Aggregation - the formation of dimers or higher order oligomers - cannot account for the observations reported here. Evidence for non-specific aggregation can be readily observed by small-angle x-ray scattering. In those samples with protein concentration over 100 mg/ml we observe weak correlations that correspond to inter-protein distances. For instance, in the hemoglobin sample at 257 mg/ml, there is a weak, diffuse peak in the pair-correlation function at about 83 Å (data not shown), closely corresponding to the average distance between hemoglobin molecules expected in a solution at that concentration. As dimerization would result in a peak at 60-65 Å, this is clear evidence that the proteins are soluble with an average of about 20 Å between the surfaces of adjacent molecules.
The nature of the structural fluctuations reported here can be surmised by the range of scattering angles over which changes as a function of concentration are observed. Most of the concentration-dependent intensity shift occurs at scattering angles corresponding to spacings of 5 Å or larger (1/d < 0.2 Å−1; see for instance Figure 3a). This implies that the observed effects are due to relative motion of structures with linear dimensions greater than 5 Å. Secondary structures such as α-helices and β-sheets have characteristic length scales of 10 Å or larger, making them strong candidates for the rigid bodies undergoing the fluctuations, but relative motion of larger rigid structural elements such as domains cannot be ruled out on the basis of our observations.
The scale of motion predicted by the Rigid Body Model for hemoglobin extrapolated to zero concentration (0.15 r +/− 0.03) indicates that objects with characteristic length of 10 Å would need to exhibit motions of about 1.0 to 1.5 Å relative to one another to account for the observations. This is a significant size range as several lines of evidence suggest that this scale of fluctuation approaches, but does not exceed the limit beyond which the protein tertiary structure will be substantially disrupted. Chothia observed some time ago that relative motion of secondary structural elements up to about 1.5 Å can usually be accommodated by rotations of side chains without breaking hydrogen bonds but that larger scale motions require restructuring of an interface32. Consequently, the fluctuation range suggested by these data will most likely occur without significant alteration in the pattern of intramolecular bonds that stabilize the protein. The data presented here suggest that the scale of motion is a sensitive function of the concentration in very dilute solutions.
Myoglobin and avidin appear to undergo structural fluctuations of a similar scale to that of hemoglobin, with virtually the same concentration dependence of the observed effect when expressed in mg/ml (Table 1). Since myoglobin corresponds in size and structure to one of the four subunits of hemoglobin, this observation suggests that the observed fluctuations in hemoglobin are due not to the relative motions of its four subunits (i.e. inter-subunit), but rather to relative motions of smaller structures (i.e. secondary structural elements).
Dynamics of proteins have been studied over multiple time scales, from picoseconds to milliseconds and slower. Although extensive experimental and computational work has been carried out on fast dynamics, slower time scales have proven less accessible. The spatial scale of concentration-dependent changes in native ensemble reported here suggest that the motions leading to these changes are slow, collective motions. In particular, the relative insensitivity of scattering in the wide-angle range corresponding to spacings of 3-5 Å, suggest that fast dynamics involving individual atoms or groups do not change significantly as protein concentration decreases.
Residual dipolar couplings (RDCs) have been used to study slow correlated motions in a number of proteins34, including protein G35, ubiquitin36, the B3 IgG binding domain of streptococcal protein G (GB3)37, myoglobin38 and hemoglobin39. Cross-correlated chemical shifts have also been used in studies of ubiquitin40,41. But the nature, distribution and significance of these motions remain poorly understood. Our results indicate that care should be taken in choosing protein concentration at which these studies are carried out as results could vary significantly at total protein concentrations below ∼50 mg/ml.
The original study of dynamics in myoglobin interpreted the RDCs as reflecting large-scale motions of secondary structures relative to one another37, but this interpretation has been questioned42. No follow-up study to resolve the presence of collective motions in myoglobin has been reported. The original work was carried out at 5 mM protein (85 mg/ml), a concentration at which we would expect relatively little correlated motion based on the data presented here. A study in which RDCs were used to determine the quaternary structure of hemoglobin in solution39 also utilized 15N relaxation data to suggest significant conformational exchange contributions at contact sites between the α1β1 and α2β2 dimers. More recent work43 has demonstrated that hemoglobin dynamics is dependent on the quaternary structure, being more flexible in the deoxy state than the ligand-bound state. These NMR studies have been carried out at concentrations in the range of 50-75 mg/ml. Our results suggest that collective motion will be relatively modest at these concentrations and that studies carried out as a function of concentration could be used to identify those aspects of the RDC data that are due to slow correlated motions.
The effect of temperature on fluctuations is most readily observed at small scattering angles indicating that increasing temperature has greater effect on large interatomic vector lengths than on small ones. This contrasts with what is observed in protein crystals. In crystals, the protein lattice restricts large-scale motions by forcing interatomic vectors to fluctuate in an interdependent manner and thereby results in fluctuations in the interatomic vector lengths that are essentially independent of length. In proteins in solution, interatomic vectors fluctuate independently and without the restrictions imposed by a crystal lattice, resulting in fluctuations in interatomic vector lengths that increase in magnitude as a function of length. Increase in temperature or decrease in concentration enhance the scale of these fluctuations independently and the effects of temperature and concentration are additive.
The correspondence of the behavior of hemoglobin and myoglobin also support the notion that the concentration dependence of the structural fluctuations is a consequence of molecular crowding. The measured effect is virtually identical for myoglobin and hemoglobin when expressed in mg/ml, but would differ by a factor of four if expressed in terms of molarity. The observed behavior is that expected for crowding, which is also referred to as the “excluded volume effect”, because it arises under conditions where high concentrations of molecules occupy a significant proportion of the solution volume, making it unavailable to other molecules16; 44.
The studies carried out on the proteins listed in Table 1 indicate that neither size, structure class, subcellular location nor the presence of multiple subunits correlate with the measured degree of breathing. For example, the studies of lysozyme indicate that it undergoes little if any concentration-dependent structural fluctuations although it is roughly the same molecular weight as myoglobin. These observations strongly suggest that lysozyme is a far more rigid molecule than hemoglobin or myoglobin. Although BSA is a much larger molecule than lysozyme, it also appears to undergo little concentration-dependent structural fluctuation until very low concentrations. By contrast, Hushcha et al.45 report a slight increase in the relaxation time (i.e. decrease in amplitude) of collective motions of HSA segments with the increase of protein concentration from 10 to 40 mg/ml in water based on acoustic relaxation spectroscopy. Lysozyme and BSA are cross-linked by 4 and 17 disulfide bonds respectively, whereas avidin possesses only one disulfide per chain and hemoglobin and myoglobin have none. The limited data presented here implies that the presence of disulfide bonds may serve to brace or stiffen the tertiary structure and preclude fluctuations from occurring on the scale seen in hemoglobin, avidin and myoglobin.
The results reported here indicate that in dilute solutions hemoglobin, avidin and myoglobin undergo structural fluctuations in which rigid structural elements undergo relative motions with magnitudes that at very low concentrations can approach 15% of the length of the corresponding interatomic vectors. Increase in the concentration of protein leads to suppression of these fluctuations. An increase in temperature from 5° to 45° for hemoglobin results in a correspondingly modest increase in the observed effect. The data indicate that increased temperature results in movements that are slightly increased in spatial scale and are observable to slightly higher concentrations. In other words, at a higher temperature, a more concentrated protein solution is required to generate the same molecular ‘crowding’ effect.
It has been observed that proteins stored at low concentration are more likely to denature than those at higher concentrations46. For the most part, this phenomenon has been blamed on interaction of the protein with the surface of its container. The data reported here suggest that at low concentrations structural fluctuations around a native conformation may transiently expose hydrophobic surfaces within the protein which can interact with the container surface or with other proteins leading to adsorption or precipitation. Reduction of disulfide bonds in both BSA and lysozyme result in aggregation47; 48. It is likely that in the absence of disulfide bonds, these proteins undergo fluctuations sufficient to expose hydrophobic surfaces that interact with one another leading to precipitation. In high concentration solutions such as those achieved within the cell cytoplasm, interactions among proteins may act to suppress most of the large scale motion, thereby stabilizing protein structure.
Molecular crowding is a significant effector of protein function in high concentration media16. The crowded interior of a cell gives rise to a multitude of protein-protein interactions that may alter the nature and magnitude of structural fluctuations exhibited by proteins and potentially leads to functional properties different from those in dilute solutions. Here we have experimentally demonstrated that protein dynamics are suppressed in concentrated solutions as predicted by computer simulations19,20. This stabilization contributes to the functional differences observed between experimentally dilute solutions and highly concentrated, physiologically relevant microenvironments16.
WAXS provides a quantitative measure of changes in motion due to changes in protein environment. Although the experiments described here analyzed only a small set of representative proteins, significant diversity in dynamic behavior was observed. These results indicate that protein dynamics are highly sensitive to both structure and solution conditions and suggest that proteins will be found to exhibit a far greater variety of dynamic behaviors than that characterized to date.
Materials and Methods
Protein Preparation
Bovine erythrocyte hemoglobin (Calbiochem, EMD Biosciences, Inc., San Diego, CA), equine myoglobin, bovine serum albumin (Sigma, St. Louis, MO) and hen egg white avidin (Affiland S.A., Ans-liege, Belgium) were diluted in phosphate-buffered saline without calcium and magnesium (Biowhittaker, Cambrex, Rockland, ME) to a final concentrated solution as indicated in the figure legend, then serially diluted to the noted concentrations. Hen egg white lysozyme (Sigma, St. Louis, MO) was diluted into 20 mM sodium acetate buffer, pH 4.5, with serial dilutions carried out as for the other samples studied. All solutions were maintained at 4° C in a CoolSafe cooler (Diversified Biotech, Boston, MA) until data was collected.
WAXS Data Collection
Wide-angle x-ray scattering (WAXS) data were collected at the BioCAT undulator beam line (18ID) at the Advanced Photon Source (APS), Argonne, IL49. The experimental layout was arranged as previously described25. The sample cell consisted of a thin-walled quartz capillary (1 or 1.5 mm I.D.) attached to a programmable pump (Hamilton Microlab 500 series) that was adjusted to deliver continuous flow through the capillary during data collection. The ambient temperature of the air surrounding the capillary and sample tubing was manipulated by attachment of an ethylene glycol bath to the brass capillary holder and through an outer layer of tubing surrounding the inner sample tubing during data collection. The x-ray scattering pattern was recorded with a MAR165 2kx2k CCD detector. The specimen to detector distance was approximately 170mm and was calibrated using powder diffraction rings from either silicon or silver-behenate. The beamline is capable of delivering approximately 2 × 10¹³ photons/sec/100 mA of beam current. As previous experience on the BioCAT beamline has demonstrated that proteins under a variety of physical conditions are damaged after exposure times of a few tenths of a second to a few seconds at these intensity levels, in these experiments 8 to 32 20 μm aluminum foils were used (depending on the concentration of protein in the samples) as x-ray beam attenuators to control the incident beam flux. In most cases, a data set consisted of a series of 1 second exposures with four from buffer, seven from protein solution and five from the empty capillary. Exposures from sample and buffer were alternated to minimize the possible effects of drift in any experimental parameter. Incident beam flux was monitored using nitrogen gas filled ion chambers. Integrated beam flux during each exposure was used to scale scattering from protein solutions with scattering from buffer solutions. Diffraction data was collected using a flow cell in which no protein was exposed to beam for more that 100 ms. At these exposure levels, the effect of radiation damage on radio-sensitive test proteins is undetectable28. Outlier patterns, generated due to passage of small bubbles through the x-ray beam during the exposure, were removed prior to averaging. Standard deviations of the observed data were calculated, with error propagation formulae used to calculate their effect on the final estimate of scattering from protein.
Scattering Data Analysis
The two dimensional scattering patterns were integrated radially to one-dimensional scattering intensity profiles using the program Fit2D version 12.07750; 51; 52. The origin of the diffraction pattern was determined from the powder diffraction rings from silver-behenate and/or silicon powder. Scattering from samples should be separable into four individual components: that due to scattering from the protein; from the bulk solvent; from the solvent of hydration; and from the capillary. Scattering from the solvent of hydration (boundary layer), although potentially important at small angles of scattering, is generally at least two orders of magnitude weaker than any other contribution in the range of angles studied here53. Scattering from protein was estimated according to:
| (2) |
where Iobs was the measured scattering from the protein sample; Icap the measured scattering from the empty capillary; vex is the estimated proportion of the solution taken up by the protein (excluded volume), and Isolvent was estimated by
| (3) |
where Ibkgd is the measured scattering from the capillary containing buffer. Scattering from empty capillary does not adequately reflect the scattering it contributes when the capillary is filled with buffer or protein solution, due to absorption of scattering by buffer and/or protein. This was accounted for by modeling the capillary scatter as
| (4) |
The scale factor and constant were selected by empirically fitting the capillary scatter to the scatter from buffer-filled capillary in the scattering range (1/d) = 0.05 to 0.2 Å−1 since scatter from buffer is negligible in this range (see Figure 1).
Acknowledgements
This work and use of the Advanced Photon Source was supported by the U.S. Department of Energy under contract DE-AC-02-06CH11357. BioCAT is a National Institutes of Health-supported Research Center RR-08630.
Abbreviations used
- WAXS
wide angle x-ray scattering
Footnotes
Publisher's Disclaimer: The submitted manuscript has been created by UChicago Argonne, LLC, Operator of Argonne National Laboratory (“Argonne”). Argonne, a U.S. Department of Energy Office of Science laboratory, is operated under Contract No. DE-AC02-06CH11357. The U.S. Government retains for itself, and others acting on its behalf, a paid-up nonexclusive, irrevocable worldwide license in said article to reproduce, prepare derivative works, distribute copies to the public, and perform publicly and display publicly, by or on behalf of the Government.
Publisher's Disclaimer: This is a PDF file of an unedited manuscript that has been accepted for publication. As a service to our customers we are providing this early version of the manuscript. The manuscript will undergo copyediting, typesetting, and review of the resulting proof before it is published in its final citable form. Please note that during the production process errors may be discovered which could affect the content, and all legal disclaimers that apply to the journal pertain.
References
- 1.Frauenfelder H, Sligar SG, Wolynes PG. The energy landscapes and motions of proteins. Science. 1991;254:1598–1603. doi: 10.1126/science.1749933. [DOI] [PubMed] [Google Scholar]
- 2.Karplus M, McCammon JA. Molecular dynamics simulations of biomolecules. Nat Struct Biol. 2002;9:646–652. doi: 10.1038/nsb0902-646. [DOI] [PubMed] [Google Scholar]
- 3.Benkovic SJ, Hammes-Schiffer S. A perspective on enzyme catalysis. Science. 2003;301:1196–202. doi: 10.1126/science.1085515. [DOI] [PubMed] [Google Scholar]
- 4.Lindorff-Larsen K, Best RB, Depristo MA, Dobson CM, Vendruscolo M. Simultaneous determination of protein structure and dynamics. Nature. 2005;433:128–132. doi: 10.1038/nature03199. [DOI] [PubMed] [Google Scholar]
- 5.Vendruscolo M, Paci E, Dobson CM, Karplus M. Rare fluctuations of native proteins sampled by equilibrium hydrogen exchange. J Am Chem Soc. 2003;125:15686–15687. doi: 10.1021/ja036523z. [DOI] [PubMed] [Google Scholar]
- 6.Fraunfelder H, Petsko GA, Tsernoglou D. Temperature-dependent x-ray diffraction as a probe of protein structural dynamics. Nature. 1979;280:558–563. doi: 10.1038/280558a0. [DOI] [PubMed] [Google Scholar]
- 7.Petsko GA, Ringe D. Fluctuations in Protein structure from x-ray diffraction. Annu Rev Biophys Bioeng. 1984;13:331–371. doi: 10.1146/annurev.bb.13.060184.001555. [DOI] [PubMed] [Google Scholar]
- 8.Caspar DL, Clarage J, Salunke DM, Clarage M. Liquid-like movements in crystalline insulin. Nature. 1988;332:659–662. doi: 10.1038/332659a0. [DOI] [PubMed] [Google Scholar]
- 9.Zaccai G. How soft is a protein? A protein dynamics force constant measured by neutron scattering. Science. 2000;288:1604–1607. doi: 10.1126/science.288.5471.1604. [DOI] [PubMed] [Google Scholar]
- 10.Parak FG. Proteins in action: the physics of structural fluctuations and conformational changes. Curr Opin Struct Biol. 2003;13:552–557. doi: 10.1016/j.sbi.2003.09.004. [DOI] [PubMed] [Google Scholar]
- 11.Isralewitz B, Gao M, Schulten K. Steered molecular dynamics and mechanical functions of proteins. Curr Opin Struct Biol. 2001;11:224–230. doi: 10.1016/s0959-440x(00)00194-9. [DOI] [PubMed] [Google Scholar]
- 12.Krebs WG, Alexandrov V, Wilson CA, Echols N, Yu H, Gerstein M. Normal mode analysis of macromolecular motions in a database framework: developing mode concentration as a useful classifying statistic. Proteins: Structure, function and genetics. 2002;48:682–695. doi: 10.1002/prot.10168. [DOI] [PubMed] [Google Scholar]
- 13.Kossiakoff AA. Protein dynamics investigated by neutron diffraction. Methods Enzymol. 1986;131:433–447. doi: 10.1016/0076-6879(86)31051-6. [DOI] [PubMed] [Google Scholar]
- 14.Phillips GNJ. Comparison of the dynamics of myoglobin in different crystal forms. Biophys J. 1990;57:381–3. doi: 10.1016/S0006-3495(90)82540-6. [DOI] [PMC free article] [PubMed] [Google Scholar]
- 15.Clarage JB, Clarage MS, Phillips WC, Sweet RM, Caspar DL. Correlations of atomic movements in lysozyme crystals. Proteins. 1992;12:145–157. doi: 10.1002/prot.340120208. [DOI] [PubMed] [Google Scholar]
- 16.Ellis RJ. Macromolecular crowding: obvious but underappreciated. Trends Biochem Sci. 2001;26:597–604. doi: 10.1016/s0968-0004(01)01938-7. [DOI] [PubMed] [Google Scholar]
- 17.Timasheff SN. The control of protein stability and association by weak interactions with water: how do solvents affect these processes? Annu Rev Biophys Biomol Struct. 1993;22:67–97. doi: 10.1146/annurev.bb.22.060193.000435. [DOI] [PubMed] [Google Scholar]
- 18.Sasahara K, McPhie P, Minton AP. Effect of dextran on protein stability and conformation attributed to macromolecular crowding. J Mol Biol. 2003;326:1227–1237. doi: 10.1016/s0022-2836(02)01443-2. [DOI] [PubMed] [Google Scholar]
- 19.Cheung MS, Klimov D, Thirumalai D. Molecular crowding enhances native state stability and refolding rates of globular proteins. Proc Natl Acad Sci U S A. 2005;102:4753–4758. doi: 10.1073/pnas.0409630102. [DOI] [PMC free article] [PubMed] [Google Scholar]
- 20.Minh DD, Chang CE, Trylska J, Tozzini V, McCammon JA. The influence of macromolecular crowding on HIV-1 protease internal dynamics. J Am Chem Soc. 2006;128:6006–7. doi: 10.1021/ja060483s. [DOI] [PMC free article] [PubMed] [Google Scholar]
- 21.van den Berg B, Ellis RJ, Dobson CM. Effects of macromolecular crowding on protein folding and aggregation. EMBO J. 1999;18:6927–6933. doi: 10.1093/emboj/18.24.6927. [DOI] [PMC free article] [PubMed] [Google Scholar]
- 22.van den Berg B, Wain R, Dobson C, Ellis RJ. Macromolecular crowding perturbs protein refolding kinetics: implications for folding inside the cell. EMBO J. 2000;19:3870–3875. doi: 10.1093/emboj/19.15.3870. [DOI] [PMC free article] [PubMed] [Google Scholar]
- 23.Hall D, Minton AP. Macromolecular crowding: qualitative and semiquantitative successes, quantitative challenges. Biochim Biophys Acta. 2003;1649:127–139. doi: 10.1016/s1570-9639(03)00167-5. [DOI] [PubMed] [Google Scholar]
- 24.Kim YS, Jones LS, Dong A, Kendrick BS, Chang BS, Manning MC, Randolph TW, Carpenter JF. Effects of sucrose on conformational equilibria and fluctuations within the native-state ensemble of proteins. Protein Sci. 2003;12:1252–1261. doi: 10.1110/ps.0242603. [DOI] [PMC free article] [PubMed] [Google Scholar]
- 25.Fischetti RF, Rodi DJ, Gore DB, Makowski L. Wide-angle X-ray solution scattering as a probe of ligand-induced conformational changes in proteins. Chem Biol. 2004;11:1431–43. doi: 10.1016/j.chembiol.2004.08.013. [DOI] [PubMed] [Google Scholar]
- 26.Tiede DM, Zhang R, Siefert S. Protein conformations explored by difference high-angle solution X-ray scattering: oxidation state and temperature dependent changes in cytochrome C. Biochemistry. 2002;41:6605–6614. doi: 10.1021/bi015931h. [DOI] [PubMed] [Google Scholar]
- 27.Hirai M, Iwase H, Hayakawa T, Miura K, Inoue K. Structural hierarchy of several proteins observed by wide-angle solution scattering. J Synchotron Radiat. 2002;9:202–5. doi: 10.1107/s0909049502006593. [DOI] [PubMed] [Google Scholar]
- 28.Fischetti RF, Rodi DJ, Mirza A, Irving TC, Kondrashkina E, Makowski L. High-resolution wide-angle X-ray scattering of protein solutions: effect of beam dose on protein integrity. J Synchrotron Radiat. 2003;10:398–404. doi: 10.1107/s0909049503016583. [DOI] [PubMed] [Google Scholar]
- 29.Tiede DM, Zhang R, Chen LX, Yu L, Lindsey JS. Structural characterization of modular supramolecular architectures in solution. J Am Chem Soc. 2004;126:14054–14062. doi: 10.1021/ja048209q. [DOI] [PubMed] [Google Scholar]
- 30.Zuo X, Cui G, Mertz KMJ, Zhang L, Lewis FD, Tiede DM. X-ray diffraction “fingerprinting” of DNA structure in solution for quantitative evaluation of molecular dynamics simulation. Proc Natl Acad Sci U S A. 2006;103:3534–3539. doi: 10.1073/pnas.0600022103. [DOI] [PMC free article] [PubMed] [Google Scholar]
- 31.Guinier A. X-ray diffractions in Crystals, Imperfect Crystals, and Amorphous Bodies. Dover Publications; Mineola, NY: 1994. [Google Scholar]
- 32.Luzzati V, Tardieu A. Recent Developments in Solution X-ray Scattering. Annu Rev Biophys Bioeng. 1980;9:1–29. doi: 10.1146/annurev.bb.09.060180.000245. [DOI] [PubMed] [Google Scholar]
- 33.Chothia C, Lesk AM. Helix movements in proteins. Trend. Bioch. Sci. 1985;10:116–118. [Google Scholar]
- 34.Tolman JR, Ruan K. NMR residual dipolar couplings as probes of biomolecular dynamics. Chem Rev. 2006;106:1720–1736. doi: 10.1021/cr040429z. [DOI] [PubMed] [Google Scholar]
- 35.Bouvignies G, Bernado P, Meier S, Cho K, Grzesiek S, Bruschweiler R, Blackledge M. Identification of slow correlated motions in proteins using residual dipolar and hydrogen-bond scalar couplings. Proc Natl Acad Sci U S A. 2005;102:13885–90. doi: 10.1073/pnas.0505129102. [DOI] [PMC free article] [PubMed] [Google Scholar]
- 36.Tolman JR, Al-Hashimi HM, Kay LE, Prestegard JH. Structural and dynamic analysis of residual dipolar coupling data for proteins. J Am Chem Soc. 2001;123:1416–24. doi: 10.1021/ja002500y. [DOI] [PubMed] [Google Scholar]
- 37.Clore GM, Schwieters CD. Amplitudes of protein backbone dynamics and correlated motions in a small alpha/beta protein: correspondence of dipolar coupling and heteronuclear relaxation measurements. Biochemistry. 2004;43:10678–91. doi: 10.1021/bi049357w. [DOI] [PubMed] [Google Scholar]
- 38.Tolman JR, Flanagan JM, Kennedy MA, Prestegard JH. NMR evidence for slow collective motions in cyanometmyoglobin. Nat Struct Biol. 1997;4:292–7. doi: 10.1038/nsb0497-292. [DOI] [PubMed] [Google Scholar]
- 39.Lukin JA, Kontaxis G, Simplaceanu V, Yuan Y, Bax A, Ho C. Quaternary structure of hemoglobin in solution. Proc Natl Acad Sci U S A. 2003;100:517–520. doi: 10.1073/pnas.232715799. [DOI] [PMC free article] [PubMed] [Google Scholar]
- 40.Fruh D, Tolman JR, Bodenhausen G, Zwahlen C. Cross-correlated chemical shift modulation: a signature of slow internal motions in proteins. J Am Chem Soc. 2001;123:4810–6. doi: 10.1021/ja003487k. [DOI] [PubMed] [Google Scholar]
- 41.Vugmeyster L, Perazzolo C, Wist J, Frueh D, Bodenhausen G. Evidence of slow motions by cross-correlated chemical shift modulation in deuterated and protonated proteins. J Biomol NMR. 2004;28:173–7. doi: 10.1023/B:JNMR.0000013828.58005.8a. [DOI] [PubMed] [Google Scholar]
- 42.Bax A, Tjandra N. Are proteins even floppier than we thought? Nat Struct Biol. 1997;4:254–6. doi: 10.1038/nsb0497-254. [DOI] [PubMed] [Google Scholar]
- 43.Song X-J, Yuan Y, Simplaceanu V, Sahu SC, Ho NT, Ho C. A comparative NKR study of the polypeptide backbone dynamics of hemoglobin in the deoxy and carbonmoxy forms. Biochemistry. 2007;46:6795–6803. doi: 10.1021/bi602654u. [DOI] [PMC free article] [PubMed] [Google Scholar]
- 44.Minton AP. Molecular crowding: analysis of effects of high concentrations of inert cosolutes on biochemical equilibria and rates in terms of volume exclusion. Methods Enzymol. 1998;295:127–149. doi: 10.1016/s0076-6879(98)95038-8. [DOI] [PubMed] [Google Scholar]
- 45.Hushcha T, Kaatze U, Peytcheva A. Dynamics of Human Serum Albumin Studied by Acoustic Relaxation Spectroscopy. Biopolymers. 2004;74:32–36. doi: 10.1002/bip.20038. T. [DOI] [PubMed] [Google Scholar]
- 46.Fagain CO. Stabilizing Protein Function. Springer-Verlag; Berlin: 1997. chapter 9. [Google Scholar]
- 47.Ueki T, Hiragi Y, Kataoka M, Inoko Y, Amemiya Y, Izumi Y, Tagawa H, Muroga Y. Aggregation of bovine serum albumin upon cleavage of its disulfide bonds, studied by the time-resolved small-angle X-ray scattering technique with synchrotron radiation. Biophys Chem. 1985;23:115–124. doi: 10.1016/0301-4622(85)80069-7. [DOI] [PubMed] [Google Scholar]
- 48.Takase K, Higashi T, Omura T. Aggregate Formation and the Structure of the Aggregates of Disulfide-Reduced Proteins. Journal of Protein Chemistry. 2002;21:427–433. doi: 10.1023/a:1021138718046. [DOI] [PubMed] [Google Scholar]
- 49.Fischetti R, Stepanov S, Rosenbaum G, Barrea R, Black E, Gore D, Heurich R, Kondrashkina E, Kropf AJ, Wang S, Zhang K, Irving TC, Bunker GB. The BioCAT undulator beamline 18ID: a facility for biological non-crystalline diffraction and X-ray absorption spectroscopy at the Advanced Photon Source. J Synchrotron Radiat. 2004;11:399–405. doi: 10.1107/S0909049504016760. [DOI] [PubMed] [Google Scholar]
- 50.Hammersley AP. FIT2D: An Introduction and Overview. ESRF Internal Report, ESRF97HA02T. 1997 [Google Scholar]
- 51.Hammersley AP. FIT2D V9.129 Reference Manual V3.1. ESRF Internal Report, ESRF98HA01T. 1998 [Google Scholar]
- 52.Hammersley AP, Svensson SO, Hanfland M, Fitch AN, Hausermann D. Two-Dimensional Detector Software: From Real Detector to Idealised Image or Two-Theta Scan. High Pressure Research. 1996;14:235–248. [Google Scholar]
- 53.Svergun D, Barferato C, Koch MHJ. CRYSOL-a program to evaluate x-ray solution scattering of biological macromolecules from atomic coordinates. J. Appl. Crystallogr. 1995;28:768–773. [Google Scholar]
- 54.Murzin AG, Brenner SE, Hubbard T, Chothia C. SCOP: a structural classification of proteins database for the investigation of sequences and structures. J Mol Biol. 1995;247:536–40. doi: 10.1006/jmbi.1995.0159. [DOI] [PubMed] [Google Scholar]