CooA from C. hydrogenoformans has been crystallized by the vapour-diffusion method using polyethylene glycol as a precipitant. The crystal diffracted to 2.3 Å resolution.
Keywords: CO sensors, transcription regulation, haem proteins
Abstract
CooA, a homodimeric haem-containing protein, is responsible for transcriptional regulation in response to carbon monoxide (CO). It has a b-type haem as a CO sensor. Upon binding CO to the haem, CooA binds promoter DNA and activates expression of genes for CO metabolism. CooA from Carboxydothermus hydrogenoformans has been overexpressed in Escherichia coli, purified and crystallized by the vapour-diffusion method. The crystal belongs to space group P21, with unit-cell parameters a = 61.8, b = 94.7, c = 92.8 Å, β = 104.8°. The native and anomalous difference Patterson maps indicated that two CooA dimers are contained in the asymmetric unit and are related by a translational symmetry almost parallel to the c axis.
1. Introduction
Transcription regulators, which are widely distributed throughout bacteria, play an important role in their metabolism. The catabolite activator protein (CAP) is a well characterized transcription regulator and many proteins have been identified as members of the CAP family (Busby & Ebright, 1999 ▶). They regulate the expression of specific genes in response to distinct external signals (effectors). CooA, a member of the CAP family, was first identified as a carbon monoxide (CO) dependent transcription factor in the photosynthetic bacterium Rhodospirillum rubrum (Aono et al., 1996 ▶; Shelver et al., 1997 ▶). CooA is a homodimeric haem protein composed of about 200 amino acids per monomer and the haem plays an important role in activating CO-dependent transcription. In the absence of CO, CooA has a six-coordinated ferrous haem with two endogenous ligands. Previous studies have proposed that CO binds to haem as an axial ligand and induces a conformational change of the DNA-binding domain for DNA binding. The only structure known for CAP is the effector (cAMP) bound form, whereas the structure of CooA has been determined as the inactive effector-free form for the protein from R. rubrum (Rr-CooA; Lanzilotta et al., 2000 ▶; McKay & Steitz, 1981 ▶; Schultz et al., 1991 ▶). Although the overall structure of the inactive form of Rr-CooA has a global structural similarity to the active form of CAP, the placement of the DNA-binding domains is completely different between them. This has suggested that a substantial conformational change of the DNA-binding domains occur upon CO binding to CooA. Owing to the lack of structural information on the effector-bound form of CooA, the details of this allosteric mechanism are still unclear. Here, we report the crystallization of CooA from Carboxydothermus hydrogenoformans (Ch-CooA; Inagaki et al., 2005 ▶; Youn et al., 2004 ▶) bound to the exogenous ligand imidazole.
2. Expression and purification
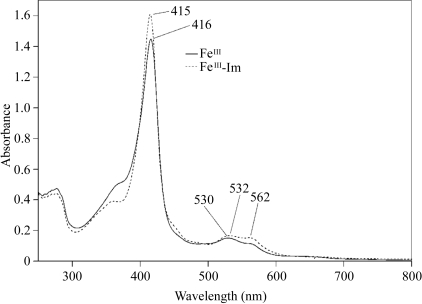
C-terminal 6×His (LEHHHHHH) tagged Ch-CooA was purified from an overexpressing strain of Escherichia coli using a Talon affinity column and a heparin column. The purity was assessed by Coomassie-stained SDS–PAGE (Fig. 1 ▶). The purified protein solution was applied onto a 1 ml Hi-Trap Heparin column and eluted with a high salt concentration (1 M NaCl). All purification steps were carried out under aerobic conditions at 277 K. The absorption spectra showed that the haem in Ch-CooA was in the ferric state. During purification, we noticed a marked change in the UV spectrum and concluded that the cause was binding of imidazole to the protein. The fractions eluted from the Talon column at a high concentration (400 mM) of imidazole contained Ch-CooA bound to imidazole in the ferric state (Fig. 2 ▶). Crystallization experiments were performed using the protein sample (10 mg ml−1) in 20 mM MES–NaOH buffer pH 6.0 containing 1 M NaCl).
Figure 1.
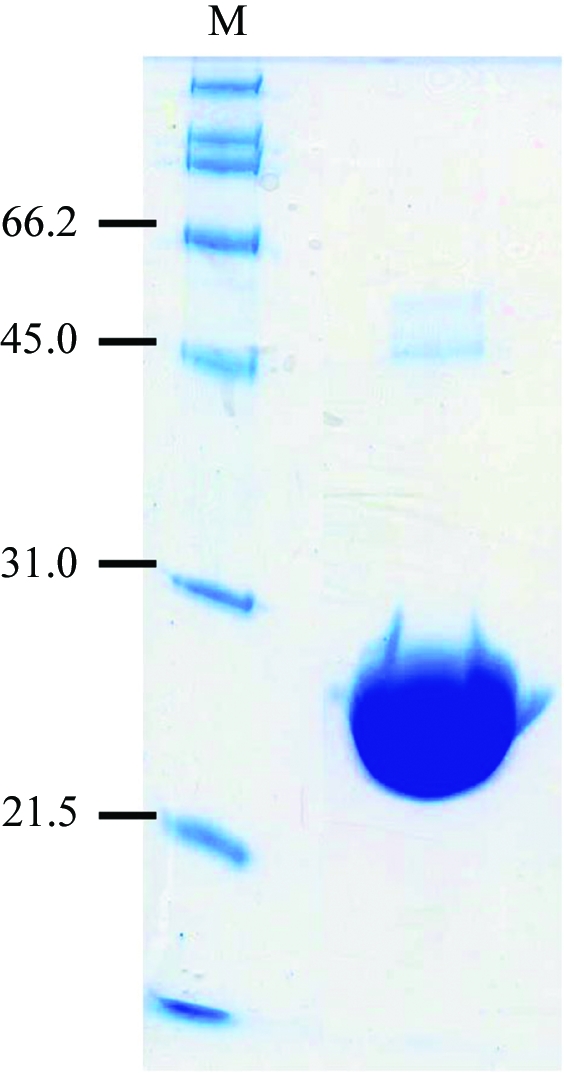
SDS–PAGE of purified Ch-CooA. Lane M, molecular-weight markers (kDa).
Figure 2.
Absorption spectra of purified Ch-CooA in imidazole-bound and imidazole-free forms. FeIII and FeIII-Im indicate the imidazole-free (ferric) and imidazole-bound (ferric) Ch-CooA, respectively.
3. Crystallization
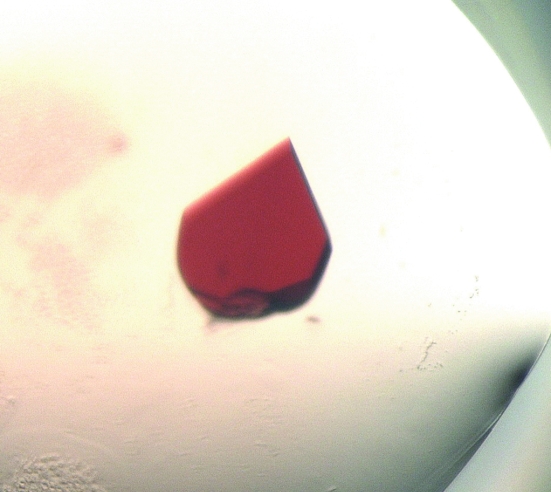
Initial crystallization trials were carried out using commercially available screening kits from Hampton Research (Crystal Screen, Grid Screen, Natrix and MembFac) implementing the sitting-drop vapour-diffusion technique in 96-well plates. Protein droplets prepared by mixing 1 µl protein solution and 1 µl reservoir solution were equilibrated against 100 µl reservoir solutions at 283 K. Clusters of small crystals were obtained with a reservoir solution consisting of 100 mM Bis-Tris buffer pH 5.5 and 25% PEG 3350. The crystallization conditions were refined and single crystals were obtained with a reservoir solution consisting of 100 mM Bis-Tris buffer pH 6.0, 30% PEG 3000, 200 mM NaCl, 5% glycerol and 5% dioxane at 293 K. Plate-like crystals appeared after 3–5 days and grew to approximate dimensions of 0.5 × 0.4 × 0.1 mm within one week (Fig. 3 ▶).
Figure 3.
Photograph of a Ch-CooA crystal; the largest dimension is 0.5 mm.
4. Data collection and crystallographic analysis
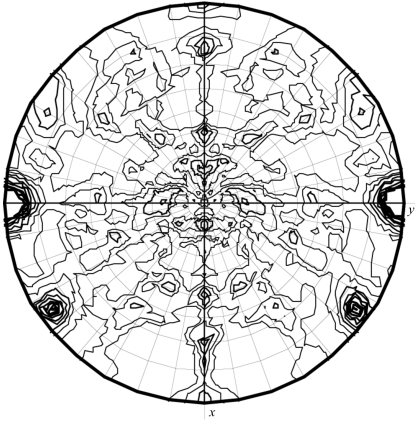
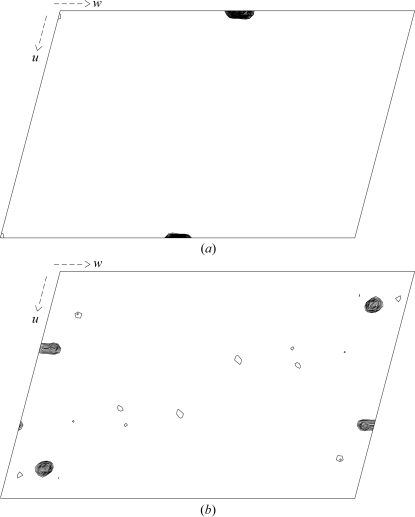
For data collection, the crystal was soaked in a cryoprotectant solution (30% PEG 3000, 500 mM NaCl, 10% glycerol) for a few minutes prior to freezing in a nitrogen cold stream. X-ray diffraction data sets were collected at 100 K on an R-AXIS imaging-plate camera system (Rigaku Co. Ltd) using Cu Kα radiation generated by a rotating-anode generator operated at 40 kV and 100 mA with a fine focus filament. The crystal-to-detector distance was maintained at 200 mm with an oscillation range per image of 1°, covering a total oscillation range of 360°. Diffraction from the crystals extends to 2.3 Å resolution. Determination of the unit-cell parameters and integration of reflections were performed using the program d*TREK (Pflugrath, 1999 ▶). The crystal is monoclinic and belongs to space group P21. The unit-cell parameters were determined to be a = 61.8, b = 94.7, c = 92.8 Å, β = 104.8°. A total of 227 281 reflections were integrated to a resolution of 2.3 Å and were then merged to obtain 35 094 unique reflections with an overall R merge and completeness of 0.036 and 76.3%, respectively (Table 1 ▶). Anisotropic diffraction spots are the main reason for the low completeness. The Matthews equation (Matthews, 1968 ▶) indicates that four Ch-CooA protein per asymmetric unit would yield a solvent content of 53%. Native Patterson and self-rotation functions were calculated using the programs FFT (Read & Schierbeek, 1988 ▶) and MOLREP (Vagin & Teplyakov, 1997 ▶). The self-rotation function showed the presence of peaks corresponding to a non-crystallographic twofold axis (Fig. 4 ▶). The native Patterson was analyzed for off-origin peaks that would indicate translational symmetry (Fig. 5 ▶ a). A large peak was detected on the v plane (v = 0.05) in the native Patterson map at u = 0 and w = 0.5. These results indicate that two Ch-CooA dimers are present in the asymmetric unit, related by a translational symmetry almost parallel to the c axis. The anomalous difference Patterson map showed clear peaks corresponding to the haem Fe atoms in the Harker section v = 1/2 (Fig. 5 ▶ b). The structure of Ch-CooA in the exogenous ligand (imidazole) bound form will make an important contribution to understanding the molecular mechanism of the CAP family.
Table 1. Summary of crystallographic data.
Values in parentheses are for the outer resolution shell.
| Source | Rigaku RA-Micro7 |
| Wavelength (Å) | 1.5418 |
| Space group | P21 |
| Unit-cell parameters (Å, °) | a = 61.8, b = 94.7, c = 92.8, β = 104.8 |
| VM (Å3 Da−1) (two dimers in ASU) | 2.5 |
| Resolution (Å) | 50.00–2.30 (2.38–2.30) |
| Total No. of reflections | 227281 |
| Unique reflections | 35094 |
| Multiplicity | 6.48 (5.02) |
| Completeness (%) | 76.3 (45.2) |
| Rmerge† (%) | 3.6 (10.0) |
R
merge = 
 , where Ii is the observed intensity and 〈Ii〉 is the average intensity over symmetry-equivalent measurements.
Figure 4.
A χ = 180 section of the self-rotation function calculated using MOLREP in the resolution range 15–3.0 Å, integration radius 5–30 Å.
Figure 5.
(a) Native Patterson map (0 < u < 1, v = 0.05, 0 < w < 1). (b) Anomalous Patterson map (0 < u < 1, v = 0.5, 0 < w < 1).
Acknowledgments
This work was partly supported by the Foundation of the University of Hyogo (HK), the Hyogoken Science Foundation (HK), the Yamanouchi Foundation for Research on Metabolic Disorders (HK), a Grant-in-Aid for Scientific Research B (16370065, SA) from The Japan Society for the Promotion of Science, a grant from The Japan Science Society (SI), The 21st COE Programs (YH), The National Project on Protein Structural and Functional Analyses (YH) and The Japanese Aerospace Exploration Agency Project (YH).
References
- Aono, S., Nakajima, H., Saito, K. & Okada, M. (1996). Biochem. Biophys. Res. Commun.228, 752–756. [DOI] [PubMed] [Google Scholar]
- Busby, S. & Ebright, R. H. (1999). J. Mol. Biol.293, 199–213. [DOI] [PubMed] [Google Scholar]
- Inagaki, S., Masuda, C., Akaishi, T., Nakajima, H., Yoshioka, S., Ohta, T., Pal, B., Kitagawa, T. & Aono, S. (2005). J. Biol. Chem.280, 3269–3274. [DOI] [PubMed] [Google Scholar]
- Lanzilotta, W. N., Schuller, D. J., Thorsteinsson, M. V., Kerby, R. L., Roberts, G. P. & Poulos, T. L. (2000). Nature Struct. Biol.7, 876–880. [DOI] [PubMed] [Google Scholar]
- McKay, D. B. & Steitz, T. A. (1981). Nature (London), 290, 744–749. [DOI] [PubMed] [Google Scholar]
- Matthews, B. W. (1968). J. Mol. Biol.33, 491–497. [DOI] [PubMed] [Google Scholar]
- Pflugrath, J. W. (1999). Acta Cryst. D55, 1718–1725. [DOI] [PubMed] [Google Scholar]
- Read, R. J. & Schierbeek, A. J. (1988). J. Appl. Cryst.21, 490–495. [Google Scholar]
- Schultz, S. C., Shields, G. C. & Steitz, T. A. (1991). Science, 253, 1001–1007. [DOI] [PubMed] [Google Scholar]
- Shelver, D., Kerby, R. L., He, Y. & Roberts, G. P. (1997). Proc. Natl Acad. Sci. USA, 94, 11216–11220. [DOI] [PMC free article] [PubMed] [Google Scholar]
- Vagin, A. & Teplyakov, A. (1997). J. Appl. Cryst.30, 1022–1025. [Google Scholar]
- Youn, H., Kerby, R. L., Conrad, M. & Roberts, G. P. (2004). J. Bacteriol.186, 1320–1329. [DOI] [PMC free article] [PubMed] [Google Scholar]


