Abstract
Outward currents through the inward rectifier K+ channel contribute to repolarization of the cardiac action potential. The properties of the IRK1 channel expressed in murine fibroblast (L) cells closely resemble those of the native cardiac inward rectifier. In this study, we added Mg2+ (0.44–1.1 mM) or putrescine (∼0.4 mM) to the intracellular milieu where endogenous polyamines remained, and then examined outward IRK1 currents using the whole-cell patch-clamp method at 5.4 mM external K+. Without internal Mg2+, small outward currents flowed only at potentials between −80 (the reversal potential) and ∼−40 mV during voltage steps applied from −110 mV. The strong inward rectification was mainly caused by the closed state of the activation gating, which was recently reinterpreted as the endogenous-spermine blocked state. With internal Mg2+, small outward currents flowed over a wider range of potentials during the voltage steps. The outward currents at potentials between −40 and 0 mV were concurrent with the contribution of Mg2+ to blocking channels at these potentials, judging from instantaneous inward currents in the following hyperpolarization. Furthermore, when the membrane was repolarized to −50 mV after short depolarizing steps (>0 mV), a transient increase appeared in outward currents at −50 mV. Since the peak amplitude depended on the fraction of Mg2+-blocked channels in the preceding depolarization, the transient increase was attributed to the relief of Mg2+ block, followed by a re-block of channels by spermine. Shift in the holding potential (−110 to −80 mV), or prolongation of depolarization, increased the number of spermine-blocked channels and decreased that of Mg2+-blocked channels in depolarization, which in turn decreased outward currents in the subsequent repolarization. Putrescine caused the same effects as Mg2+. When both spermine (1 μM, an estimated free spermine level during whole-cell recordings) and putrescine (300 μM) were applied to the inside-out patch membrane, the findings in whole-cell IRK1 were reproduced. Our study indicates that blockage of IRK1 by molecules with distinct affinities, spermine and Mg2+ (putrescine), elicits a transient increase in the outward IRK1, which may contribute to repolarization of the cardiac action potential.
Keywords: inward rectification, Mg2+, spermine, repolarization, putrescine
introduction
In the heart, large K+ conductance mediated by the inward rectifier K+ channel, i K1, maintains the high negative value of the resting potential of ventricular cells and Purkinje fibers (Noble, 1984; Noma et al., 1984; Sakmann and Trube, 1984; Hume and Uehara, 1985). The property of this channel that strongly impedes the flow of outward currents (rectification) is important for the long plateau phase of the cardiac action potential (Hutter and Noble, 1960; Sakmann and Trube, 1984). It has also been suggested that the small outward i K1 currents that flow at potentials near the reversal potential (Erev)1 contribute to the final repolarization of the action potential (Giles and Imaizumi, 1988; Ibarra et al., 1991; Shimoni et al., 1992). Interferences by other currents, however, have hampered the analysis of outward currents through i K1 channels (Shimoni et al., 1992).
Mechanisms underlying the strong inward rectification of i K1 have been studied extensively. A voltage-dependent gating has been shown to cause the rectification of i K1 currents at potentials around Erev (for review, see Vandenberg, 1994). With physiological concentrations of internal free Mg2+ (0.5–1.2 mM in cardiac myocytes, Murphy et al., 1991), blockage of the channel by Mg2+ (Matsuda et al., 1987; Vandenberg, 1987) also contributes to the rectification mainly at depolarized levels far from Erev (Ishihara et al., 1989). Recently, studies on channels exogenously expressed from cloned inward rectifier K+ channel genes, IRK1 (Kir 2.1, Kubo et al., 1993) and HRK1 (Kir 2.3, Makhina et al., 1994), have revealed that the channels are also blocked by internal cationic polyamines, spermine (Spm), spermidine (Spd), and putrescine (Put) (Fakler et al., 1994; Ficker et al., 1994; Lopatin et al., 1994; Fakler et al., 1995). Furthermore, these studies have strongly suggested that the gating of the strong inward rectifiers is caused by the blockage of the channels by endogenous Spm and Spd (Ficker et al., 1994; Lopatin et al., 1994, 1995). Among cations known to block strong inward rectifiers, Spm, which can possess four protonated sites at a physiological pH, shows the highest affinity with the channels, being about a 10-fold more potent blocker than Spd (Lopatin et al., 1994; Yang et al., 1995). The potency of Mg2+ for blocking IRK1 and HRK1 was shown to be similar to that for blocking i K1 channels (Matsuda, 1988; Lopatin et al., 1994; Taglialatela et al., 1994). However, Spm is more potent than Mg2+ or Put (diamine with two protonation sites) in blocking IRK1 and HRK1, by a factor of about 10,000 and 100, respectively (Lopatin et al., 1994; Yang et al., 1995).
When the IRK1 gene is expressed in murine fibroblast cells (L strain), the macroscopic currents well reconstitute the gating properties of i K1, including the slowing of the gating observed at depolarized levels in the presence of intracellular Mg2+, due to competitive blocking of the channel by Mg2+ (Ishihara et al., 1989; Stanfield et al., 1994; Ishihara et al., 1996). Therefore, it was worthwhile to use this channel to investigate in detail the kinetics of the outward component of the inward rectifier K+ current at a physiological low concentration of extracellular K+ without any necessity to isolate it from other ionic current systems. In this study, we show a novel time-dependent change of outward currents through the inward rectifier K+ channel observed in the presence of internal Mg2+ or Put. When the membrane potential is repolarized from depolarized levels to a level near Erev where currents still flow in the outward direction, we find that outward currents show a transient increase, which can be attributed to relief of Mg2+ (Put) block followed by re-block of channels by Spm. The blockage of the channels by Mg2+ at membrane potentials in the plateau range is thus suggested to be important for generating outward currents that repolarize the membrane during the cardiac action potential.
materials and methods
IRK1-expressing L Cells
L cell lines stably expressing the IRK1 gene (a gift from Dr. L.Y. Jan, University of California, San Francisco, CA) were established (Ishihara et al., 1996). IRK1-expressing L cells were grown in Dulbecco's modified Eagle's medium supplemented with 5% heat-inactivated fetal bovine serum. Before experiments, cells were dispersed from the culture dish by treating them with a PBS containing 0.5 mM EDTA. The spherical cells in suspension were then stored in Dulbecco's modified Eagle's medium at room temperature until they were used within 3 h.
Measurements of Currents from IRK1-expressing L Cells
Macroscopic currents were measured from whole-cell and inside-out patch membranes using the patch-clamp technique (Hamill et al., 1981) using an EPC-7 amplifier (List Electronics, Darmstadt, Germany). Patch electrodes were pulled from a Pyrex glass tube (o.d. 1.5 mm, i.d. 1.0 mm; Narishige, Tokyo, Japan) on a horizontal puller (Sutter Instruments Co., Novato, CA). The resistance of pipettes used for whole-cell recordings was 1.8–2.5 MΩ when filled with pipette solutions (see below). For recording currents from patch membranes, pipettes with large-diameter tip openings (7–10 μm) were prepared (Hilgeman, 1995), and the open-cell attached inside-out patch technique was used (Horie et al., 1987). Briefly, after a gigaohm seal was established using the large patch pipette, the cell membrane was torn using another thin glass pipette in order to expose the intracellular side of the patch membrane to the bath solution. Usually, the tip of the thin pipette was broken by crushing it against the bottom of the recording chamber, and then a large opening of cell membranes (∼5 μm in distance) was achieved by scratching the cell membrane with the broken pipette. Voltage stimulation and data acquisition were performed using pCLAMP software (ver. 6.02; Axon Instruments, Foster City, CA) on a 486 DOS/V computer (Compaq, Prolinea 4/33) through Digidata 1200A AD converter (Axon Instruments). Membrane potentials indicate transmembrane potentials at the inside of the cell membrane. In whole-cell current measurements, the liquid junction potential in pipettes was measured to be ∼−10 mV relative to the extracellular solution, and all membrane potentials were corrected for this value. All experiments were conducted at room temperature (20–22°C).
Solutions
In whole-cell experiments, the extracellular solution perfused in the bath contained (in mM), 140.0 NaCl, 5.4 KCl, 1.8 CaCl2, 0.33 NaH2PO4, 5.0 HEPES (pH 7.4 with NaOH). When extracellular K+ concentration (Ko) was increased to 15.4 mM, 10.0 mM NaCl was replaced with KCl. Unless otherwise stated, whole-cell currents were recorded at 5.4 mM Ko. The Mg2+-free pipette solution contained (in mM): 20.0 KCl, 90.0 K-aspartate, 10.0 KH2PO4, 5.0 EDTA, 1.9 K2ATP, 5.0 HEPES (pH 7.2 with KOH) Using this solution containing EDTA, intracellular free Mg2+ concentration (Mgi) is expected to be less than 10−8 M, even if the deionized water contained 10 μM of Mg2+ (Fabiato and Fabiato, 1979). To prepare pipette solutions containing either 1.1 mM or 440 μM free Mg2+, 7.9 or 7 mM MgCl2 were added to the Mg2+-free pipette solution, respectively (Fabiato and Fabiato, 1979). Put (Sigma Chemical Co., St. Louis, MO) was added to the Mg2+-free pipette solution containing 1.9 mM ATP, at 500 μM. The concentration of free Put buffered by ATP at a physiological concentration (2–3 mM, Watanabe et al., 1991) is estimated to be 330–470 μM using an apparent binding constant of 0.205–0.037 mM−1 (Miyamoto et al., 1993). The total K+ concentration in pipette solutions was ∼150 mM.
For the open-cell attached inside-out patch experiments, the pipette solution facing the extracellular side of patch membranes contained (in mM), 145.0 KCl, 1.0 CaCl2, 5.0 HEPES (pH 7.4 with KOH). To increase the current amplitude, Ko was ∼150 mM. The Mg2+-free bath solution contained (in mM) 120.0 KCl, 10.0 KH2PO4, 4.0 EDTA, 5.0 HEPES (pH 7.2 with KOH). Spm (Sigma Chemical Co.) and Put were added to this solution before use.
Data Analysis
Currents were plotted and analyzed using pCLAMP software. The horizontal dashed lines superimposed on current traces indicate the zero current level. In the present study, distribution of channels in the open state, the Spm-blocked state and the Mg2+- or the Put-blocked state was estimated based on macroscopic-current changes. Since the chord conductance of whole-cell and patch-membrane (with 1 or 10 μM internal Spm) currents reached a maximum value at a membrane potential of about 40 mV negative to Erev (Erev − 40 mV), and since the maximum conductance did not notably change subsequent to making the whole-cell patch using pipette solutions containing either Mg2+or Put, the proportions of the channels in the individual states were estimated as a value relative to the amount of the channels maximally opened at Erev − 40 mV (−120 and −90 mV at 5.4 and 15.4 mM Ko, respectively).
The proportion of the channels in the open state (PO) was estimated from the chord conductance by assuming that the unitary conductance of the channel is independent of the membrane potential. The chord conductance g was calculated by dividing the current level I with the deviation of the membrane potential V from Erev, and then it was normalized with its maximum value g max obtained at Erev − 40 mV.
 |
 |
To obtain the proportion of channels blocked by Spm (PSpm), Mg2+ (PMg), and Put (PPut), inward currents were recorded by hyperpolarizing the membrane potential from various levels to Erev − 40 mV (for patch-currents Erev − 30 mV was also used). The single exponential increase of inward currents was attributed to the relief of Spm block, based on the previous study (Ishihara et al., 1996) and the results shown in Fig. 2. The theoretical curve −A exp{−(t − k) / τ + C was fitted to time-dependent currents using the Simplex least squares fitting method, and the current levels at the onset of the voltage change, I(0), was obtained from the curve. The amplitude of the current component showing a single exponential increase, C − I(0), was used to obtain PSpm at the membrane potential that preceded hyperpolarization,
 |
Figure 2.
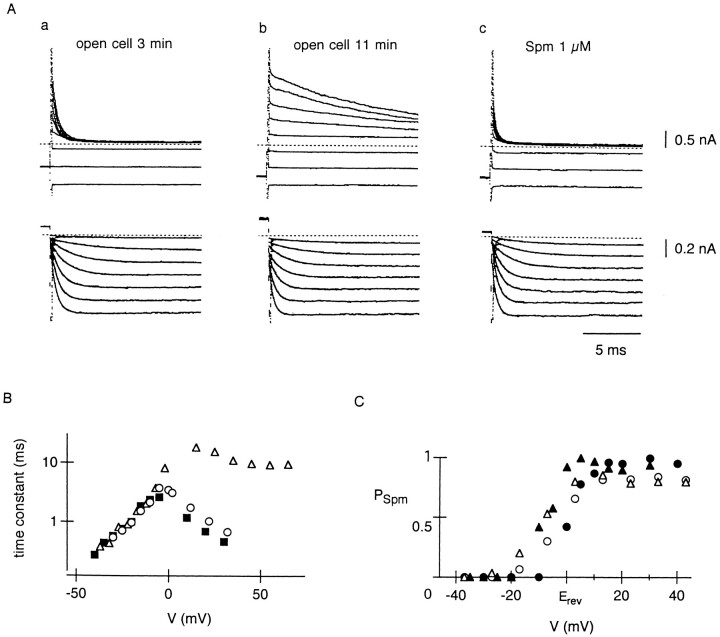
IRK1 currents measured from inside-out patch membranes with internal Spm. (A) Currents recorded from an open cell-attached inside-out patch membrane at ∼3 (a) and 11 min (b) after opening the cell to expose the intracellular side of the patch to the Mg2+-free bath solution, and at about 4 min after switching the bath solution to that containing 1 μM Spm (c). In the upper panel, voltage steps were applied from a holding potential of −40 mV (Erev − 40 mV at 150 mM Ko) to voltages between −50 and 90 mV in 20 mV increments. In the lower panel, voltage steps were applied from 40 mV (Erev + 40 mV) to voltages between −35 and −5 mV in 5 mV increments. Single exponential curves are superimposed on the currents in the lower panel. (B) Voltage dependence of the time constant of IRK1 relaxation (○, open cell 3 min; ▵, open cell 6 min; ▪, 1 μM Spm). (C) Voltage dependence of PSpm with 1 (•) or 10 μM (▴) internal Spm. PSpm was obtained at the end of 15-ms voltage steps applied from −40 mV. Mean values from two to three experiments are plotted against the deviation of the membrane potential from Erev. For comparison, PSpm estimated at 8 (▵) and 32 (○) min after starting the whole-cell recording (Fig. 1 B) is also plotted.
In the experiments performed with pipette solutions containing Mg2+ or Put, the fraction of instantaneous inward currents, which was not attributable to the opened channels in the preceding membrane potential, was assigned to the instantaneous unblock of these molecules (see discussion). As a result, PMg and PPut were estimated as:
 |
When we recorded the single-channel currents of IRK1 from L cells in the cell-attached mode, the open probability of the channels generally showed a value larger than 0.9 at 30–40 mV negative to Erev. We therefore consider that PO, PSpm, PMg, and PPut, which were all obtained as above, are close to the probability of the channel in each state.
results
Inward Rectification of Whole-cell IRK1 Without Intracellular Mg2+
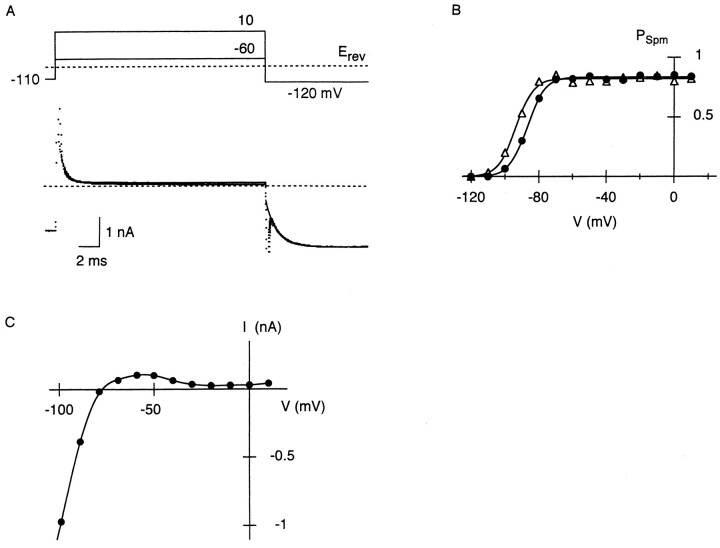
We studied the inward rectifier K+ currents through IRK1 exogenously expressed in L cells which show no measurable endogenous currents under our experimental condition (Ishihara et al., 1996). The input capacitance of the cells employed for whole-cell recordings was 26.9 ± 6.0 pF (mean ± SD, n = 27), and the steady-state current density, measured at −120 mV, 5.4 mM Ko, was 43.2 ± 14.9 pA · pF−1 (n = 27). The currents shown in Fig. 1 A were recorded using the Mg2+-free pipette solution containing 5 mM EDTA, at a time 32 min after making the whole-cell patch. When the membrane was depolarized from −110 mV where an inward current flowed, outward currents were rapidly suppressed both at −60 and 10 mV, indicating the strong inward rectification of the current without Mg2+. Subsequent hyperpolarization to −120 mV activated an inward current with a single exponential time course. This time-dependent increase of inward currents has been attributed to the activation kinetics of the inward rectifier K+ currents (Hagiwara et al., 1976; Leech and Stanfield 1981). Recently, internal polyamines were shown to block outward currents through strong inward rectifiers, and the activation of inward currents was reinterpreted as the relief of polyamine block from the channels (Ficker et al., 1994; Lopatin et al., 1994; Lopatin et al., 1995). We found that an increase in the internal Spm concentration changes the activation of whole-cell IRK1 currents in L cells, which was explicable by an increase in the closing rate of the activation gating, and this observation was considered to be evidence indicating that the “closed state” of the activation gating is the blocked state of the channel by endogenous Spm, a tetravalent polyamine (Ishihara et al., 1996). The theoretical curves superimposed on the current traces in Fig. 1 A show that the increase in inward currents started from approximately a 25% level of the maximum inward current level. According to the above notion, this observation infers that ∼75% of the channels that opened at −120 mV were in the Spm-blocked state, both at −60 and 10 mV. When the relationship between the membrane potential and PSpm was estimated from currents recorded at 8 and 32 min after starting the experiment (Fig. 1 B), the relation at 32 min was shifted in a depolarizing direction compared to that at 8 min, which most likely reflects the decrease in the internal Spm level due to washout of endogenous Spm from the cell. Even after the intracellular milieu had been exposed to the pipette solution for >30 min, however, a large fraction of channels were still blocked by Spm at potentials positive to Erev (−80 mV). In I-V relationship, outward currents are in evidence at potentials positive to Erev, with a negative slope at potentials positive to −50 mV, thus showing only a hump of outward currents (Fig. 1 C). The inward rectification of whole-cell IRK1 currents mainly caused by Spm block was generally so strong that no measurable outward currents flowed at potentials positive to −30 mV.
Figure 1.
Strong inward rectification of IRK1 without intracellular Mg2+ at 32 min after making the whole-cell patch. (A) Currents recorded by depolarizing the membrane from a holding potential of −110 mV to −60 or 10 mV for 20 ms, and then hyperpolarizing it to −120 mV. Single exponential curves with time constant 1.0 ms are superimposed on the time-dependent currents at −120 mV. (B) Proportion of Spm-blocked channels at the end of 20-ms voltage steps applied from −110 mV, plotted against the membrane potential in steps. PSpm was estimated from the amplitude of time-dependent currents during subsequent steps to −120 mV (see materials and methods for the procedure to obtain PSpm). Relations were obtained at 8 (▵) and 32 min (•) after making the whole-cell patch. Data are fitted with the Boltzmann equation, PSpm = y / {1 + exp[(−V + Vh) / s]}, where Vh (the membrane potential at PSpm reaches its half-maximal value) was −94 and −87 mV at 8 and 32 min, respectively, and s (slope factor) was −5.2 mV. (C) Isochronal I -V relation obtained at the end of 20-ms voltage steps applied from −110 mV. The relation was obtained from a series of currents recorded with those in A.
Endogenous Spm Level during Whole-cell Current Recordings
The currents shown in Fig. 2 A were recorded from a patch membrane after opening the cell to expose the intracellular side of the patch membrane to the Mg2+-free bath solution containing 4 mM EDTA. At 3 min after opening the cell (Fig. 2 Aa), outward currents decreased rapidly on voltage steps to potentials positive to Erev (0 mV), and inward currents increased with an exponential time course during steps to potentials negative to Erev, similar to the whole-cell currents at Mgi free (Fig. 1 A). Although the decrease in outward currents became progressively slower after opening the cell as previously shown using excised patch membranes (Ficker et al., 1994; Lopatin et al., 1994), the time course of inward currents did not change (Figs. 2 Ab and B). When 1 μM Spm was added to the bath solution after the decrease in outward currents had obviously slowed, the decrease became rapid without affecting the time course of inward currents (Fig. 2 Ac and B). These observations show that the “closing process” of the activation gating slows after opening the cell, and that the increase in the internal Spm concentration restores the speed of the closing process, supporting that Spm block “closes” the activation gate, and that the time-dependent increase of inward currents under the whole-cell voltage clamp condition (Fig. 1 A) reflects the relief of Spm block (see discussion).
With 1 μM internal Spm, PSpm, estimated from the amplitude of time-dependent inward currents, steeply increased at potentials around Erev (Fig. 2 C). With 10 μM Spm, the increase in PSpm occurred at more negative membrane potentials (Fig. 2 C). When the voltage dependence of PSpm obtained from whole-cell currents (Fig. 1 B) was plotted against the deviation of the membrane potential from Erev, these relationships were found to be similar to those of the patch currents (Fig. 2 C). We thus speculate the concentration of endogenous free Spm left in cells during whole-cell recordings to be around 1–10 μM.
Inward Rectification of Whole-cell IRK1 with Internal Divalent Cations
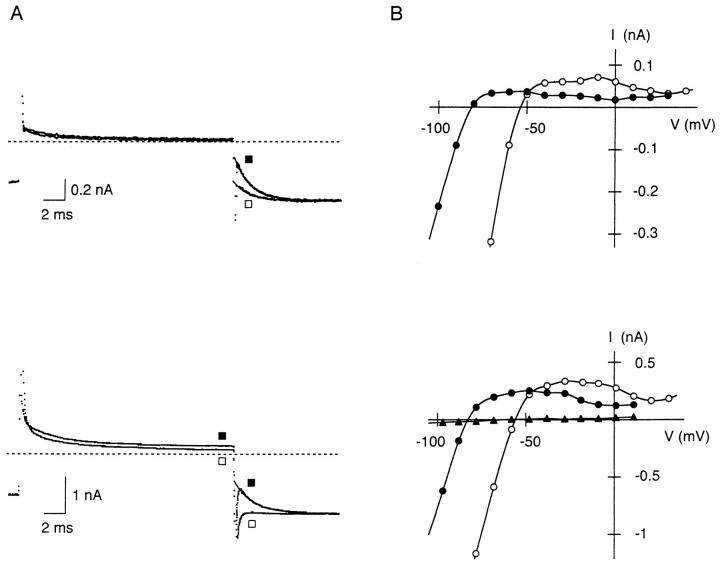
In the following sections, we show the results obtained from whole-cell currents recorded in the presence of internal Mg2+ or Put. When the membrane was depolarized in the presence of 1.1 mM Mgi, outward currents were rapidly suppressed, and remaining current components further decayed with a slow time course (Fig. 3 A, top). Although the outward-current levels at the end of 20-ms depolarizing steps to −60 and 10 mV were small (as they were in the absence of Mgi, Fig. 1 A), currents in the subsequent hyperpolarization to −120 mV were different: exponential increase in the inward current started from 24% of the maximum inward current on hyperpolarization from −60 mV, whereas the current increased exponentially from 67% of the maximum with the same time constant on hyperpolarization from 10 mV. As an increase in Mgi increases the fraction of nonconductive channels which instantaneously activates on hyperpolarization, these observations infer that the number of Spm-blocked channels decreased, while the number of Mg2+-blocked channels increased, by depolarizing to 10 mV, rather than to −60 mV (Ishihara et al., 1989, 1996). The lower panel of Fig. 3 A shows a similar effect caused by 500 μM internal Put. During the steps to both −60 and 10 mV, sizable outward currents remained after the rapid suppression of the currents, and then decayed slowly. At the end of the steps, the outward current at 10 mV was even smaller than that at −60 mV. However, the current observed in the subsequent step from −60 to −120 mV showed a time-dependent activation whereas that from 10 to −120 mV showed an instantaneous activation. These observations indicate that internal Put blocked the channels at the end of the step at 10 mV and that the relief of Put block is also virtually instantaneous (Lopatin et al., 1995; Ishihara et al., 1996).
Figure 3.
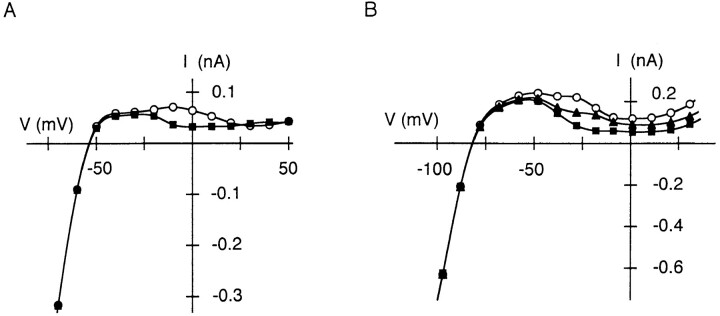
Inward rectification of whole-cell IRK1 in the presence of internal Mg2+ (1.1 mM; top) or Put (500 μM; bottom). (A) Representative currents recorded as those in Fig. 1 A. Note that the currents observed on hyperpolarization from −60 mV (▪) and 10 mV (□) are different. The time constant of the exponential curves superimposed on the time-dependent inward currents was 1.5 and 1.7 ms in the upper and the lower panel, respectively. (B) Isochronal I-V relations obtained at the end of 20-ms voltage steps applied from −110 and −80 mV at 5.4 mM (•) and 15.4 mM Ko (○), respectively. Currents measured with 0.5 mM BaCl2 in the external solution (▴) are also plotted in the lower panel.
From families of currents recorded together with those shown in Fig. 3 A, I-V relations at the end of voltage steps were obtained (Fig. 3 B). With either internal Mg2+ or Put, outward currents flowed over a wider range of potentials compared with those measured in the absence of these cations (Fig. 1 C), and a second hump in the outward I-V relations is apparent at potentials between −40 and 0 mV. Outward currents were suppressed by application of 0.5 mM BaCl2 to the extracellular solution (Fig. 3 B, bottom). When Ko was increased to 15.4 mM, outward I-V relations showing two humps shifted in a depolarizing direction according to the shift in Erev (Fig. 3 B), and the relations obtained at two different Ko showed a “cross-over” that is known to be characteristic of the inward rectifier K+ current, which results from the apparent dependence of rectification on the electrochemical potential gradient of K+ (Noble, 1965). These findings indicate that the outward currents flow through the inward rectifier IRK1. The presence of either internal Mg2+ or Put appeared to increase the flow of outward currents.
Distribution of Channels in the Mg2+-blocked State Increases Amplitude of Outward Currents
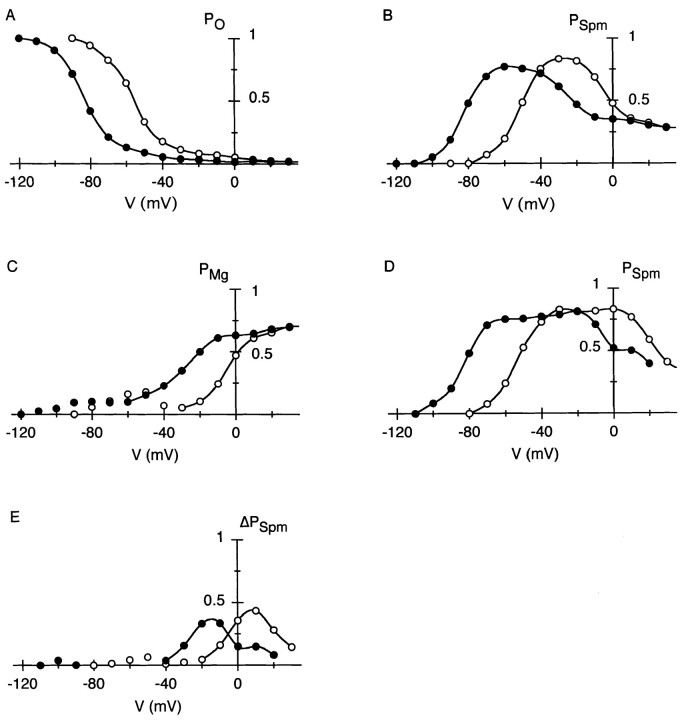
From I-V relations obtained with Mg2+ (Fig. 3 B, top), the voltage dependence of PO at the end of 20-ms voltage steps was obtained (Fig. 4 A). PSpm and PMg at the end of the voltage steps, estimated based on the currents in the following hyperpolarization, are shown in Fig. 4, B and C, respectively. PSpm steeply increased at potentials around Erev (−82 and −54 mV at 5.4 and 15.4 mM Ko, respectively), but decreased at more depolarized potentials. PMg increased in a voltage-dependent manner at potentials positive to Erev + 20 mV at both Ko, as denoted by continuous curves. These plots indicate that distribution of channels in the individual states apparently depends on Ko. From these plots, it is suggested that the increase in the fraction of channels blocked by Mg2+ (Fig. 4 C) increases the amplitude of outward currents at positive membrane potentials (Fig. 3 B).
Figure 4.
Voltage-dependent distribution of the IRK1 channels in the open state, the endogenous-Spm blocked state and the Mg2+-blocked state under the whole-cell voltage clamp condition with 1.1 mM Mgi. PO, PSpm, and PMg were estimated at the end of voltage steps applied from −110 and −80 mV at 5.4 (•) and 15.4 (○) mM Ko, respectively (see materials and methods for procedures to obtain PO, PSpm, and PMg). (A) Voltage dependence of PO at the end of 20-ms voltage steps. (B) Voltage dependence of PSpm at the end of 20-ms voltage steps. (C) Voltage dependence of PMg at the end of 20-ms voltage steps. The voltage-dependent increase in PMg is designated by continuous curves. (D) Voltage dependence of PSpm at the end of 500-ms voltage steps. (E) Change in PSpm (ΔPSpm) while extending voltage steps from 20 to 500 ms. Values were obtained by subtracting PSpm in B from that in D at each membrane potential. All negative values (>−0.04) are omitted. The increase in PSpm is designated by curves.
The voltage-dependent distribution of channels in the Spm- and the Mg2+-blocked states (Fig. 4, B and C) can be explained by the following simplified kinetic model based on the study of i K1 (Ishihara et al., 1989), by replacing the closed state of i K1 channel with the Spm-blocked state:
 |
where β and μ are the block rates (M−1 · S−1) that are the function of the concentration of Spm and Mg2+, respectively, and α and λ are the unblock rates (S−1). It is inferred from the plots that channels were distributed from the open state to the Mg2+-blocked state at potentials far positive to Erev by the larger μ compared with β. We previously showed, however, that Mg2+ block and Put block are replaced by Spm block during extended depolarization (Ishihara et al., 1996). The simulation of the same phenomenon, i.e., redistribution of the Mg2+ blocked state to the closed state of i K1 channel (Ishihara et al., 1989) suggests that the channels transiting frequently between the Mg2+-blocked state and the open state are gradually trapped in the Spm-blocked state because of the small α that gives Spm a high affinity with the channel. Fig. 4 D shows PSpm obtained at the end of 500-ms voltage steps. The amount of PSpm that increased at each membrane potential by extending voltage steps from 20 to 500 ms is plotted in Fig. 4 E. For example, at 15.4 mM Ko, the increase in PSpm is conspicuous at potentials between −20 and 20 mV. Concomitantly, outward currents at corresponding potentials decreased by extending voltage steps from 20 to 500 ms (Fig. 5 A), which resulted in a disappearance of the second hump in the outward I-V relation. These observations show that replacement of Mg2+ block by Spm block during extended depolarization decreases the amplitude of outward currents, and indicate that blockage of channels by Mg2+ facilitates the flow of outward currents. In the experiment performed with internal Put, outward currents generating the second hump in the outward I-V (Fig. 3 B, bottom) were also decreased by extending depolarizing steps (Fig. 5 B) due to the replacement of Put block by Spm block (data not shown).
Figure 5.
Changes in the outward I-V relation of whole-cell IRK1 while extending the duration of voltage steps in the presence of internal Mg2+ or Put. (A) I-V relations obtained at the end of 20-ms (○) and 500-ms (▪) voltage steps applied from −80 mV at 15.4 mM Ko, 1.1 mM Mgi. (B) I-V relations obtained with 500 μM internal Put at the end of 20-ms (○), 50-ms (▴), and 500-ms (▪) voltage steps from −110 mV at 5.4 mM Ko.
Increase in Spm-blocked Channels at the Holding Potential Decreases Mg2+-blocked Channels during Depolarization
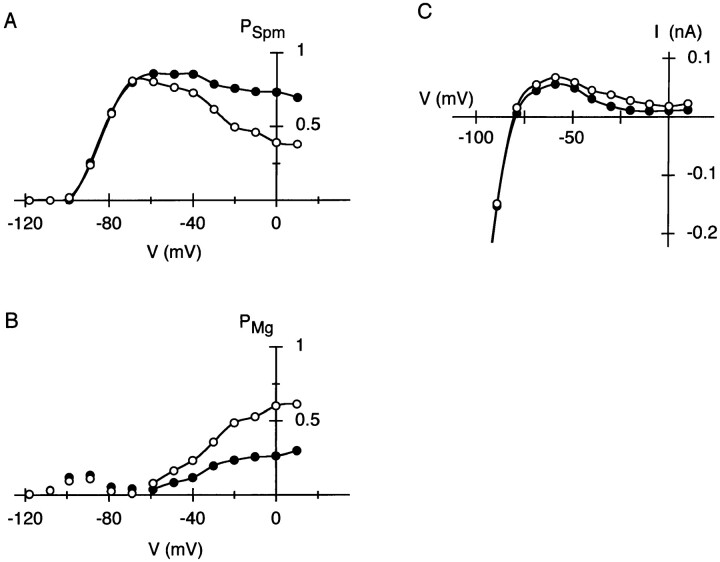
If Mg2+ block is to be replaced by Spm block during depolarization, a shift of the holding potential in a depolarizing direction, which increases PSpm at the onset of depolarization, should decrease the channels to be blocked by Mg2+ on depolarization. Fig. 6 shows such an experiment conducted at 440 μM Mgi: the membrane potential preceding voltage steps was shifted from −110 to −80 mV, a level near Erev, where approximately half of channels resided in the Spm-blocked state (Fig. 6 A). Confirming the above notion, PSpm increased (Fig. 6 A) and PMg decreased (Fig. 6 B) at potentials positive to −60 mV. Consequently, outward currents decreased at potentials between −40 and 0 mV (Fig. 6 C). This finding indicates that a change in the number of the Spm-blocked channels at the resting potential will alter the number of channels blocked by weak blocking molecules upon depolarization.
Figure 6.
Effects of the holding potential on PSpm (A), PMg (B), and the outward-current amplitude (C) at the end of 25-ms voltage steps examined at 440 μM Mgi. Holding potentials were −110 (○) and −80 mV (•). Values are plotted against the membrane potential in voltage steps. All data were obtained from currents recorded within 1 min.
Transient Increase in Outward Currents Observed on Repolarization
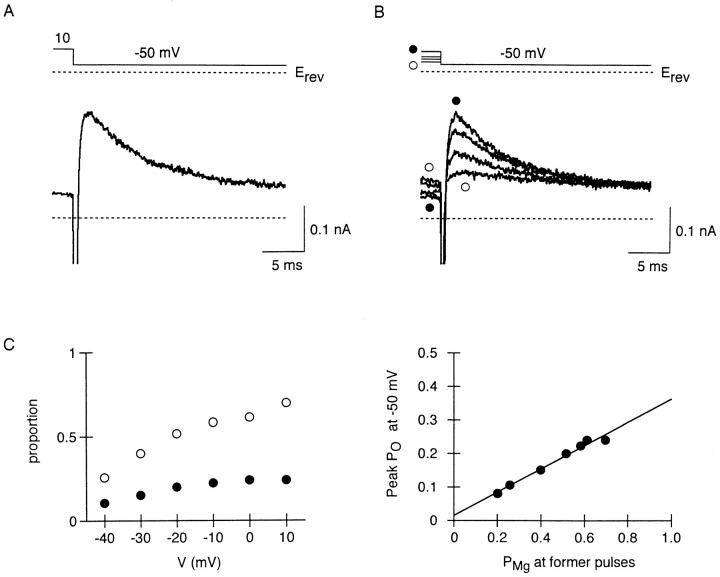
With Mg2+, as the membrane potential in voltage steps was more depolarized, the number of Mg2+-blocked channels at the beginning of the steps became larger, and thereafter the speed of replacement became slower, both in IRK1 and i K1 (Ishihara et al., 1989, 1996). Therefore, PMg remains large during depolarization at potentials positive to 0 mV, near the action potential plateau (e.g., Fig. 4). We next show the influence of Mg2+-blocked channels at depolarized potentials on outward currents which flow upon repolarization. Fig. 7 A shows a representative current observed in response to repolarization at 440 μM Mgi. When the membrane potential was stepped from 10 to −50 mV, a transient outward current was elicited after the inward capacitive current: the outward current increased rapidly, and then decreased with a slower time course. Before repolarization, the membrane was briefly depolarized from −120 to 10 mV, and PMg estimated at the end of the step at 10 mV was 0.7. Since the relative potency of Spm block versus Mg2+ block is stronger at −50 mV than at 10 mV (Fig. 4), Mg2+ block is expected to be substituted with Spm block during the repolarizing step at −50 mV. If this kinetic occurs through the open state, then the larger the number of Mg2+-blocked channels are, the more channels will reside in the open state before passing into the Spm-blocked state, thereby transiently increasing the outward-current amplitude.
Figure 7.
Transient increase in whole-cell outward currents observed on repolarization at 440 μM Mgi. (A) Time-dependent outward current elicited on repolarization from 10 to −50 mV. Before repolarization, the membrane was depolarized from −120 to 10 mV for 25 ms. (B) Outward currents recorded on repolarization to −50 mV, after 25-ms depolarization at 0 (•), −20, −30, and −40 mV (○). (C) Relationship between the membrane potential in depolarizing steps and peak amplitude of outward currents in the following step at −50 mV. Peak amplitude is expressed as PO (•). PMg at the end of the depolarizing steps were estimated from inward currents in the subsequent steps to −120 mV (○). All data were obtained from currents successively recorded within 2 min. (D) Relationship between PMg at the end of depolarization and the peak PO during the following repolarization. The line was fitted by the least squares method.
As the membrane potential in the preceding depolarization was made more negative, the peak amplitude of the outward current at −50 mV became smaller (Fig. 7 B). In Fig. 7 C, the peak-current amplitude at −50 mV, expressed as PO, is plotted against the membrane potential in the preceding steps. For comparison, PMg at the end of the preceding steps is also plotted. When the relationship between these two values was examined (Fig. 7 D), they were well fitted by a straight line, indicating that the amplitude of the transient outward current is closely related to the number of Mg2+-blocked channels at the preceding potential. We therefore consider that fast relief of Mg2+ block increases outward currents, while subsequent block by Spm reduces the currents.
Factors that Change the Amplitude of Transient Outward Currents
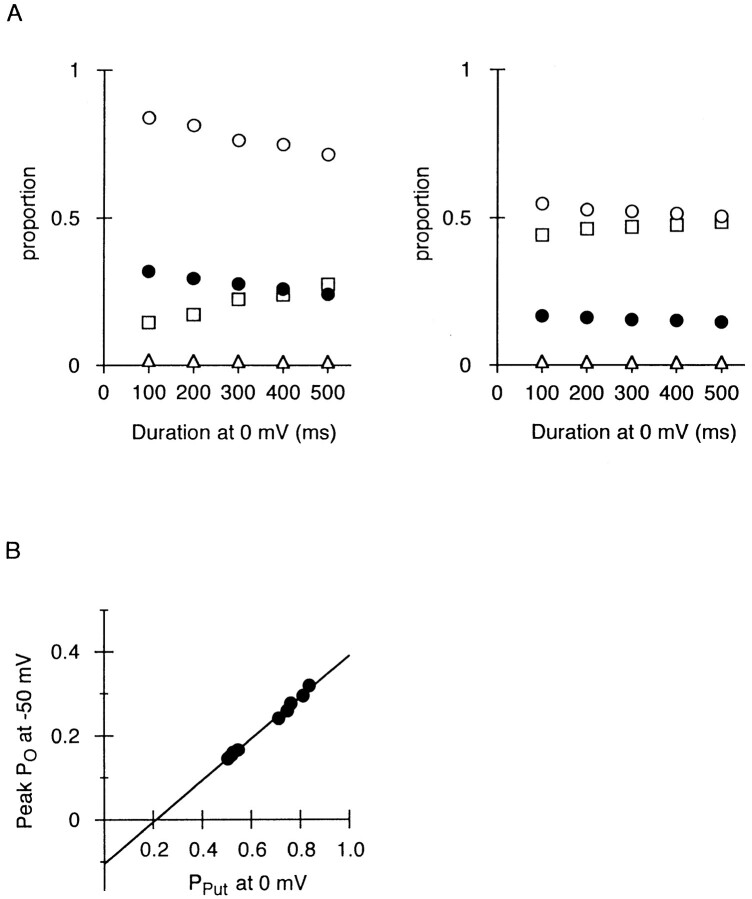
Transient increase in outward currents also appeared when the pipette solution contained 500 μM Put. Fig. 8 illustrates the factors that affected the amplitude of transient outward currents. In Fig. 8 A, currents were recorded by depolarizing the membrane from −120 to 0 mV for various durations (100–500 ms), followed by repolarization to −50 mV. Upon repolarization to −50 mV, outward currents increased rapidly after inward capacitive transients, and then decreased with a slower time course to levels which are larger than those at 0 mV due to the negative slope conductance of the current. Prolongation of the depolarizing step at 0 mV reduced the amplitude of the transient outward current during the following repolarizing step at −50 mV. Elevation of the holding potential from −120 to −80 mV also decreased the size of transient outward currents (Fig. 8 B). When neither Mg2+ nor Put was added to the pipette solution, there was no transient increase in outward currents on repolarization (Fig. 8 C).
Figure 8.
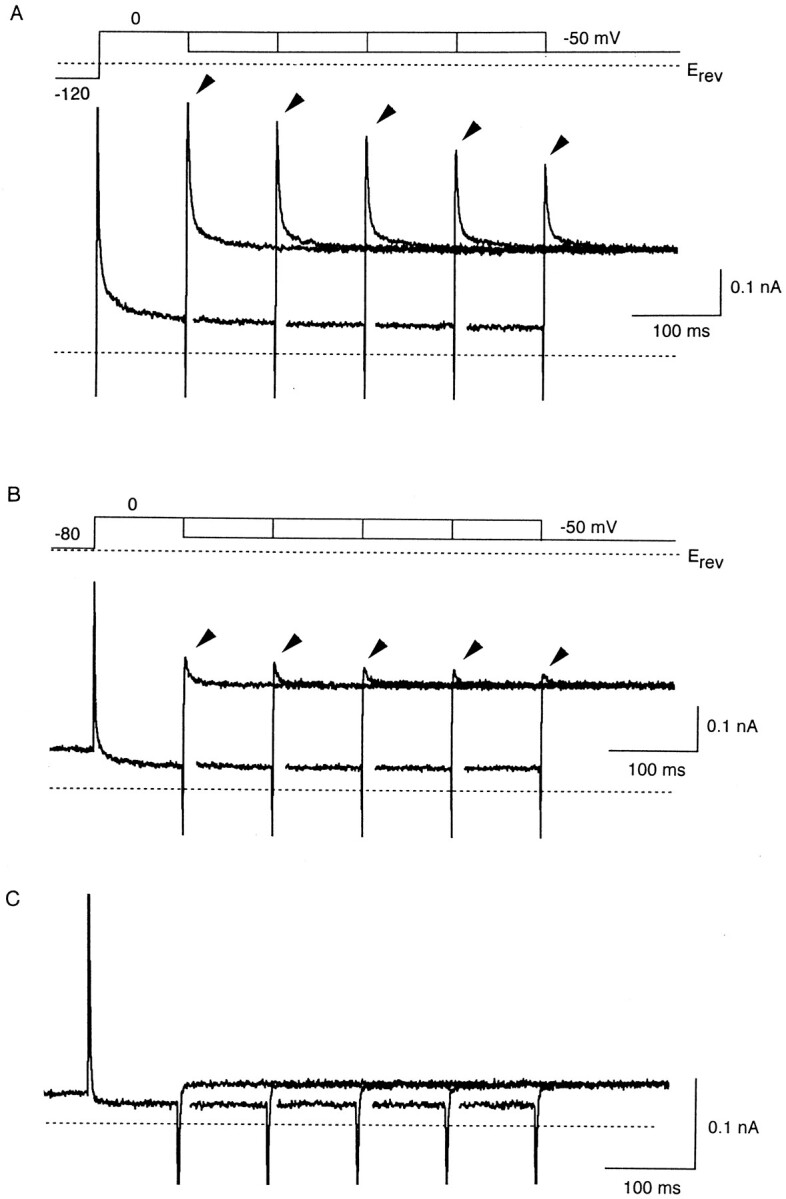
Factors that changed the amplitude of transient outward currents elicited on repolarization in the presence of 500 μM internal Put. (A) Currents recorded by depolarizing the membrane from a holding potential of −120 mV to 0 mV for various durations (from 100 to 500 ms by 100-ms increment), and then repolarizing it to −50 mV. The inward capacitive currents and the transient increase in the outward currents (arrows) observed on the step to −50 mV are superimposed. The inward current at the holding potential (−120 mV) does not appear in the trace. (B) Currents recorded as those in A with a holding potential of −80 mV. Currents in A and B were obtained from the same cell. (C) Currents recorded as in B using the pipette solution containing neither Mg2+ nor Put. No transient increase is observed in the outward currents on repolarization to −50 mV.
From the currents shown in Fig. 8, A and B, the peak amplitude of transient outward currents during repolarization, expressed as PO, is plotted against the duration of the preceding depolarizing steps (Fig. 9 A). PSpm, PO, and PPut at the end of the depolarizing steps are also shown. The decrease in the amplitude of transient outward currents, which occurred along with prolongation of the depolarization (Fig. 8 A), and with elevation of the holding potential (Fig. 8 B), was concurrent with the increase in PSpm and the decrease in PPut at the end of the preceding depolarizing steps. As shown in Fig. 9 B, the peak value of PO at −50 mV was proportional to PPut at the end of the preceding steps at 0 mV, strongly suggesting that rapid relief of Put block instantaneously increases outward currents upon repolarization.
Figure 9.
Amplitude of transient outward currents depends on the number of Put-blocked channels in the preceding depolarization. (A) Relationship between the duration of depolarizations at 0 mV and the peak amplitude of outward currents in the following repolarization at −50 mV, expressed as PO (•). The relations obtained from the currents in Fig. 8, A and B, are shown in the left and the right panels, respectively. PPut (○), PO (▵), and PSpm (□) at the end of 0-mV depolarizations were obtained from the current changes upon hyperpolarization to −120 mV. All data were obtained from currents successively recorded within 3 min. (B) Relationship between PPut at the end of 0-mV depolarizations and the peak PO at −50 mV. The data are the same as those shown in Fig. 9 A. The line was fitted by the least squares method.
Inside-out Patch-currents with Internal Spm and Put
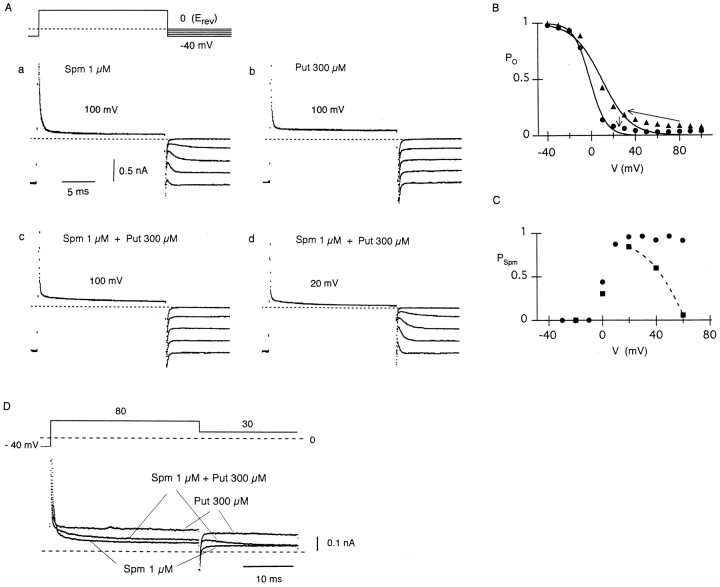
Based on the data shown in Fig. 2 C, the internal free Spm concentration during whole-cell recordings was estimated to be around 1–10 μM. With 10 μm Spm, however, most of the channels were in the Spm-blocked state at potentials around Erev (Fig. 2 C), and the amplitude of outward currents was trivial. We thus tested whether or not a combination of 1 μM Spm and 300 μM Put applied to the intracellular side of the patch membranes can reproduce the observations in whole-cell currents. With 1 μM Spm alone, suppression of outward currents was rapid when the membrane potential was stepped from −40 to 100 mV (note that Erev is 0 mV with 150 mM Ko in patch-current measurements, whereas it is about −80 mV with 5.4 mM Ko in whole-cell recordings), and the activation of inward currents showed an exponential time course in the following steps to <0 mV (Fig. 10 Aa). With 300 μM Put alone, the outward-current level at 100 mV was slightly larger than that with 1 μM Spm, and the activation of inward currents was apparently instantaneous (Fig. 10 Ab). These observations are in good agreement with the notion that the relief of Spm block is time-dependent whereas that of Put block is virtually instantaneous. Fig. 10 B shows the voltage dependence of PO obtained with either 1 μM Spm or 300 μM Put. The rectification caused by Spm block was steeper than that caused by Put block, correlating to the number of protonated sites in each polyamine (Lopatin et al., 1995). It is noticed from these relations that PO with 300 μM Put was significantly larger than that with 1 μM Spm at potentials between 0 and 40 mV.
Figure 10.
IRK1 currents measured from an inside-out patch membrane with internal Spm and Put. (A) Families of currents recorded with 1 μM Spm (a), 300 μM Put (b), or both (c and d). The membrane potential was stepped from −40 mV (Erev − 40 mV at 150 mM Ko) to a level indicated in each panel for 17 ms, and then stepped to voltages between −40 and 0 mV in 10-mV increments. (B) Voltage dependence of PO with 1 μM Spm (•) or 300 μM Put (▴). PO was estimated at the end of 15-ms voltage steps applied from −40 mV. Data are fitted with the Boltzmann equation using PO = 1 / {1 + exp((-V + Vh) / s)}, where Vh (the membrane potential at PO decreases to its half-maximal value) was −1.3 and 9.5 mV, s was −7.2 and −13.0 mV with Spm and Put, respectively. (C) Voltage dependence of PSpm in the presence of 1 μM Spm (•) or 1 μM Spm and 300 μM Put (▪). The decrease in PSpm in the presence of Put is designated by a dashed curve. (D) Currents recorded using the pulse protocol at the top. Currents were recorded in the presence of 1 μM Spm, 300 μM Put, or both.
When both 1 μM Spm and 300 μM Put were applied together, outward currents were mostly blocked by Put at 100 mV, but by Spm at 20 mV, judging from the time course of inward currents during the following steps to <0 mV (Fig. 10, Ac and Ad). The voltage dependence of PSpm (Fig. 10 C) indicates that the contribution of Put block increased at potentials positive to 40 mV at the expense of PSpm, similar to the observation in whole-cell currents (Fig. 4). When a negative step pulse was applied from 80 to 30 mV (Fig. 10 D), a transient component was present in the outward current at 30 mV, which was not observed with Spm alone. This phenomenon might be explained as indicated by the arrows in Fig. 10 B; it is expected that a fraction of channels blocked by Put at 80 mV will decrease in size at 30 mV to a level determined by the kinetics of Put block, and thereby increase PO. Thereafter PO will decrease to a level determined by the kinetics of Spm block. Since the peak outward-current at 30 mV observed with both Spm and Put was smaller than the current level with Put alone, the fast occurrence of Spm re-block probably decreases the maximum-current level (Fig. 10 D).
I-V Relationships Obtained with a Repolarizing Ramp in the Presence of Mgi
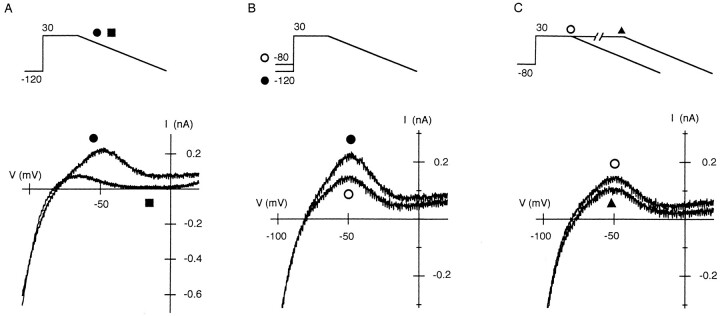
In the repolarizing phase of the action potential, the membrane potential successively changes while the net current flows in the outward direction. Thus, we obtained the outward I-V relation from whole cells using a repolarizing ramp pulse. As shown in Fig. 11 A, the outward current measured with 440 μM Mgi was significantly larger than that measured at Mgi free. With Mg2+, the outward current was prominent at potentials around −50 mV. Without Mg2+, only a small outward current flowed at potentials negative to −40 mV, which was comparable to the levels measured using depolarizing steps (Fig. 1). At 440 μM Mgi, a shift in the holding potential from −120 to −80 mV reduced the outward current at potentials around −50 mV (Fig. 11 B), and the prolongation of the preceding depolarization further reduced it (Fig. 11 C).
Figure 11.
Outward I-V relations of whole-cell IRK1 measured using a repolarizing ramp pulse (−3 V/s) at 440 μM Mgi. (A) I-V relations obtained using the repolarizing ramp following a 20-ms depolarization to 30 mV from a holding potential of −120 mV. Relations were obtained at 440 μM Mgi (•) and at Mgi free (▪) from different cells (the current level at Mgi free is multiplied by 1.5). (B) Effects of the holding potential on the outward I-V relation during the repolarizing ramp. The holding potentials were −120 (•) and −80 mV (○). Ramp pulses were applied following a 20-ms depolarization at 30 mV. (C) Effects of the duration of preceding depolarization (30 mV) on the outward I-V relation during the repolarizing ramp. Duration of depolarizations were 20 (○) and 500 ms (▴). The holding potential was −80 mV. Current levels measured using a ramp pulse are compensated for Cm · dV/dt (−0.068 nA for currents at 440 μM Mgi, and −0.075 nA for that at Mgi free). All currents except for that obtained at Mgi free were recorded within 2 min.
discussion
In the present study, we added Mg2+ or Put, the relatively weak blocking molecules of the strong inward rectifier IRK1, to the intracellular milieu where endogenous Spm remained, and then studied outward currents through IRK1 at 5.4 mM Ko. Mg2+ (440 μM or 1.1 mM) or Put (∼400 μM in free form), used within physiological Mgi (Murphy et al., 1991), contributed to blocking IRK1 during large depolarizing steps. Subsequent repolarizing steps to a level where currents still flow in the outward direction elicited a transient increase in outward currents, which was attributed to the relief of Mg2+ or Put block followed by a re-block of channels by Spm. When 300 μM Put was applied to the intracellular side of the patch membrane with 1 μM Spm (an estimated endogenous free Spm level during whole-cell recordings), the results obtained from whole-cell currents were reproduced. The findings in the present study indicate that blockage of the inward rectifier K+ channel by molecules with distinct affinities, i.e., Spm and Mg2+ (or Put), can elicit a time-dependent change in outward currents.
Inward Rectification of Whole-cell IRK1 Caused by Endogenous Polyamines
Without Mg2+, the strong inward rectification of whole-cell IRK1 in L cells was mainly determined by the
closed state that shows an exponential activation on hyperpolarization (Fig. 1), similar to native strong inward
rectifiers (Ishihara et al., 1989; Silver and DeCoursey,
1990). In the previous study (Ishihara et al., 1996), we
attributed this closed state to the state of the channel
blocked by endogenous Spm according to the findings
that (a) an increase in the internal Spm concentration
shifted the voltage dependence of the activation curve
in a hyperpolarizing direction and changed the time
constant of the activation process, which were both explained by an increase in the closing rate of the activation gating, and (b) an increase in the concentration of
other naturally occurring polyamines (Spd and Put) increased the fraction of nonconductive channels which
open faster than the activation process on hyperpolarization. In this study, the results obtained from inside-out patch-currents (Fig. 2, A and B) were also compatible with the idea that closed state is caused by Spm
block of the channel. That is, when we consider the following simple kinetic model,

where k (M−1 · S−1) and k −1 (S−1) are the voltage-dependent block and unblock rates of molecule X, the slowing of relaxation, 1 / (k + k −1), at potentials positive to Erev after opening the cell (Fig. 2 Ab) can be explained by a decrease in the concentration-dependent k due to the washout of molecule X. In this case, relaxation is not necessarily affected at potentials negative to Erev where k −1 is significantly larger than k (Ishihara et al., 1996). The currents recorded with 1 μM Spm (Fig. 2 Ac) infer that unblock rate from the Spm-blocked state is the same as k −1, strongly suggesting that Spm is the molecule X that is acting as a gating charge to cause the closed state of the activation gating (Lopatin et al., 1995).
Even when the pipette solution contained EDTA to eliminate Mgi, ∼20% of the channels apparently showed an instantaneous activation on hyperpolarization (e.g., Fig. 1), similar to the observation in native inward rectifier channels (e.g., Silver and DeCoursey, 1990). Since the concentration of total Put has been reported to be much lower than that of Spm or Spd in mammalian tissues (Pegg and McCann, 1982), this component may reflect rapid relief of endogenous-Spd block (with much higher affinity for IRK1 than Mg2+ or Put; Yang et al., 1995) rather than that of endogenous-Put block. In fact, it was shown for the HRK1 channel expressed in Xenopus oocytes (stages V-VI) that Spd contributes to blocking the channel together with Spm (Lopatin et al., 1995). In experiments performed with either internal Mg2+ or Put, we obtained PMg or PPut from the fraction of channels that open instantaneously on hyperpolarization. For the above reason, however, it is possible that the fraction of channels blocked by endogenous Spd contaminated the values PMg and PPut, by less than 0.2. However, outward currents at potentials >−40 mV (Fig. 3 B), and transient outward currents during repolarizing steps (Figs. 7 and 8), appeared only when PMg or PPut substantially increased at depolarized levels by adding Mg2+ or Put to pipette solutions, respectively (Figs. 4, 7, and 9), indicating that these current changes were caused by the effects of internal Mg2+ and Put (cf., Figs. 1 and 8 C).
Blockage of IRK1 by Mg2+ or Put in the Presence of Spm
During prolonged whole-cell experiments, the current changes caused by the effects of internal Mg2+ and Put became more prominent as PMg or PPut gradually increased (data not shown). Since we always analyzed currents recorded within a short period of time (1–3 min), the influence of this time course on our findings appeared to be minimal. As a decrease in the endogenous Spm level was implied from the shift in the voltage dependence of PSpm during experiments (Fig. 1 B), the above observation is consistent with the kinetic scheme that Spm and Mg2+ (Put) compete to block IRK1. The currents recorded from cell-attached inside-out patch membranes (Fig. 2 C) suggested that the concentration of endogenous free Spm decreased from ∼10 μM to ∼1 μM during whole-cell recordings. When both 1 μM Spm and 300 μM Put (an amount close to what we used in whole-cell experiments) were added to the solution facing the intracellular side of patch membranes, Put contributed to blocking channels at positive potentials, and the findings in whole-cell currents were reproduced (Fig. 10). When a combination of 10 μM Spm and 300 μM Put was tested, outward currents were negligible due to Spm block (Fig. 2 C), and the contribution of Put block was insignificant (data not shown), which is also compatible with the competitive access of Spm and Put to IRK1.
Although the internal free Spm levels at 1–10 μM is similar to those reported in mammalian cells (Watanabe et al., 1991), our whole-cell data were obtained after part of the endogenous Spm had been washed out from L cells. However, we speculate such a Spm level might be close to that found in cardiac myocytes, since the outward i K1 currents are usually prominent (e.g., Shimoni et al., 1992). Polyamine levels vary among different cell types since it is related to cell growth (Pegg and McCann, 1982). Thus, it may be necessary to examine the content of polyamines in the cells expressing the inward rectifiers to determine the function of the channel. In the following sections we discuss the effects of Mg2+ block of the inward rectifier K+ channel on the cardiac action potential based on our results, as they were observed at physiological Mgi.
Paradoxical Increase in the Outward-current Amplitude due to Mg2+ Block
Mgi at 0.44-1.1 mM blocked IRK1 in the presence of endogenous Spm, when large depolarizing steps were applied from a hyperpolarized level where most of the channels are in the open state (Fig. 4), same as the observation in i K1 currents (Ishihara et al., 1989). We showed in this paper that the contribution of Mg2+ to blocking IRK1 facilitate the flow of outward currents (Figs. 3–5). This is an interesting phenomenon since endogenous-Spm block can cause a stronger rectification of currents when there is less contribution of Mg2+ block (Figs. 1 and 5). The increase in open probability caused by Mg2+ block might be explained by the finding that i K1 channels can be trapped frequently in partially conducting states by Mg2+ block, which interferes with the long closure of the channel (Matsuda, 1988). The outward-current component with two humps (Fig. 3 B) was also noticed in I-V relations of i K1 in guinea-pig ventricular cells at 0.5–3 mM Mgi (unpublished observation), and this kind of I-V relation is predicted by a kinetic model with partially conducting states (Ishihara et al., 1989; Oliva et al., 1990). We still do not know whether Mg2+ block induces subconductance levels in IRK1 or not, and this point needs to be further clarified. The outward currents increased by Mg2+ block may be important not only for the repolarization phase but also in respect to the influence on the plateau phase of the cardiac action potential. For example, the increase in Ko to 15.4 mM, which shifts I-V relation in a depolarizing direction by about 30 mV, readily increases outward currents during short voltage steps to >0 mV (Fig. 3 B). Outward i K1 currents mediated by Mg2+ block may contribute to shortening the action potential at an elevated Ko (Noble, 1965).
Outward Currents during Repolarization Increased by Relief of Mg2+ Block
We found that transient increase appears in outward IRK1 currents during a repolarizing step pulse in the presence of Mgi (Fig. 7). This current change was attributed to the rapid relief of Mg2+ block, followed by a re-block of channels by Spm. The relatively slow decrease of outward currents infers that the remaining Mg2+ block interfered with the time course of Spm block at the repolarized level, the same as the currents in depolarization (Fig. 3 A). The current change is similar to the rapidly activating delayed rectifier K+ current, iKr, in pace-maker and ventricular cells, as fast recovery from inactivation instantaneously increases outward i Kr on repolarization, and then proceeds to time-dependent deactivation (Shibasaki, 1987; Sanguinetti and Jurkiewicz, 1990; Ito and Ono, 1995; Smith et al., 1996). Outward i K1 currents increased by the relief of Mg2+ block (Fig. 11) may contribute to repolarization of the cardiac action potential together with i Kr.
The replacement of Mg2+ block by Spm block, which gradually occurs during depolarization (Ishihara et al., 1989, 1996), decreased the flow of outward IRK1 currents during repolarization (Figs. 8 and 11). An increase in the number of Spm-blocked channels at the holding level also decreased the number of Mg2+-blocked channels in depolarization (Fig. 6), which in turn decreased the outward IRK1 during repolarization (Figs. 8 and 11). These results suggest that a prolongation of the action potential or a small depolarization in the resting potential may affect the repolarization phase of the cardiac action potential by reducing the fraction of the Mg2+-blocked inward rectifier K+ channels during the action potential plateau. As repolarization of the cardiac action potential occurs by a small net outward current, the relevance of this phenomenon to the early after-depolarization needs to be further investigated.
Our study suggests that a change in the concentration intracellular polyamines and Mg2+ affects the cardiac action potential by changing i K1 currents (see also Nichols et al., 1996). Therefore, regulating mechanisms of intracellular Mg2+ (Murphy et al., 1991) and polyamines (Pegg and McCann, 1982) may play an important role in cardiac function.
Acknowledgments
This work was supported by the Grant-in-Aid for Scientific Research on Priority Areas of “Channel-Transporter Correlation” from the Ministry of Education, Science and Culture of Japan.
Footnotes
I thank Prof. R. Ochi for his support in the earlier part of this work. I also thank Prof. T. Ehara and Drs. K. Igarashi, K. Ono, and Y. Yanagi for useful discussions, Dr. S. Matsuoka for his advise on the giant-patch method, Dr. B. Quinn for reading the manuscript, and Ms. M. Fuchigami for her secretarial assistance.
Abbreviations used in this paper: Erev, the reversal potential; Ko, extracellular K+ concentration; Mgi, intracellular Mg2+ concentration; PO, the proportion of the channels in the open state; PPut, the proportion of the channels blocked by putrescine; PMg, the proportion of the channels blocked by Mg2+; PSpm, the proportion of the channels blocked by spermine; Put, putrescine; Spd, spermidine; Spm, spermine.
references
- Fabiato A, Fabiato F. Calculator programs for computing the composition of the solutions containing multiple metals and ligands used for experiments in skinned muscle cells. J Physiol (Paris) 1979;75:463–505. [PubMed] [Google Scholar]
- Fakler B, Brandle U, Bond C, Glowatzki E, Konig C, Adelman JP, Zenner H-P, Ruppersberg JP. A structure determinant of differential sensitivity of cloned inward rectifier K+channels to intracellular spermine. FEBS Lett. 1994;356:199–203. doi: 10.1016/0014-5793(94)01258-x. [DOI] [PubMed] [Google Scholar]
- Fakler B, Brandle U, Glowatzki E, Weidemann S, Zenner H-P, Ruppersberg JP. Strong voltage-dependent inward rectification of inward rectifier K+channels is caused by intracellular spermine. Cell. 1995;80:149–154. doi: 10.1016/0092-8674(95)90459-x. [DOI] [PubMed] [Google Scholar]
- Ficker E, Taglialatela M, Wible BA, Henley CM, Brown AM. Spermine and spermidine as gating molecules for inward rectifier K+channels. Science (Wash DC) 1994;266:1068–1072. doi: 10.1126/science.7973666. [DOI] [PubMed] [Google Scholar]
- Giles WR, Imaizumi Y. Comparison of potassium currents in rabbit atrial and ventricular cells. J Physiol (Lond) 1988;405:123–145. doi: 10.1113/jphysiol.1988.sp017325. [DOI] [PMC free article] [PubMed] [Google Scholar]
- Hagiwara S, Miyazaki S, Rosenthal NP. Potassium current and the effect of cesium on this current during anomalous rectification of the egg cell membrane of a starfish. J Gen Physiol. 1976;67:621–638. doi: 10.1085/jgp.67.6.621. [DOI] [PMC free article] [PubMed] [Google Scholar]
- Hamill OP, Marty A, Neher E, Sakmann B, Sigworth FJ. Improved patch-clamp techniques for high-resolution current recording from cells and cell-free membrane patches. Pflüg Arch Eur J Physiol. 1981;391:85–100. doi: 10.1007/BF00656997. [DOI] [PubMed] [Google Scholar]
- Hilgemann, D.W. 1995. The giant membrane patch. In Single-channel Recording. 2nd edition. B. Sakmann and E. Neher, editors. Plenum Press, New York. 307–327.
- Horie M, Irisawa H, Noma A. Voltage-dependent magnesium block of adenosine-triphosphate-sensitive potassium channel in guinea-pig ventricular cells. J Physiol (Lond) 1987;387:251–272. doi: 10.1113/jphysiol.1987.sp016572. [DOI] [PMC free article] [PubMed] [Google Scholar]
- Hume JR, Uehara A. Ionic basis of the different action potential configurations of single guinea-pig atrial and ventricular myocytes. J Physiol (Lond) 1985;368:525–544. doi: 10.1113/jphysiol.1985.sp015874. [DOI] [PMC free article] [PubMed] [Google Scholar]
- Hutter OF, Noble D. Rectifying properties of heart muscle. Nature (Lond) 1960;188:495. doi: 10.1038/188495a0. [DOI] [PubMed] [Google Scholar]
- Ibarra J, Morley GE, Delmar M. Dynamics of the inward rectifier K+current during the action potential of guinea pig ventricular myocytes. Biophys J. 1991;60:1534–1539. doi: 10.1016/S0006-3495(91)82187-7. [DOI] [PMC free article] [PubMed] [Google Scholar]
- Ishihara K, Hiraoka M, Ochi R. The tetravalent organic cation spermine causes the gating of the IRK1 channel expressed in murine fibroblast cells. J Physiol (Lond) 1996;491:367–381. doi: 10.1113/jphysiol.1996.sp021222. [DOI] [PMC free article] [PubMed] [Google Scholar]
- Ishihara K, Mitsuiye T, Noma A, Takano M. The Mg2+ block and intrinsic gating underlying inward rectification of the K+current in guinea-pig cardiac myocytes. J Physiol (Lond) 1989;419:297–320. doi: 10.1113/jphysiol.1989.sp017874. [DOI] [PMC free article] [PubMed] [Google Scholar]
- Ito H, Ono K. A rapidly activating delayed rectifier K+channel in rabbit sinoatrial node cells. Am J Physiol. 1995;269:H443–H452. doi: 10.1152/ajpheart.1995.269.2.H443. [DOI] [PubMed] [Google Scholar]
- Kubo Y, Baldwin TJ, Jan YN, Jan LY. Primary structure and functional expression of a mouse inward rectifier potassium channel. Nature (Lond) 1993;362:127–133. doi: 10.1038/362127a0. [DOI] [PubMed] [Google Scholar]
- Leech CA, Stanfield PR. Inward rectification in frog skeletal muscle fibres and its dependence on membrane potential and external potassium. J Physiol (Lond) 1981;319:295–309. doi: 10.1113/jphysiol.1981.sp013909. [DOI] [PMC free article] [PubMed] [Google Scholar]
- Lopatin AN, Makhina EN, Nichols CG. Potassium channel block by cytoplasmic polyamines as the mechanism of intrinsic rectification. Nature (Lond) 1994;372:366–369. doi: 10.1038/372366a0. [DOI] [PubMed] [Google Scholar]
- Lopatin AN, Makhina EN, Nichols CG. The mechanism of inward rectification of potassium channels: “long-pore plugging” by cytoplasmic polyamines. J Gen Physiol. 1995;106:923–955. doi: 10.1085/jgp.106.5.923. [DOI] [PMC free article] [PubMed] [Google Scholar]
- Makhina EN, Kelly AJ, Lopatin AN, Mercer RW, Nichols CG. Cloning and expression of a novel human brain inward rectifier potassium channel. J Biol Chem. 1994;269:20468–20474. [PubMed] [Google Scholar]
- Matsuda H. Open-state substructure of inwardly rectifying potassium channels revealed by magnesium block in guinea-pig heart cells. J Physiol (Lond) 1988;397:237–258. doi: 10.1113/jphysiol.1988.sp016998. [DOI] [PMC free article] [PubMed] [Google Scholar]
- Matsuda H, Saigusa A, Irisawa H. Ohmic conductance through the inwardly rectifying K channel and blocking by internal Mg2+ . Nature (Lond) 1987;325:156–159. doi: 10.1038/325156a0. [DOI] [PubMed] [Google Scholar]
- Miyamoto S, Kashiwagi K, Ito K, Watanabe S, Igarashi K. Estimation of polyamine distribution and polyamine stimulation of protein synthesis in Escherichia coli. Arch Biochem Biophys. 1993;300:63–68. doi: 10.1006/abbi.1993.1009. [DOI] [PubMed] [Google Scholar]
- Murphy E, Freudenrich CC, Liberman M. Cellular magnesium and Na/Mg exchange in heart cells. Annu Rev Physiol. 1991;53:273–287. doi: 10.1146/annurev.ph.53.030191.001421. [DOI] [PubMed] [Google Scholar]
- Nichols CG, Makhina EN, Pearson WL, Sha Q, Lopatin AN. Inward rectification and implications for cardiac excitability. Circ Res. 1996;78:1–7. doi: 10.1161/01.res.78.1.1. [DOI] [PubMed] [Google Scholar]
- Noble D. Electrical properties of cardiac muscle attributable to inward going (anomalous) rectification. J Cell Comp Physiol. 1965;66:127–136. [Google Scholar]
- Noble D. The surprising heart: a review of recent progress in cardiac electrophysiology. J Physiol (Lond) 1984;353:1–50. doi: 10.1113/jphysiol.1984.sp015320. [DOI] [PMC free article] [PubMed] [Google Scholar]
- Noma A, Nakayama T, Kurachi Y, Irisawa H. Resting K conductances in pacemaker and non-pacemaker heart cells of the rabbit. Jpn J Physiol. 1984;34:245–254. doi: 10.2170/jjphysiol.34.245. [DOI] [PubMed] [Google Scholar]
- Oliva C, Cohen IS, Pennefather P. The mechanism of rectification of i K1in canine Purkinje myocytes. J Gen Physiol. 1990;96:299–318. doi: 10.1085/jgp.96.2.299. [DOI] [PMC free article] [PubMed] [Google Scholar]
- Pegg AE, McCann PP. Polyamine metabolism and function. Am J Physiol. 1982;243:C212–C221. doi: 10.1152/ajpcell.1982.243.5.C212. [DOI] [PubMed] [Google Scholar]
- Sakmann B, Trube G. Conductance properties of single inwardly rectifying potassium channels in ventricular cells from guinea-pig heart. J Physiol (Lond) 1984;347:641–657. doi: 10.1113/jphysiol.1984.sp015088. [DOI] [PMC free article] [PubMed] [Google Scholar]
- Sanguinetti MC, Jurkiewicz NK. Two components of cardiac delayed rectifier K+current. J Gen Physiol. 1990;96:195–215. doi: 10.1085/jgp.96.1.195. [DOI] [PMC free article] [PubMed] [Google Scholar]
- Shibasaki T. Conductance and kinetics of delayed rectifier potassium channels in nodal cells of the rabbit heart. J Physiol (Lond) 1987;387:227–250. doi: 10.1113/jphysiol.1987.sp016571. [DOI] [PMC free article] [PubMed] [Google Scholar]
- Shimoni Y, Clark RB, Giles WR. Role of an inwardly rectifying potassium current in rabbit ventricular action potential. J Physiol (Lond) 1992;448:709–727. doi: 10.1113/jphysiol.1992.sp019066. [DOI] [PMC free article] [PubMed] [Google Scholar]
- Silver MR, DeCoursey TE. Intrinsic gating of inward rectifier in bovine pulmonary artery endothelial cells in the presence or absence of internal Mg2+ . J Gen Physiol. 1990;96:109–133. doi: 10.1085/jgp.96.1.109. [DOI] [PMC free article] [PubMed] [Google Scholar]
- Smith PL, Baukrowitz T, Yellen G. The inward rectification mechanism of the HERG cardiac potassium channel. Nature (Lond) 1996;379:833–836. doi: 10.1038/379833a0. [DOI] [PubMed] [Google Scholar]
- Stanfield PR, Davies NW, Shelton PA, Khan IA, Brammar WJ, Standen NB, Conley EC. The intrinsic gating of inward rectifier K+ channels expressed from the murine IRK1 gene depends on voltage, K+ and Mg2+ . J Physiol (Lond) 1994;475:1–7. doi: 10.1113/jphysiol.1994.sp020044. [DOI] [PMC free article] [PubMed] [Google Scholar]
- Taglialatela M, Wible BA, Caporaso R, Brown AM. Specification of pore properties by the carboxyl terminus of inwardly rectifying K+channels. Science (Wash DC) 1994;264:844–847. doi: 10.1126/science.8171340. [DOI] [PubMed] [Google Scholar]
- Vandenberg CA. Inward rectification of a potassium channel in cardiac ventricular cells depends on internal magnesium ions. Proc Natl Acad Sci USA. 1987;84:2560–2564. doi: 10.1073/pnas.84.8.2560. [DOI] [PMC free article] [PubMed] [Google Scholar]
- Vandenberg, C.A. 1994. Cardiac inward rectifier potassium channel. In Ion Channels in the Cardiovascular Systems: Function and Dysfunction. P.M. Spooner, A.M. Brown, W.A. Catterall, G.J. Kaczorowski, and H.C. Strauss, editors. Futura Publishing Co., New York. 145–167.
- Watanabe S-I, Kusama-Eguchi K, Kobayashi H, Igarashi K. Estimation of polyamine binding to macromolecules and ATP in bovine lymphocytes and rat liver. J Biol Chem. 1991;266:20803–20809. [PubMed] [Google Scholar]
- Yang J, Jan YN, Jan LY. Control of rectification and permeation by residues in two distinct domains in an inward rectifier K+channel. Neuron. 1995;14:1047–1054. doi: 10.1016/0896-6273(95)90343-7. [DOI] [PubMed] [Google Scholar]


