



Abstract
The adverse effects of alcohol on the developing humans represent a spectrum of structural and neurobehavioral abnormalities, most appropriately termed as fetal alcohol spectrum disorder (FASD). The mechanism by which ethanol induces FASD is unknown. Human studies of FASD are very limited due to ethical constraints; however, several animal models from nematodes to mammals are utilized to understand the molecular mechanism of this disorder. We have used Japanese medaka (Oryzias latipes) embryo-larval development as a unique non-mammalian model to study the molecular mechanism of FASD. Fertilized medaka eggs were exposed to ethanol (0-400 mM) for 48 hour post fertilization (hpf) and then maintained in regular embryo rearing medium without ethanol. Viable embryos were harvested on 0, 2, 4 and 6 day post fertilization (dpf) and analyzed for DNA, RNA and protein contents of the embryos. By applying semi-quantitative RT-PCR (rRT-PCR) and quantitative real-time RT-PCR (qRT-PCR), RNA samples were further analyzed for seven transcription factors, emx2, en2, iro3, otx2, shh, wnt1 and zic5 which are expressed in the neural tube of medaka embryo during early phase of development. RNA and protein contents of the embryos were significantly reduced by ethanol at 400 mM dose on 4 and 6 dpf compared to the control (no ethanol), and 100 mM ethanol treated embryos. However, significant reduction of DNA was observed only in 4dpf embryos. Total protein contents of yolk remained unaltered after ethanol treatment. Expression pattern of emx2, en2, iro3, otx2, shh, wnt1, and zic5 mRNAs were found to be developmentally regulated, however, remained unaltered after ethanol treatment. It is therefore concluded that alteration of nucleic acid and protein contents of medaka embryo by ethanol could be used as an indicator of embryonic growth retardation which might be the result of disruption of specific gene function during development.
Keywords: Alcohol, Japanese medaka, Development, DNA, RNA, protein, transcription factors
1. Introduction
Alcohol is toxic to the developing fetus and consumption during pregnancy produces fetal alcohol spectrum disorder (FASD) (Riley and McGee, 2005). Among FASD, fetal alcohol syndrome (FAS) is the most clinically recognizable form and is characterized by prenatal and postnatal growth deficiency, central nervous system disorders including mental retardation, and a distinctive pattern of cardiovascular, facial and limb defects. Human studies of FAS are very limited because of ethical constraints; however, several non-human vertebrate and invertebrate animal models have been utilized successfully and have provided major contributions to the understanding of FAS (Sulik, 2005; Cudd, 2005). Several possible mechanisms including increased oxidative stress, mitochondrial damage, interference with growth factor activity, effect on cell adhesion, lack of blood supply, oxidative damage and nutritional imbalance (Randall et al., 1987; West et al., 1994; Abel and Hannigan, 1995, Preedy et al., 1999) are proposed to explain FAS, however, the exact molecular pathway (s) leading to FAS is still unknown.
Fish models, particularly zebrafish (Danio rerio) and Japanese medaka (Oryzias latipes), are currently emerging as an alternative non-mammalian vertebrate models for the study of gene function (Wittbrodt et al., 2002; Furutani-Seiki and Wittbrodt, 2004). There are several advantages of these animal models over mammalian models. Fertilization and embryonic development (fertilized eggs and larvae) in these fish are external (outside the body of the mother), which eliminates maternal/placental/ fetal influences on embryo development. Embryos are covered by a transparent chorion which is optically clear and allows non-invasive observation of the embryo during development. The effects of ethanol on zebrafish embryos have been studied by a number of investigators (Bilotta et al., 2004; Carvan et al., 2004; Lockwood et al., 2004; Reimers et al., 2004, Arenzana et al., 2006, Li et al., 2007), which establish the importance of fish as a model organism to study ethanol teratogenicity. Compared to zebrafish, medaka (Oryzias latipes) are less utilized in studying ethanol-induced toxicity. We are developing Japanese medaka embryogenesis as an alternative to the zebrafish model to study the molecular mechanism of ethanol toxicity (Wang et al., 2006a,b; 2007a). We have demonstrated that medaka embryos exposed to ethanol for 48 hour post fertilization (hpf) have developed several precocious features in cardiovascular, craniofacial and skelatal systems which are analogous to the FAS features of human (Wang et al., 2006a,b). Moreover, medaka embryos express alcohol dehydrogenase (ADH) and aldehyde dehydrogenase(ALDH) enzyme mRNAs during development (Dasmahapatra et al., 2005; Wang et al., 2006a,b; 2007a,b) and ethanol is able to attenuate the expression of Aldh9 mRNA level with no apperent effect in Adh mRNA expression (Wang et al., 2006a,b, 2007a). Several other features such as reduction in total body length, head width and alteration in caspase 3/7 activity by ethanol in medaka embryogenesis are also reported (Oxendine et al. 2006). Therefore, medaka can be served as a unique non-mammalian vertebrate model to study ethanol toxicity. In this communication we have reported ethanol-induced alteration in total macromolecular constituents (DNA, RNA and protein) of the embryonic body and proposed that these cellular constituents can be used as an index of ethanol teratogenesis. As developing central nervous system (CNS) is the major target site of ethanol action in the embryo we have analyzed mRNA expression pattern of seven transcription factors (emx2, en2, iro3, otx2, shh, wnt, and zic5) which are expressed in the neural tube of medaka embryo during early phase of development and plays significant role in medaka brain morphogenesis (Kage et al., 2004). Our results indicate that ethanol is able to reduce DNA, RNA and protein contents of the embryo in a dose-and time-dependent manner. The expression of the transcription factors are found to be developmentally regulated, however, remained unaltered after ethanol treatment.
2. Materials and methods
The Institutional Animal Care and Use Committee (IACUC) of the University of Mississippi (UM) approved all the experimental protocols.
2.1. Experimental procedure
Methods of animal maintenance, egg collection, ethanol treatment, RNA preparation and purification, PCR, semi-quantitative or relative RT-PCR (rRT-PCR), quantitative real-time RT-PCR (qRT-PCR), and cloning and sequencing of the PCR products were previously described (Dasmahapatra et al., 2005; Wang et al., 2006a,b, 2007a). In brief, adult male and female medaka (3-4 months old with breeding) were maintained at 25 °C in balanced salt solution (BSS, 17mM NaCl, 0.4mM KCl, 0.3mM MgSO4, 0.3mM CaCl2) with standard diet and 16L: 8D photoperiod. Fertilized embryos were collected in the morning (9 a.m.) of the experimental day, separated mechanically from the clutch, and examined under a binocular microscope for removal of unfertilized, older, and damaged embryos. Viable embryos were maintained one egg/ mL hatching solution (17 mM NaCl, 0.4 mM KCl, 0.36 mM CaCl2 and 0.6 mM MgSO4) in a 48 well culture plate at 25 °C with 16L: 8D photoperiod. Ethanol (0-400 mM) was added to the culture medium at ~ 2 hour post fertilization (hpf) (Iwamatsu stage 3-4), and discontinued after 48 hpf following one time change of ethanol at 24 hpf. The embryos were examined daily for developmental changes (cardiovasculature, blood clots, active circulation) under a phase contrast microscope (AO Scientific Instruments) with a 50 % static renewal of the medium. The embryonic development was classified after Iwamatsu (2004). The embryos were sacrificed at zero (~2hpf for RNA and transcription factors, and ~ 6hpf for DNA and protein), 2 (~48 hpf), 4 (~96 hpf) and 6 (~144 hpf) day post fertilization (dpf).
2.2. Isolation of DNA
Total DNA from the embryos was isolated by following the method of Doyle and Doyle (1987) with some modifications. Six to ten embryos after required period of treatment with intact chorion were homogenized in 100 μL of 2X CTAB (2% hexadecyltrimethylammonium bromide in 100 mM Tris-HCl, pH 8.0, NaCl 1.4 M, EDTA 20 mM and 0.2% β-mercaptotoethanol; all from Sigma-Aldrich) and incubated at 60 °C for 1 h. An equal volume of chloroform (Sigma-Aldrich) was added to the homogenate, vortexed for one min and then centrifuged at 12000 g for 5 min at room temperature. The clear upper layer was transferred to a clean 1.5 mL centrifuge tube and 500 μL of absolute ethanol was added to the tube to precipitate DNA. The mixture was centrifuged again at 12000 g for 5 min at room temperature. The precipitate (DNA) was saved, washed with one mL of 75 % ethanol and dissolved in 100 μL of TE (10 mM Tris-HCl, 0.1 mM EDTA, pH 7.5). The extracted DNA was treated with RNase A (10 μg/mL; Sigma-Aldrich, St.Louis, MO) and incubated at 37 °C for 1h to get rid of RNA contamination. After incubation, the mixture was further treated with 100 μL of phenol: chloroform (1:1) vortexed and centrifuged at 12000 g for 5 min. The aqueous phase was transferred to a clean 1.5 mL centrifuge tube and 100 μL of chloroform was added. The mixture after quick vortexing centrifuged again at 12000 g for 5 min and the clear upper phase was transferred to a clean centrifuge tube. Five hundred microliter of absolute ethanol was added, vortexed and centrifuged at 12000 g for 5 min. The pellet was saved and washed twice with 75% ethanol, air dried at room temperature and dissolved in requisite amount of nuclease free water. DNA concentration was determined in an Eppendorf Biophotometer. The purity of the DNA was checked in 1% agarose gel electrophoresis containing ethidium bromide (1μg/mL). The samples with A260:A280 is > 1.5 and showed distinct DNA bands with no RNA contamination (judged from agarose gel electrophoresis) were considered for data analysis. By this technique the DNA content of the embryos of early stages of development (before blastula) was undetectable in agarose gel electrophoresis. Therefore, the DNA content of zero dpf samples were prepared from the embryos at blastula stage (Iwamatsu stage 10), however, the embryos of analyzed on 2, 4 and 6 dpf were exposed to ethanol ~ 2hpf (Iwamatsu stage 3-4).
2.3. Isolation of protein from the embryos
To isolate total proteins from the embryonic body and the yolk separately, the embryos with intact chorion were fixed in 4% paraformaldehyde in 100 mM PBS (pH 7.4) for ~ 4h at room temperature. Then the chorion was removed and the yolk was separated from the embryo under a binocular microscope. For zero dpf samples we have used the embryos of Iwamatsu stage 10. The dissected embryos were pulled, washed twice with 10 mM PBS (pH 7.4), weighed to the nearest mg and 6-8 embryos (without yolk) were homogenized in 0.1mL 0.25M sucrose.The collected yolks (6-8 in numbers) were also homogenized in sucrose (0.1 mL of 0.25M sucrose) and used for protein extraction. To each homogenate, 200 μL of ice cold 3.5% perchloric acid (PCA, Sigma-Aldrich) was added and incubated in ice for 30 min. The mixture was centrifuged at 12000 g for 10 min at 4 °C and the precipitate fraction was washed with 0.5 mL of 3.5% PCA. The precipitate was treated with chloroform: ethanol: ether (1:2:1) mixture and incubated at 37 °C for 30 min. The samples were centrifuged at 12000 g for 5 min followed by washing of pellets with absolute ethanol and ether. The precipitate was dried at room temperature, dissolved with requisite amount of 0.5 M NaOH (200 μL for embryo and 500 μL for yolk) by heating at 70 °C for 30 min. The samples were centrifuged at 12000 g for 5 min and 5 μL of clean supernatant was used for protein assay. The protein concentration was determined in a microplate reader using BioRad DC protein assay technique (BioRad, Hercules, CA, USA). Results were expressed as μg protein/embryo or yolk.
2.4. Semi-quantatative and quantitative real-time RT-PCR
One μg of DNA-free total RNA was used to synthesize cDNA using a first strand cDNA synthesis protocol (Invitrogen, Carlsbad, CA, USA). The cDNA synthesis was made at 50 °C for 1 h in a 20 μL reaction volume containing 4 μL 5 X buffer, 1 μL 10 mM dNTPs, 1 μL 10 mM DTT, 1μL oligo dT and 200 U of superscript III RNA polymerase (Invitrogen). One μL of synthesized cDNA was used to measure the transcription factor mRNAs by rRT-PCR and qRT-PCR. Reactions for rRT-PCR were conducted in a thermal cycler (Opticon 2, MJ Research, Reno, NV, USA) with a reaction volume of 20 μL containing 10 μL of 2X buffer (Qiagen, Valencia, CA, USA), 1 μL cDNA, 50 pm each of gene-specific forward and reverse primers, and 50 pm each of forward and reverse primers of internal control (β-actin) (Table 1). The volume was adjusted with required amount of nuclease-free water. The amplification reaction was initiated by denaturation at 94 °C for 2 min, one cycle, followed by 30 cycles of denaturation at 94 °C, 30 sec, annealing at 65 °C for 1 min and extension at 72 °C for 2 min with a final extension at 72 °C for 7 min. After amplification, 5 μL of the reaction product was separated in 2% agarose gel electrophoresis containing ethidium bromide (1μg/mL) and the images of the bands of target and internal standard were captured on a Versadoc Image analyzer (BioRad). The band intensity of the target and internal control was determined by image analysis software (BioRad). The results were expressed as the ratio of relative band intensity of target gene: β-actin. For qRT-PCR, 1μL of cDNA in 20 μL final reaction volume containing 10 μL supermix (Bio-Rad) or 2X PCR mix (Qiagen) with SYBR green I (Sigma-Aldrich, St. Louis, MO, USA), 50 pM each of forward and reverse primers of either target gene of interest (experimental) or β-actin (internal standard) (Table 1) and requisite amount of nuclease free water were used. The PCR amplification and fluorescence detection were performed in a real-time PCR thermal cycler (Opticon2, MJ Research). The reaction conditions were: initial denaturation at 95 °C for 3 min, one cycle, followed by 40 cycles of denaturation at 94 °C for 30 sec, annealing at 65 °C for 1 min, extension at 72 °C for 2 min, fluorescence data collection for one sec; a second set of fluorescence data was collected after incubating the samples at 76 °C for 1 sec to avoid the formation of primer dimer. A final extension of one cycle at 72 °C for 10 min was made. The melting curve was constructed by plotting fluorescence data against temperature (65-95 °C with an interval of 0.2 °C). Samples with good melting curve were considered for analysis. The cycle threshold or C(t) line was set manually using the Opticon monitor software (MJ Research, San Francisco, CA, USA). This threshold was applied to all wells for consistent analysis of individual samples and internal standards. For each sample, the threshold cycle for internal standard (β-actin) amplification (Ct, β-actin) was subtracted from the threshold cycle of the corresponding transcription factor amplification (Ct, transcription factor) to yield ΔCt. The threshold cycle represents the cycle number at which the fluorescence signal was significantly above the base line (in our condition it was routinely between 0.05-0.1). For each day and treatment group, the mean ΔCt of 0 dpf samples was subtracted from each individual samples to yield individual ΔΔCt. Fold induction relative to 0 dpf samples were calculated with 2-ΔΔCt.
Table 1.
List of primers used in semi-quantitative RT-PCR (rRT-PCR) and quantitative real-time RT-amplifications (qRT-PCR) of the transcription factor mRNAs of medaka embryo.
| mRNA | Sense (5′-3′) | Antisense (5′-3′) | Product (bp) | Target/internal standard | GenBank Accession |
|---|---|---|---|---|---|
| β-actin | CCTGACCCTGAAGTATCCCA | GAGCTATGAGCTGCCTGACG | 542 | Internal standard | S74868 |
| emx2 | CCGAGGAACCCATCAGGCCC | GGGTGTGCGGCCAGCGCGTG | 198 | Target | AJ132403 |
| en2 | CGCGCAGCCCATGCTGTGGCC | GTACAGTCCCTGTGCCATCAG | 337 | Target | AF112141 |
| iro3 | CCAGACCCAAAAATGCCACC | CCTTGTAAATCCTCATAGCCG | 221 | Target | AB098317 |
| otx2 | GGCCTGAGCTTAACTACCTC | GGACTCGGGAAGATTGATTGATTTTC | 201 | Target | AJ000939 |
| Shh | GATGAGGAGAACACCGGAGCC | CTTCCACCGCCAGTCTGGAC | 241 | Target | AB007129 |
| wnt1 | GTGGGAGATTTCCTCAAGGAC | CAGCACCAGTGGAAAGTGCAG | 338 | Target | AJ243208 |
| zic5 | CCTCTGAACATGGCAATTCAG | CTCTGACGTGGTTCACCAGC | 283 | Target | BJ013948 |
2.5. Statistics
The data obtained in rRT-PCR and qRT-PCR were log transformed and used for one way ANOVA followed by post-hoc Tukey’s multiple comparison test. Other data (DNA, RNA, protein) were directly used for ANOVA followed by Tukey’s test. The results were expressed as mean± SEM of 3-8 independent experiments and p< 0.05 considered as significant.
3. Results
3.1. Effects of ethanol on DNA, RNA and protein contents of medaka embryo during development
To find a suitable biochemical marker that reflects the normal developmental pattern of medaka during embryogenesis, we have measured the nucleic acid (DNA and RNA) and protein contents in medaka embryos at zero, 2, 4 and 6 dpf and expressed the results as concentration of macromolecules (ng for DNA and RNA and μg for protein)/ embryo. The data indicate that during embryogenesis the enhancement of all three cellular constituents (DNA, RNA and protein) were affected by ethanol. The DNA and protein contents of the embryos considered as zero day was prepared from the embryos at early blastula stage (Iwamatsu stage 10), but for total RNA and transcription factor mRNAs the embryos of earlier developmental stages (stages 3-4) were used. As the cleavage continued, the amount of DNA in embryos in 2dpf was found to be increased in all groups compared to the embryos of zero dpf, however, the values were not significantly different. Also, the increase in 2 dpf was statistically equal in all three groups (Figure 1A). On day 4, when ethanol was no longer present in the medium, DNA contents of the embryos were increased further, and the enhancement in control and 100 mM group were statistically significant from the corresponding control and 100 mM groups of 2 dpf embryos, but not in 400 mM group (where the values were not significantly different from 400 mM group of 2dpf). Moreover, the DNA contents of control embryos at 4 dpf also showed significantly higher amount of DNA than the embryos exposed to 400 mM ethanol. On day 6, no further increase of embryonic DNA was noticed in control, 100 and 400 mM groups with regard to the corresponding embryos of 4dpf, however, the value of 400 mM group was found to be significantly different from the 400 mM group of 2dpf (Figure 1A). The concentration of RNA like DNA was also increased in embryos with the advancement of embryogenesis. However, RNA contents of 2dpf embryos (control, 100 and 400 mM) were remained at the same level as in zero dpf group (Figure 1B). In 4 dpf, the RNA concentrations of the embryos of control and 100 mM group were significantly increased in comparison with the embryos of zero and 2 dpf, but in 400 mM group the enhancement was statistically significant only from the embryos at zero dpf, but not from 2 dpf. Further analysis of the data indicate that in 4dpf embryos the RNA content of control and 100 mM ethanol-treated groups have more amount of RNA than the embryos exposed to 400 mM ethanol. In 6dpf, no further enhancement of this macromolecule was noticed in control, 100 mM and 400 mM group with regard to the corresponding embryos of 4dpf, however, in 400 mM group, the increase was significantly higher than the embryos of 2dpf exposed to similar ethanol concentration (Figure 1B). Further comparison of RNA data in 6 dpf samples indicate that both control and 100 mM ethanol-treated groups have more RNA than the embryos exposed to 400 mM ethanol. The embryonic protein shows the most significant change during the advancement of development (Figure 1C). Both in control and treated embryos this cellular constituent shows a sharp rise over time and by day 6 the increase was more than 20-fold in control and 100 mM groups compared to the embryos of zero dpf. Like DNA and RNA, the enhancement of embryonic protein in 2 dpf embryos was not significantly different from zero dpf (stage 10) samples. The embryos of 4 dpf showed a significant rise of this macromolecule over zero dpf and corresponding 2 dpf groups in both control and 100 mM ethanol-treated embryos, but in 400 mM group the enhancement was remained at the same level as in zero or 2 dpf groups. The embryonic protein was increased further in all groups in 6 dpf embryos. In control and 100 mM group the values were significantly higher than the corresponding embryos of 4dpf. The embryos treated with 400 mM ethanol also have higher amount of protein, and the increase was significantly different from the corresponding 2 dpf embryos, but not from 4 dpf. Also the values were significantly lower than the values observed in control and 100 mM groups on 6 dpf. The total embryonic yolk proteins remained almost unaltered during development, but it is significantly reduced in control and 100 mM group in 6 dpf compared to the embryos of zero dpf (Figure 1D).
Figure 1.
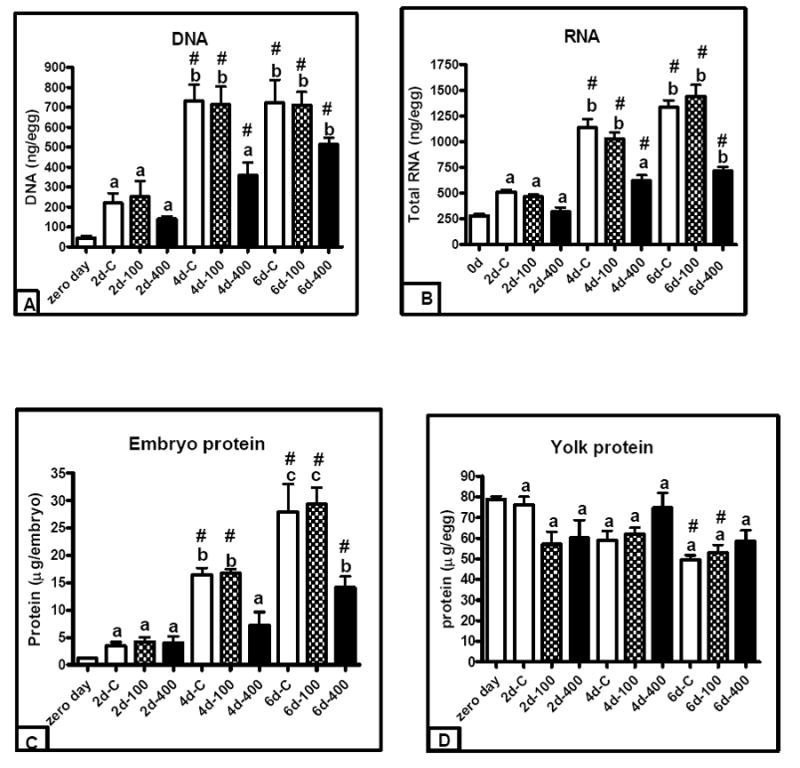
Effect of ethanol on DNA, RNA and protein contents of the medaka embryo during development. Each bar represents the mean± SEM of four to six separate experiments. Bar head with pound symbol (#) indicates that the results are significantly different (p<0.05) from zero dpf; different lower case letters (a, b and c) represent the data are significantly different from the corresponding control, 100 or 400 mM groups at 2dpf. A= DNA, B= RNA, C= embryo protein D= Yolk protein
3.2. Effect of ethanol in mRNA expression pattern of emx2, en2, iro3, otx2, shh, wnt1, and zic5 in medaka embryo
We have analyzed the expression pattern of seven transcription factor mRNAs (emx2, en2, iro3, otx2, shh, wnt1, and zic5) during medaka embryogenesis by applying rRT-PCR (Table 2, Figures 2A-G) and qRT-PCR (Table 3) techniques using total RNA extracted from the whole embryo. In rRT-PCR analysis the mRNA level of all these transcription factors were significantly higher in the embryos at 2 dpf in comparison with the embryos of zero dpf which indicate that these mRNAs were not inherited from the maternal source and started to express as early as cleavage started (Figures 2A-G). On the other hand, data obtained by qRT-PCR analysis, the mRNA content of all these transcription factors in 2dpf group except en2 and zic5 appeared to be increased in comparison with the zero dpf group, however, the values were not statistically significant. In case of otx2, the values were found to be significant in 4 dpf and 6 dpf groups in comparison with the zero dpf embryos. In en2, the expression was remained at the same level as in zero dpf. Further, rRT-PCR analysis showed that the expression of all seven transcription factors were developmentally regulated, reached highest level of expression on 2dpf, and then maintained either a steady-state (emx2, en2 ,iro3, otx2, shh, and wnt1) or down-regulated (zic5) in later stages of development. In qRT-PCR analysis, only zic5 (2, 4 and 6 dpf) and otx2 (4 and 6 dpf) showed developmental regulation; however, due to high variability, no clear conclusion could be drawn on other transcription factors. Despite these variations, effects of ethanol (100-400 mM) in the expression pattern of these transcription factor mRNAs were found to be identical in these two techniques. Ethanol was unable to show any effect in the expression pattern of all these transcription factors as observed on 2 dpf by both rRT-PCR and qRT-PCR. The rhythm of mRNA expression in all transcription factors also remained unaltered in 4 and 6 dpf embryos when the medium was devoid of ethanol (Tables 2 and 3).
Table 2.
Effect of ethanol on emx2, en2, iro3, otx2, shh, wnt1 and zic5 mRNA expression in Japanese medaka embryo during development
| emx2 | en2 | iro3 | otx2 | shh | wnt1 | zic5 | |
|---|---|---|---|---|---|---|---|
| Day 0 | 0 | 0.05 ±0.02 | 0.03 ±0.011 | 0.19 ±0.051 | 0.13 ±0.041 | 0.09 ±.04 | .005 ±.0011 |
| Day 2 (Control) | 0.17 a ± 0.016 | 0.21 a ±0.037 | 0.23 a ±0.056 | 0.38 a ±.009 | 0.62 a ±0.058 | 0.54 a ±.016 | 0.27 a ±0.028 |
| Day 2 (100mM) | 0.16 a ±0.015 | 0.17 a ±0.026 | 0.17 a ±0.011 | 0.37 a ±0.023 | 0.63 a ±0.059 | 0.53 a ±.043 | 0.36 a ±0.019 |
| Day 2 (400mM) | 0.14 a ±0.021 | 0.19 a ±0.026 | 0.20 a ±0.026 | 0.35 a ±0.032 | 0.63 a ±0.085 | 0.54 a ±.043 | 0.33 a ±0.031 |
| Day 4 (Control) | 0.25 a ±0.032 | 0.08 ±0.022 | 0.13 a ±0.027 | 0.46 a ±0.018 | 0.54 a ±0.042 | 0.35 a ±.042 | 0.18 a ±0.020 |
| Day 4 (100mM) | 0.24 a ±0.027 | 0.08 ±0.015 | 0.13 a ±0.022 | 0.41 a ±0.026 | 0.43 a ±0.033 | 0.32 a ±.013 | 0.17 a ±0.02 |
| Day 4 (400mM) | 0.25 a ±0.05 | 0.09 a ±.004 | 0.11 a ±0.015 | 0.35 a ±0.028 | 0.51 a ±0.039 | 0.35 a ±0.029 | 0.16 a ±0.022 |
| Day 6 (Control) | 0.18 a ±.02 | 0.11 a ± 0.018 | 0.13 a ±0.013 | 0.32 a ±0.032 | 0.44 a ±0.052 | 0.26 a ±0.048 | 0.08 a ±0.016 |
| Day 6 (100mM) | 0.25 a ±.02 | 0.09 a ±0.014 | 0.13 a ±0.014 | 0.30 a ±0.027 | 0.50 a ±0.026 | 0.29 a ±0.023 | 0.11 a ±0.008 |
| Day 6 (400mM) | 0.16 a ±0.016 | 0.10 a ±0.017 | 0.14 a ±.020 | 0.29 a ±0.031 | 0.41 a ±0.036 | 0.23 a ±0.022 | 0.10 a ±0.014 |
Total RNA was prepared from 6-8 pooled medaka embryos at the respective days of development, reverse transcribed and analyzed by rRT-PCR using β-actin primers as internal control. The results were expressed as the ratio of relative band intensity of target gene: β-actin. The data obtained were log transformed and used for one way ANOVA followed by post-hoc Tukey’s multiple comparison test; p < 0.05 was considered as significant. Each data are the mean ±S.E.M. of 4-8 separate experiments. Superscript letter “a” indicates that the value is significantly different from zero day samples.
Figure 2.
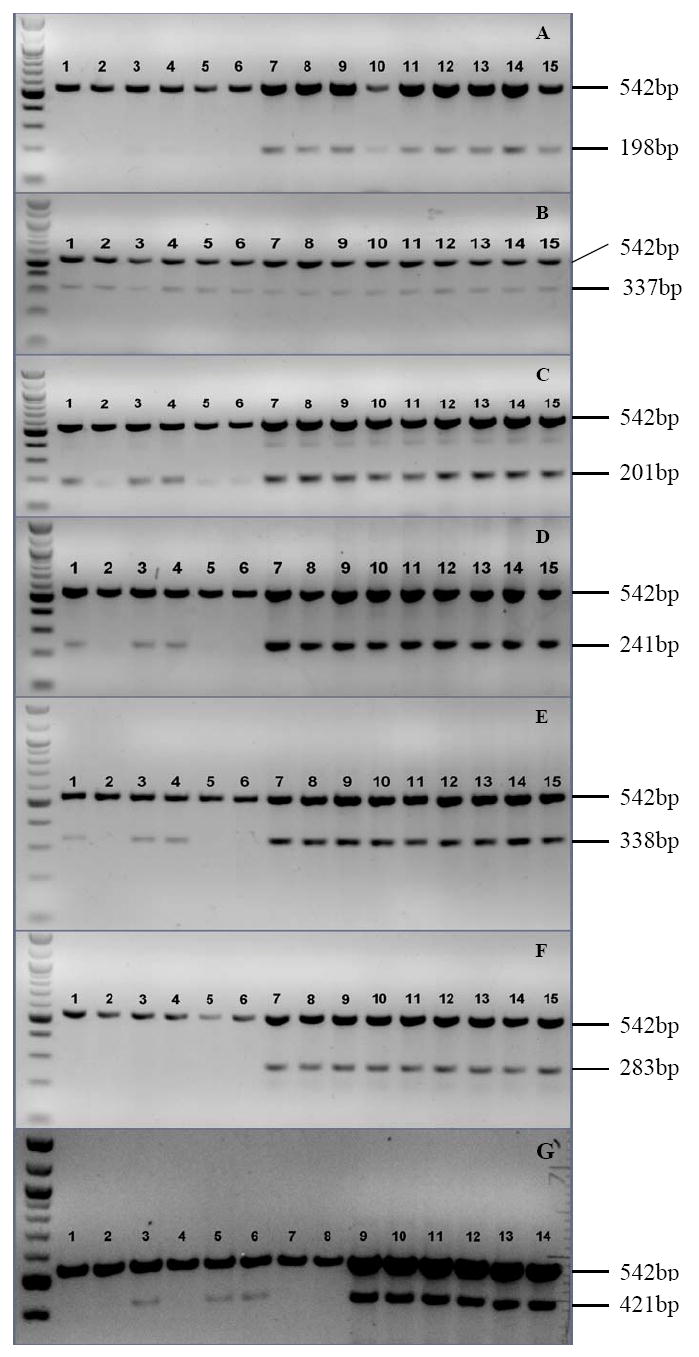
Representative gel pictures of semi-quantitative RT-PCR analysis of emx2, en2, otx2, shh, wnt1, zic5, and iro3 mRNAs of medaka embryos developmentally exposed to ethanol. A= emx2, B=en2, C=otx2, D= shh, E= wnt1, F=zic5 and G= iro3. The lanes of A-F marked 1-6 represent zero h samples; Lane 7: control 2 dpf, lane 8:100 mM 2dpf, lane 9: 400 mM 2 dpf, lane 10: control 4 dpf, lane 11: 100 mM 4 dpf, lane 12: 400 mM 4 dpf, lane 13: control 6 dpf, lane 14: 100 mM 6dpf, lane 15: 400 mM 6 dpf. The lanes of G marked as 1-8 represent as zero h samples; lane 9: control 2 dpf, lane 10: 100 mM 2 dpf, lane 11: 400 mM 2dpf, lane 12: control 4 dpf, lane 13, 100mM 4 dpf, lane 14, 400 mM 4 dpf.. The unmarked lane extreme left is 100 bp ladder. The band at 542 bp is β actin (internal control). Some of the samples of zero dpf (except emx2 and zic5) showed bands of target gene products which indicate that the expression of these mRNAs are very rapid during embryogenesis.
Table 3.
Effect of ethanol on emx2, en2, iro3, otx2, shh, wnt1 and zic5 mRNA expression in Japanese medaka embryo during development
| emx2 | en2 | iro3 | otx2 | shh | wnt1 | zic5 | |
|---|---|---|---|---|---|---|---|
| Day 0 | 1 | 1 | 1 | 1 | 1 | 1 | 1 |
| Day 2 (Control) | 1.74 ±0.62 | 0.67 ±0.24 | 4.39 ±2.99 | 6.89 ±3.29 | 7.08 ±4.80 | 1.91 ±0.68 | 16.27 a ±8.29 |
| Day 2 (100 mM) | 2.08 ±0.70 | 0.92 ±0.51 | 4.21 ±1.96 | 10.74 ±3.92 | 9.25 ±4.73 | 2.22 ±0.89 | 19.89a ±8.23 |
| Day 2 (400 mM) | 2.74 ±0.48 | 1.68 ±1.04 | 4.75 ±2.15 | 11.65 ±4.47 | 9.72 ±4.22 | 3.31 ±1.81 | 23.18 a ±9.35 |
| Day 4 (Control) | 6.02 ±3.53 | 0.58 ±0.14 | 4.04 ±1.48 | 25.47 a ±9.34 | 19.86 ±10.36 | 1.59 ±0.44 | 12.28 a ±2.04 |
| Day 4 (100mM) | 11.81 a ±3.84 | 0.39 ±0.07 | 4.04 ±0.84 | 32.35 a ±8.56 | 18.93 a ±6.24 | 1.81 ±0.37 | 11.80 a ±1.79 |
| Day 4 (400 mM) | 4.15 ±1.43 | 0.62 ±0.24 | 2.02 ±0.5 | 14.34 a ±3.71 | 7.64 ±3.31 | 1.33 ±0.39 | 6.93 a ±1.18 |
| Day 6 (Control) | 5.188 ±2.032 | 0.82 ±0.38 | 8.40 ±4.59 | 20.17 a ±9.54 | 20.94 ±12.48 | 0.82 ±0.22 | 18.48 a ±7.7 |
| Day 6 (100 mM) | 3.50 ±1.59 | 0.26 ±0.08 | 4.66 ±3.33 | 13.13 a ±7.16 | 13.69 ±9.32 | 0.57 ±0.10 | 10.63 a ±5.69 |
| Day 6 (400 mM) | 4.57 ±1.04 | 0.69 ±0.4 | 5.86 ±2.48 | 15.42 a ±5.23 | 14.86 ±6.74 | 0.68 ±0.25 | 14.37 a ±5.57 |
Total RNA was prepared from 6-8 pooled medaka embryos at the respective days of development, reverse transcribed and analyzed by qRT-PCR. For each sample, the threshold cycle for internal standard (β-actin) amplification (Ct, β-actin) was subtracted from the threshold cycle of the corresponding transcription factor amplification (Ct, transcription factor) to yield ΔCt. For each day and treatment group, the data are the mean of ΔCt of 0 dpf samples was subtracted from each individual samples to yield individual ΔΔCt. Fold induction relative to 0 dpf samples was calculated with 2- ΔΔCt. The data obtained were log transformed and used for one way ANOVA followed by post-hoc Tukey’s multiple comparison test; p< 0.05 was considered as significant. Each data are the mean ±S.E.M. of 4-8 separate experiments. Superscript letter “a” indicates the value is significantly different from zero day samples.
4. Discussion
As a sequel of our previous studies with the effects of ethanol on medaka embryogenesis, and also to find a suitable biochemical marker of ethanol teratogenesis, we have followed a strategy to analyze the macromolecular contents (DNA, RNA and Protein) of medaka embryos during development. In our culture conditions (16 h light and 8h dark, temperature 25 °C) control embryos hatch ~ 175 hpf (Wang et al., 2006a,b). We therefore restrict our studies to 6 dpf (~ 144 hpf) that allows us to keep embryos in ovo. The fertilized eggs are treated with ethanol almost immediately after collection (~2 hpf, Iwamatsu stage 3-4) and then the treatment continued up to 48 hpf. Ethanol was removed from the medium and the embryos are maintained for four more days (6dpf) in regular hatching solution. Therefore, our experimental conditions have two distinct phases; treatment phase [zero to 2 dpf; when ethanol is present in the medium and the embryos are in early stages of development] and the recovery phase [2dpf to 6 dpf; when ethanol is no longer present in the medium and the embryos are in the late phases of development]. From our preliminary studies we have observed that teratogenic effects of ethanol in medaka is age-dependent and embryos could be up to 48 hpf are more sensitive to ethanol than the embryos in later days of development (Wang, 2006a,b). Therefore the embryos are exposed to ethanol only for 48 hpf (Iwamatsu stage 24-25) and with these conditions ethanol is able to induce teratogenic effects in skeletal, craniofacial, and cardiovascular organs of medaka embryos (Wang et al., 2006a,b). To understand the mechanism of ethanol teratogenesis we have extended our investigation to the cellular level. As an initial attempt we have determined the changes occurred at the macromolecular level (DNA, RNA and protein) and then focused on specific gene expression of seven transcription factors at the message level.
The macromolecules and the transcription factor mRNAs of the embryos are first determined in zero dpf (freshly collected fertilized eggs with no ethanol treatment), then in 2dpf (zero time of alcohol removal), 4 dpf (2 days of alcohol removal) and 6 dpf (4 days of alcohol removal) to estimate the basal level (zero dpf) as well as their changes with regard to the advancement of embryogenesis (2, 4, and 6 dpf). For DNA and protein, the zero dpf values are determined in embryos at blastula stages (Iwamatsu stage 10) when the dividing cell number is 1000 (http://biol1.bio.nagoya-u.ac.jp:8000/stage10.html). The major reason for that if the embryos of earlier developmental stages (Iwamatsu stages 1-9) are used the present DNA extraction technique(Doyle and Doyle, 1987) is unable to establish a correlation between the data analyzed by spectrophotometer and examined by agarose gel electrophoresis (no visible DNA band seen). For protein, the embryos at stage 10 of development can easily and accurately separate from the yolk under a binocular microscope. For total RNA and the transcription factor mRNAs the embryos with intact chorion of ~ 2 hpf are suitable for basal level estimation. Previously, we have determined that the concentration of ethanol required to cause 50% mortality (LC50) in medaka embryo is 568 mM (calculated on 10 dpf) and the embryonic ethanol concentration is only 15-20 % of the waterborne ethanol at concentrations of 100-400 mM (Wang et al., 2006). Therefore, in the present experiments, we choose two doses of ethanol; 100 mM (0.56 %) as low dose and 400 mM (2.25%) as high dose and compared the effects with control (no ethanol) embryos.
It is evident from the present experiment that all the measured parameters in control, 100 and 400 mM groups of 2 dpf embryos have shown a similar magnitude of response with regard to the embryos at zero dpf (either increase to the same level [transcription factors] or remained unaltered [DNA, RNA and Protein] compared to the embryos of zero dpf), which suggest that the biochemical events in medaka embryogenesis are active in ethanol-treated conditions as in controls (0-2 dpf). Although the rise of DNA, RNA and protein in 2dpf embryos are not significantly different from the embryos of zero dpf, there are reasons to believe that these cellular parameters substantially increase in 2 dpf embryos. Our previous studies (Wang et al., 2006) with the morphological examination indicate that all the control and treated groups at 2 dpf are able to reach advance stages of morphogenesis (controls and 100 mM groups are at stage 24/25 and 400 mM group are at stage 23/24). Our results further indicate that the enhancement of DNA, RNA and protein in embryos are inhibited during recovery period (4 and 6 dpf) in a dose and time-dependent manners (Figures 1A-C). These observations are also support our previous morphological studies (Wang et al., 2006a,b) that developmental abnormalities in cardiovascular, craniofacial and skeletal system in ethanol-treated medaka embryos were more pronounced in late stages of development.
It is well known that ethanol is able to alter cellular DNA content through various mechanisms (Brooks 1997; Shibley and Pennington, 1997; Kido et al., 2005): such as induction of apoptosis in specific regions (Smith 1997; Olney et al., 2002), induction of oxidative stress (Preedy et al., 1999), reduction in cell proliferation rate (Mikami et al., 1997), and inhibition of growth promoting molecules (Henderson et al., 1989). In case of medaka, ethanol may have induced all these events; however, we predict that the presence of ethanol in the early stages of embryonic environment is likely to reduce the rate of cell division more than any other DNA damaging events. Abnormalities in cell division specifically during blastogenesis are responsible for the reduction of embryonic cell numbers and DNA damage which result a delay in embryo development. If we express the DNA data in-terms of cell number considering 2.2 pg DNA/ nucleus (Venkatesh et al., 2000), the calculated number of cells in zero dpf samples (stage 10) will be ~ 20,000 (range 9,827 - 48,991), which is 20-fold higher than the cell numbers (1000 cells in stage 10) predicted (http://biol1.bio.nagoya-u.ac.jp:8000/stage10.html). The reason of overestimation is not clear to us. It is possible that the embryos we have selected as zero dpf have more than 1000 cells or the technique lacks accuracy or both. We have verified the purity of DNA in agarose gel electrophoresis and we did not consider the data for calculation in the absence of clear DNA bands. However, in late stages the data are more consistent (~100,000 cells in 2dpf and ~ 330,000 in 4 and 6 dpf in control embryos), and embryos with 100 mM ethanol (low dose) shows the same nature of changes as in controls while in 400 mM (high dose) group the number of cells appear to be reduced (~ 64,000 in 2dpf, ~160,000 in 4dpf and 230,000 in 6dpf). This analysis indicates that presence of ethanol in the environment is able to slow the cell division rate in medaka eggs and when ethanol is removed from the medium the cell division is enhanced and able to get back to the normal level. In case of RNA, the concentrations at zero dpf and at 2 dpf embryos (treatment phase) are at the same level (Figure 1B), and during recovery phase the embryos treated with 400 mM of ethanol showed reduced RNA content. It is also a known phenomenon that ethanol is able to reduce cellular RNA synthesis in several in vivo and in vitro models (Obe and Ristow, 1979; Guerri and Renau-Piquers, 1997; Lee et al., 1997; Scott et al., 1998). The reduced level of embryonic RNA as observed in medaka embryogenesis by ethanol is the result of either inhibition of specific RNA synthesis or rapid degradation of the maternal RNA stored in the egg or both. A variety of maternal mRNAs are stored in oocytes, transferred to fertilized eggs and played significant role during embryogenesis (Kwon et al., 2001; Dworkin and Dworkin-Rastl, 2005). With regard to protein, the embryonic protein showed most significant effect of ethanol (Figure 1C) while the yolk protein maintains a steady-state (Figure 1D). Although the protein content of embryos was increased in recovery phase, the level of enhancement is less in 400 mM ethanol-treated group compared to the embryos of control and 100 mM group (Figure 1C). It is obvious that during embryogenesis new proteins are synthesized and ethanol as a teratogen must have an effect on total protein content of the embryo which is documented in this investigation. Medaka embryos develop ex utero, therefore, the yolk stores large amount of yolk proteins (vitellogenin) which are utilized during embryogenesis (Hara et al., 2004). Although the etiologic mechanisms are poorly understood, there are reports that ethanol is able to alter protein metabolism at both the tissue specific and whole body levels with effects on protein accretion and loss (Preedy et al., 1999).
We have extended our investigation to mRNA level by analyzing the expression pattern of seven transcription factors viz., emx2, en2, iro3, otx2, shh, wnt1 and zic5, which are expressed in the neural tube of medaka embryo during development (Kage et al., 2004). We have selected these genes with a view that ethanol may influence the expression pattern of these genes by targeting CNS development. Using total RNA extracted from the whole embryo and analyzing by rRT-PCR and qRT-PCR, we are able to demonstrate that mRNA expression of these transcription factors are developmentally regulated; start from undetectable to very low level in early stages (~2 hpf; 0 day), most of them are peaked on day 2 (48 hpf), and then maintained either a steady state or achieved a down regulation (Tables 2 and 3). However, ethanol is unable to induce any alteration in the mRNA expression pattern of these transcription factors either in treatment phase or in recovery phase. We have used β-actin gene (GeneBank Accession S74868) as an internal control and expect that ethanol has minimal effect in the expression of this gene. The expression of β-actin mRNA in medaka and zebrafish embryos during development is relatively constant (Tang et al., 2007; Zhang and Hu, 2007). Therefore the expression of the transcription factor mRNAs investigated in this study might be followed the same developmental rhythm as β-actin (Figure 2), and remained unaltered in ethanol treated embryos during recovery phases (4 and 6 dpf). Among the transcription factors, wnt1 is found to be non-responsive to ethanol in the chick embryo (Ahlgren et al., 2002). Members of the wnt1 gene family of signaling molecules have been implicated in a number of biological roles including the dorso-ventral axis during cleavage stages (Moon and Kimelman, 1998), in patterning the mesoderm of the gastrula (Christian and Moon, 1993; Hoppler et al., 1996; Hoppler and Moon, 1998) and in patterning the neural ectoderm (McGrew et al., 1995, 1997). The wnt pathway works through B-catenin to regulate the expression of en2 and krox-20. As wnt1 expression is unaffected by ethanol, it is therefore expected that en2 expression will not be affected by ethanol during embryogenesis. However, incase of xenopus, expression of otx2, which is recognized as early head-domain marker (Blitz and Cho, 1995; Pannese et al., 1995) and en2, which is identified as a marker of midbrain/hindbrain boundary (Ristoratore et al., 1999), are affected by developmental ethanol exposure (Yelin et al., 2007). Other transcription factors, particularly shh which plays a central role in cell proliferation, differentiation and patterning by activating the Hedgehog signaling pathway has been identified as one of the key molecule that induce FASD in vertebrates including zebrafish (Li et al., 2007), xenopus (Yelin et al., 2007), chicken (Ahlgren et al., 2002), and mouse (Yamada et al., 2005). However, the regulation of shh mRNA expression by ethanol is not identical in all these models; it is up-regulated in the rostral region and expressed abnormally in xenopus embryo (Yelin et al., 2007), down-regulated in chicken (Ahlgren et al., 2002) and zebrafish (Li et al., 2007), and remained unaltered in mouse (Yamada et al. 2005). During embryogenesis, shh is expressed in several organs, such as somites (Johnson et al., 1994; Fan and Tessier-Lavigne, 1994; Fan et al., 1995), limb and fin buds (Krauss et al., 1993; Laufer et al., 1994), teeth (Bitgood and McMahon, 1995; Iseki et al., 1996; Koyama et al., 1996), lung (Bellusci et al., 1997), fin rays (Laforest et al., 1998), and epidermis (Sire and Akimenko, 2004). Therefore, a tissue-specific or species-specific effect of ethanol on shh mRNA expression cannot be ruled out (Yamada et al., 2005). The discrepancies of the results in our system with the others are possibly due to the adoption of different techniques. In our model, we have used total RNA extracted from the whole embryo, and analyzed either by rRT-PCR or by qRT-PCR. These analysis represent an effect of ethanol in the whole embryonic body rather than in a specific organ/region as determined by in situ hybridization (Yelin et al., 2007). Previously, by using these mRNA analysis techniques, we are able to demonstrate the effect of ethanol in the expression pattern of alcohol metabolizing mRNAs (Adh and Aldh) in medaka embryos (Wang et al., 2006, 2007a, b). Another possibility is that the expression of transcription factor mRNAs, if affected by ethanol treatment, may get back to the normal level within 2 dpf. Therefore, mRNA analyses in early time points (during gastrulation or neurulation) may be able to identify an effect of ethanol in expression of these transcription factor mRNAs in medaka embryogenesis.
Although by using current experimental protocol we are able to identify the inhibitory effect of ethanol in DNA, RNA and protein contents of medaka embryo, we are unable to identify an ethanol-sensitive transcription factor mRNA which can be used as a biochemical marker of ethanol toxicity in medaka embryogenesis. Our results indicate that with regard to nucleic acid and protein ethanol inhibits cellular metabolism and growth in medaka embryo in a dose-and time-dependent manner. Both rRT-PCR and qRT-PCR techniques are unable to establish any significant effect of ethanol in transcription factor mRNA expression as shown in other animal model by using in situ hybridization.
Acknowledgments
We are thankful to S. Zhu, a graduate student of the Department of Pharmacology, University of Mississippi, for her considerable technical expertise and generous help in this study. This study was supported partially by the National Center for Natural Product Research, the Environmental Toxicology Research Program of the University of Mississippi and the National Institute on Alcohol Abuse and Alcoholism (Grant Number RO3AA016915). The content is solely the responsibility of the authors and does not necessarily represent the official views of the National Institute on Alcohol Abuse and Alcoholism or the National Institute of Health. This publication was made possible by NIH grant number RR016476 from the MFGN INBRE Program of the National Center for Research Resources.
Footnotes
Publisher's Disclaimer: This is a PDF file of an unedited manuscript that has been accepted for publication. As a service to our customers we are providing this early version of the manuscript. The manuscript will undergo copyediting, typesetting, and review of the resulting proof before it is published in its final citable form. Please note that during the production process errors may be discovered which could affect the content, and all legal disclaimers that apply to the journal pertain.
References
- Abel EL, Hannigan JH. Maternal risk factors in fetal alcohol syndrome: provocative and permissive influences. Neurotoxicol Teratol. 1985;17:445–462. doi: 10.1016/0892-0362(95)98055-6. [DOI] [PubMed] [Google Scholar]
- Ahlgren SC, Thakur V, Bronner-Fraser M. Sonic hedgehog rescues cranial neural creast from cell death induced by ethanol exposure. Proc Nat Acad Sci. 2002;99:10476–10481. doi: 10.1073/pnas.162356199. [DOI] [PMC free article] [PubMed] [Google Scholar]
- Arenzana FJ, Carvan MJ, Aijon J, Sanchez-Gonzalez R, Arevalo R, Porteros A. Teratogenic effects of ethanol exposure on zebrafish visual system development. Neurotoxicol Teratol. 2006;28:342–328. doi: 10.1016/j.ntt.2006.02.001. [DOI] [PubMed] [Google Scholar]
- Bellusci S, Furuta Y, Rush MG, Henderson R, Winner G, Hogan BL. Involvement of sonic hedgehog (Shh) in mouse embryonic lung growth and morphogenesis. Development. 1997;124:53–63. doi: 10.1242/dev.124.1.53. [DOI] [PubMed] [Google Scholar]
- Bilotta J, Barnett JA, Hancock L, Saszik S. Ethanol exposure alters zebrafish development: A novel model of fetal alcohol syndrome. Neurotox Terato. 2004;26:737–743. doi: 10.1016/j.ntt.2004.06.011. [DOI] [PubMed] [Google Scholar]
- Bitgood MJ, McMahon AP. Hedgehog and Bmp genes are coexpressed in many diverse sites of cell-cell interaction in the mouse embryo. Dev Biol. 1995:126–138. doi: 10.1006/dbio.1995.0010. [DOI] [PubMed] [Google Scholar]
- Blitz IL, Cho KW. Anterior nuerectoderm is progressively induced during gastrulation: the role of the xenopus homeobox gene orthodenticle. Development. 1995;121:993–1004. doi: 10.1242/dev.121.4.993. [DOI] [PubMed] [Google Scholar]
- Brooks PJ. DNA damage, DNA repair, and alcohol toxicity-a review. Alcohol Clin Exp Res. 1997;21:1073–1082. [PubMed] [Google Scholar]
- Carvan MJ, III, Loucks E, Weber DN, Williams FE. Ethanol effects on the developing zebrafish: neurobehavior and skeletal morphogenesis. Neurotox Terato. 2004;26:757–768. doi: 10.1016/j.ntt.2004.06.016. [DOI] [PubMed] [Google Scholar]
- Christian JL, Moon RT. Interactions between Xwnt-8 and Spemann organizer signaling pathways generate dorso-ventral pattern in the embryonic mesoderm of xenopus. Genes Dev. 1993;11:3286–3305. doi: 10.1101/gad.7.1.13. [DOI] [PubMed] [Google Scholar]
- Cudd TA. Animal model systems for the study of alcohol teratology. Exp Biol Med. 2005;230:389–393. doi: 10.1177/15353702-0323006-06. [DOI] [PubMed] [Google Scholar]
- Dasmahapatra AK, Wang X, Haasch ML. Expression of Adh8 mRNA is developmentally regulated in Japanese medaka (Oryzias latipes) Comp Biochem Physiol B. 2005;140:657–664. doi: 10.1016/j.cbpc.2005.01.007. [DOI] [PubMed] [Google Scholar]
- Doyle JJ, Doyle JL. A rapid DNA isolation procedure from small quantities of fresh leaf tissues. Phytochem Bull. 1987;19:11–15. [Google Scholar]
- Dworkin MB, Dworkin-Rastl E. Functions of maternal mRNA in early development. Mol Reprod Dev. 2005;26:261–297. doi: 10.1002/mrd.1080260310. [DOI] [PubMed] [Google Scholar]
- Fan CM, Tessier-Lavigne MT. Patterning of mammalian somites by surface ectoderm and notochord : evidence for sclerotome induction in a hedgehog homolog. Cell. 1994;79:1175–1186. doi: 10.1016/0092-8674(94)90009-4. [DOI] [PubMed] [Google Scholar]
- Fan CM, Porter JA, Chiang C, Chang DT, Beachy PA, Tessier-Lavigne M. Long range sclerotome induction by sonic hedgehog:direct role of the amino-terminal cleavage product and modulation by the cyclic AMP signaling pathway. Cell. 1995;81:457–465. doi: 10.1016/0092-8674(95)90398-4. [DOI] [PubMed] [Google Scholar]
- Furutani-Seiki M, Wittbrodt J. Medaka and zebrafish: an evolutionary twin study. Mech Dev. 2004;121:629–637. doi: 10.1016/j.mod.2004.05.010. [DOI] [PubMed] [Google Scholar]
- Guerri C, Renau-Piqueras J. Alcohol, astroglia, and brain development. Mol Neurobiol. 1997;15:65–81. doi: 10.1007/BF02740616. [DOI] [PubMed] [Google Scholar]
- Hara T, Hagino S, Hosokawa S. Quantification of vitellogenin in several developmental stages of medaka (Oryzias latipes) S-rR strain. Environ Sci. 2004;11:221–230. [PubMed] [Google Scholar]
- Henderson GI, Baskin GS, Horbach J, Porter P, Schenker S. Arrest of epidermal growth factor-dependent growth in fetal hepatocytes after ethanol exposure. J Clin Invest. 1989;84:1287–1294. doi: 10.1172/JCI114296. [DOI] [PMC free article] [PubMed] [Google Scholar]
- Hoppler S, Brown JD, Moon RT. Expression of a dominant-negative Wnt blocks induction of MyoD in xenopus embryos. Genes Dev. 1996;10:2805–2817. doi: 10.1101/gad.10.21.2805. [DOI] [PubMed] [Google Scholar]
- Hoppler S, Moon RT. BMP-2/-4and Wnt-8 coopratively pattern the xenopus mesoderm. Mech Dev. 1998;71:119–129. doi: 10.1016/s0925-4773(98)00004-5. [DOI] [PubMed] [Google Scholar]
- Iseki S, Araga A, Ohuchi H, Nohno T, Yoshioka H, Hayashi F, Noji S. Sonic hedge is expressed in epithelial cells during development of whisker, hair and tooth. Biochem Biophys Res Commun. 1996;218:668–693. doi: 10.1006/bbrc.1996.0123. [DOI] [PubMed] [Google Scholar]
- Iwamatsu T. Stages of normal development in the medaka Oryzias latipes. Mech Dev. 2004;121:605–618. doi: 10.1016/j.mod.2004.03.012. [DOI] [PubMed] [Google Scholar]
- Johnson RL, Laufer E, Riddle RD, Tabin C. Ectopic expression of sonic hedgehog alters dorsal-ventral patterning of somites. Cell. 1994;79:1165–1173. doi: 10.1016/0092-8674(94)90008-6. [DOI] [PubMed] [Google Scholar]
- Kage T, Takeda H, Yasuda T, Maruyama K, Yamamoto N, Yoshimoto M, Araki K, Inohaya K, Okamoto H, Yasumasu S, Watanabe K, Ito H, Ishikawa Y. Morphogenesis and regionalization of the medaka embryonic brain. J Comp Neurol. 2004;476:219–239. doi: 10.1002/cne.20219. [DOI] [PubMed] [Google Scholar]
- Kido R, Sato I, Tsuda S. Detection of in vivo DNA damage induced by ethanol in multiple organs of pregnant mice using the alkaline single cell gel electrophoresis (comet) assay. J Vet Med Sci. 2006;68:41–47. doi: 10.1292/jvms.68.41. [DOI] [PubMed] [Google Scholar]
- Koyama E, Yamaai T, Iseki S, Ohuchi H, Nohno T, Yoshioka H, Hayashi Y, Leatherman JL, Golden EB, Noji S, Pacifici M. Polarizing activity, sonic hedgehog, and tooth development in embryonic and postnatal mouse. Dev Dyn. 1996;206:59–72. doi: 10.1002/(SICI)1097-0177(199605)206:1<59::AID-AJA6>3.0.CO;2-#. [DOI] [PubMed] [Google Scholar]
- Krauss S, Concordet JP, Ingham PW. A functionally conserved homolog of the drosophilla segment polarity gene hh is expressed in tissues with polarizing activity in zebrafish embryos. Cell. 1993;75:1431–1444. doi: 10.1016/0092-8674(93)90628-4. [DOI] [PubMed] [Google Scholar]
- Kwon JY, Prat F, Randall C, Tyler CR. Molecular characterization of putative yolk processing enzymes and their expression during oogenesis and embryogenesis in rainbow trout (Oncorhynchus mykiss) Biol Reprod. 2001;65:1701–1709. doi: 10.1095/biolreprod65.6.1701. [DOI] [PubMed] [Google Scholar]
- Laforest L, Brown CW, Poleo G, Geraudie J, Tada M, Ekker M, Akimenko M-A. Involvement of the sonic hedgehog, patched 1, and Bmp 2 genesin patterning of the zebrafish dermal fin rays. Development. 1998;125:4175–4184. doi: 10.1242/dev.125.21.4175. [DOI] [PubMed] [Google Scholar]
- Laufer E, Nelson CE, Johnson RL, Morgan BA, Tabin C. Sonic hedgehog and Fgf-4 act through a signaling cascade and feedback loop to integrate and patterning of the developing limb bud. Cell. 1994;79:993–1003. doi: 10.1016/0092-8674(94)90030-2. [DOI] [PubMed] [Google Scholar]
- Lee IJ, Soh Y, Song BJ. Molecular characterization of fetal alcohol syndrome using mRNA differential display. Biochem Biophysic Res Commun. 1997;240:309–313. doi: 10.1006/bbrc.1997.7655. [DOI] [PubMed] [Google Scholar]
- Li Y-X, Yang H-T, Zdanowicz M, Sicklick JK, Qi Y, Camp TJ, Diehl AM. Fetal alcohol exposure impairs hedgehog cholesterol modification and signaling. Lab Inv. 2007;87:231–240. doi: 10.1038/labinvest.3700516. [DOI] [PubMed] [Google Scholar]
- Lockwood B, Bjerke S, Kobayashi K, Guo S. Acute effects of alcohol on larval zebrafish: a genetic system for large-scale screening. Pharmacol Biochem Behav. 2004;77:647–654. doi: 10.1016/j.pbb.2004.01.003. [DOI] [PubMed] [Google Scholar]
- McGrew LL, Lai CJ, Moon RT. specification of the anterioposteriorneural axisthrough synergestic interaction of the Wnt signaling cascade with nogginand follistatin. Dev Biol. 1995;172:337–342. doi: 10.1006/dbio.1995.0027. [DOI] [PubMed] [Google Scholar]
- McGrew LL, Hoppler S, Moon RT. Wnt and FGF pathways cooperatively pattern anterioposterior neural ectoderm in xenopus. Mech Dev. 1997;69:105–114. doi: 10.1016/s0925-4773(97)00160-3. [DOI] [PubMed] [Google Scholar]
- Mikami K, Haseba T, Ohno Y. Ethanol induces transient arrest of cell division (G2 + M block) followed by G0 /G1 block: dose effects of short-and longer-term ethanol exposure on cell cycle and cell functions. Alcohol Alcohol. 1997;32:145–152. doi: 10.1093/oxfordjournals.alcalc.a008248. [DOI] [PubMed] [Google Scholar]
- Moon RT, Kimelman D. From cortical rotation to organizergene expression: toward a molecular explanationof axis specificationin xenopus. Bioessays. 1998;20:536–545. doi: 10.1002/(SICI)1521-1878(199807)20:7<536::AID-BIES4>3.0.CO;2-I. [DOI] [PubMed] [Google Scholar]
- Obe G, Ristow H. Mutagenic, carcinogenic and teratogenic effects of alcohol. Mutat Res. 1979;65:229–259. doi: 10.1016/0165-1110(79)90004-6. [DOI] [PubMed] [Google Scholar]
- Olney JW, Tenkova T, Dikranian K, Muglia LJ, Jermakowicz WJ, D’Sa C, Roth KA. Ethanol-induced caspase-3 activation in the in vivo developing mouse brain. Neurobiol Dis. 2002;9:205–219. doi: 10.1006/nbdi.2001.0475. [DOI] [PubMed] [Google Scholar]
- Oxendine SL, Cowden J, Hinton DE, Padilla S. Vulnerable windows for developmental ethanol toxicity in the Japanese medaka fish (Oryzias latipes) Aquat Toxicol. 2006;80:396–404. doi: 10.1016/j.aquatox.2006.10.007. [DOI] [PubMed] [Google Scholar]
- Pannese M, Polo C, Andreazzoli M, Vignali R, Kablar B, Barsacchi G, Boncinelli E. The xenopus homologue of Otx2 is a maternal homeobox gene that demarcates and specifies anterior body regions. Development. 1995;121:707–720. doi: 10.1242/dev.121.3.707. [DOI] [PubMed] [Google Scholar]
- Preedy VR, Fibol M, Reilly ME, Patel VB, Richardson PJ, Peters TJ. Protein metabolism in alcoholism: effects on specific tissues and the whole body. Nutrition. 1999;15:604–608. doi: 10.1016/s0899-9007(99)00096-9. [DOI] [PubMed] [Google Scholar]
- Randall CL, Anton RF, Becker HC. Alcohol, pregnancy, and prostaglandins. Alcohol Clin Exp Res. 1987;11:32–36. doi: 10.1111/j.1530-0277.1987.tb01256.x. [DOI] [PubMed] [Google Scholar]
- Reimers MJ, Flocktom AR, Tanguay RL. Ethanol-and acetaldehyde-mediated developmental toxicity in zebrafish. Neurotox Terato. 2004;26:769–781. doi: 10.1016/j.ntt.2004.06.012. [DOI] [PubMed] [Google Scholar]
- Riley EP, McGee CL. Fetal alcohol spectrum disorders: an overview with emphasis on changes in brain and behavior. Exp Biol Med. 2005;230:357–365. doi: 10.1177/15353702-0323006-03. [DOI] [PubMed] [Google Scholar]
- Ristoratore F, Carl M, Deschet K, Richard-Parpaillon L, Boujard D, Wittbrodt J, Chourrout D, Bourrat F, Joly J. The midbrain-hindbrain boundary genetic cascade is activated ectopically in the diencephalon in response to the widespresd expression of one of its components, the medaka gene Ol-eng2. Development. 1999;126:3769–3779. doi: 10.1242/dev.126.17.3769. [DOI] [PubMed] [Google Scholar]
- Scott HC, Sun GY, Zoeller RT. Prenatal ethanol exposure selectively reduces the mRNA encoding alpha-1 thyroid hormone receptor in fetal rat brain. Alcohol Clin Exp Res. 1998;22:2111–2117. [PubMed] [Google Scholar]
- Sire J-Y, Akimenko M-A. Scale development in fish: a review, with description of sonic hedgehog (shh) expression in the zebrafish (Danio rerio) Int J Dev Biol. 2004;48:233–247. [PubMed] [Google Scholar]
- Smith SM. Alcohol-induced cell death in the embryo. Alcohol Health Res World. 1997;21:287–297. [PMC free article] [PubMed] [Google Scholar]
- Shibley IA, jr, Pennington SN. Metabolism and mitotic changes associated with the fetal alcohol syndrome. Alcohol Alcohol. 1997;32:423–434. doi: 10.1093/oxfordjournals.alcalc.a008277. [DOI] [PubMed] [Google Scholar]
- SuliK K. Genesis of alcohol-induced craniofacial dysmorphism. Exp Biol Med. 2005;230:366–375. doi: 10.1177/15353702-0323006-04. [DOI] [PubMed] [Google Scholar]
- Tang R, Dodd A, Lai D, McNabb WC, Love DR. Validation of zebrafish (Danio rerio) reference genes for quantitative real-time RT-PCR normalization. Acta Biochem Biophys Sin. 2007;39:384–390. doi: 10.1111/j.1745-7270.2007.00283.x. [DOI] [PMC free article] [PubMed] [Google Scholar]
- Venkatesh B, Gilligan P, Brenner S. Fugu: a compact vertebrate reference genome. FEBS Lett. 2000;476:3–7. doi: 10.1016/s0014-5793(00)01659-8. [DOI] [PubMed] [Google Scholar]
- Wang X. Master’s Thesis. Department of Pharmacology University of Mississippi; 2006a. Ethanol toxicity in Japanese medaka embryogenesis: a mechanistic study. [Google Scholar]
- Wang X, Williams E, Haasch ML, Dasmahapatra AK. Japanese medaka (Oryzias latipes): developmental model for the study of alcohol teratology. Birth Def Res. 2006b;77B:29–39. doi: 10.1002/bdrb.20072. [DOI] [PubMed] [Google Scholar]
- Wang X, Zhu S, Khan IA, Dasmahapatra AK. Etanol attenuates Aldh9 mRNA expression in Japanese medaka (Oryzias latipes) embryogenesis. Comp Biochem Physiol Part B. 2007a;146:357–363. doi: 10.1016/j.cbpb.2006.11.006. [DOI] [PubMed] [Google Scholar]
- Wang X, Khan IA, Dasmahapatra AK. Developmental regulation of ethanol metabolizing enzyme mRNAexpression in Japanese medaka (Oryzias latipes) In: Ostrovskiy MH, editor. In Leading-Edge messenger RNA research communication. chapter 11. Nova publishers; 2007b. pp. 169–181. [Google Scholar]
- West JR, Chen WJ, Pantazis NJ. Fetal alcohol syndrome: the vulnerability of the developing brain and possible mechanisms of damage. Metab Brain Dis. 1994;9:291–322. doi: 10.1007/BF02098878. [DOI] [PubMed] [Google Scholar]
- Wittbrodt J, Shima A, Schart M. Medaka-a model organism from the far east. Nature Rev Genetics. 2002;3:53–64. doi: 10.1038/nrg704. [DOI] [PubMed] [Google Scholar]
- Yamada Y, Nagase T, Nagase M, Koshima I. Gene expression changes of sonic hedgehog signaling cascade in a mouse embryonic model of fetal alcohol syndrome. J Craniofac Surg. 2005;16:1055–1061. doi: 10.1097/01.scs.0000183470.31202.c9. [DOI] [PubMed] [Google Scholar]
- Yelin R, Kot H, Yelin D, Fainsod A. Early molecular effects of ethanol during vertebrate embryogenesis. Differentiation. 2007;75:393–403. doi: 10.1111/j.1432-0436.2006.00147.x. [DOI] [PubMed] [Google Scholar]
- Zhang Z, Hu J. Development and validation of endogenous reference genes for expression profiling of medaka (Oryzias latipes) exposed to endocrine disrupting chemicals by quantitative real-time RT-PCR. Toxicol Sci. 2007;95:356–368. doi: 10.1093/toxsci/kfl161. [DOI] [PubMed] [Google Scholar]