Abstract
NAD(P)H:quinone oxidoreductase 1 (NQO1) is a two-electron reductase that detoxifies quinones derived from the oxidation of phenolic metabolites of benzene. A polymorphism in NQO1, a C609T substitution, has been identified, and individuals homozygous for this change (T/T) have no detectable NQO1. Exposed workers with a T/T genotype have an increased risk of benzene hematotoxicity. This finding suggests NQO1 is protective against benzene toxicity, which is difficult to reconcile with the lack of detectable NQO1 in human bone marrow. The human promyeloblastic cell line, KG-1a, was used to investigate the ability of the benzene metabolite hydroquinone (HQ) to induce NQO1. A concentration-dependent induction of NQO1 protein and activity was observed in KG-1a cells cultured with HQ. Multiple detoxification systems, including NQO1 and glutathione protect against benzene metabolite-induced toxicity. Indeed, exposure to a noncytotoxic concentration of HQ induced both NQO1 and soluble thiols and protected against HQ-induced apoptosis. NQO1 protein and activity increased in wild-type human bone marrow cells (C/C) exposed to HQ, whereas no NQO1 was induced by HQ in bone marrow cells with the T/T genotype. Intermediate induction of NQO1 by HQ was observed in heterozygous bone marrow cells (C/T). NQO1 also was induced by HQ in wild-type (C/C) human bone marrow CD34+ progenitor cells. Our data suggest that failure to induce functional NQO1 may contribute to the increased risk of benzene poisoning in individuals homozygous for the NQO1 C609T substitution (T/T).
Exposure to benzene produces hematotoxicities, including pancytopenia, aplastic anemia, myelodysplasia, and acute myeloid leukemia (1, 2). Humans are exposed to benzene via occupational exposure or environmentally via contact with cigarette smoke, gasoline emissions, or products of incomplete combustion (3). Once absorbed, benzene is metabolized by CYP 2E1 to yield phenol, hydroquinone (HQ), catechol (CAT), and 1,2,4-benzenetriol (4). These metabolites accumulate in the bone marrow (5) where they undergo autoxidation (6) or activation by peroxidases (7, 8) to yield the corresponding quinones, which are believed to be among the ultimate toxic metabolites of benzene (9). NAD(P)H:quinone oxidoreductase (NQO1) detoxifies benzene-derived quinones via two-electron reduction, preventing redox cycling (10) and covalent modification of cellular components (11, 12).
Within the bone marrow both hematopoietic progenitor cells (13, 14) and bone marrow stromal cells (15, 16) are potential targets of benzene toxicity. Evidence suggests that toxicity in the progenitor compartment is involved in the development of the hematopoietic disorders associated with benzene exposure (17–20). HQ induces apoptosis in human promyelocytic leukemia and primary bone marrow progenitor cells (21, 22). The susceptibility of these cells to benzene metabolite-induced toxicity has been attributed in part to their high expression of myeloperoxidase (23, 24) and lack of detectable expression of NQO1 (25–27). The soluble thiol glutathione (GSH) also affects the susceptibility of hematopoietic cells to benzene metabolites. The importance of GSH and NQO1 in the protection of rat and murine bone marrow stromal cells against HQ has been demonstrated (26, 28, 29), and Li et al. (30) showed that GSH may be more important than NQO1 for protection against HQ in two human hematopoietic cell lines.
Myriad xenobiotics, including the benzene metabolites HQ, CAT, and benzoquinone (BQ) (31, 32), have been shown to induce NQO1 (33–36). Recently, a polymorphism in NQO1 has been characterized (37–39). This polymorphism is a C-to-T substitution at position 609 of NQO1 cDNA, which codes for a proline-to-serine change at residue 187. In cells with a T/T genotype NQO1 activity was not detected, and lack of activity corresponded to a lack of NQO1 protein (37, 40). The prevalence of the T/T genotype varies among ethnic groups (4–20%), with the highest prevalence occurring in Asian populations (38). A recent case-control study of benzene-exposed workers in China revealed increased risk of hematotoxicity in individuals with the T/T NQO1 genotype (41), suggesting that NQO1 protects against benzene toxicity.
In this paper we present data describing a potential mechanism underlying NQO1-mediated protection against benzene-derived quinones in human bone marrow. A protective role for NQO1 against benzene-derived quinones in bone marrow in situ is difficult to reconcile with our observation that freshly isolated bone marrow mononuclear and progenitor cells fail to express NQO1. We propose that exposure to benzene metabolites induces NQO1 in human bone marrow, which represents one of the protective mechanisms against quinone-induced damage. NQO1 is not induced in individuals carrying the T/T genotype, which may contribute to the increased susceptibility of such individuals to benzene hematotoxicity.
MATERIALS AND METHODS
Chemicals.
HQ, CAT, Histopaque 1077, etoposide, staurosporine, Hoechst 33342, and propidium iodide were obtained from Sigma. All other reagents were of analytical grade or better. trans, trans-Muconaldehyde (MUC) was synthesized as described (42). Cell culture media and supplements were obtained from GIBCO/BRL.
KG-1a Cell Culture.
KG-1a human promyeloblastic leukemia cells (American Type Culture Collection) were cultured in Iscove’s modified Dulbecco’s medium supplemented with 20% FBS (Summit Biotechnology, Ft. Collins, CO), 20 units/ml penicillin, 20 μg/ml streptomycin, 58.4 μg/ml l-glutamine, and 20 μM sodium citrate under a humidified atmosphere (5% CO2/air) at 37°C. KG-1a cells were treated (0.5 × 10⁶ cells/ml) with HQ or CAT for 24 h. Cells were collected, washed with PBS, resuspended in ice-cold buffer (25 mM Tris⋅HCl, 125 mM sucrose, 1 μM FAD, pH 7.4), and sonicated on ice for 5 sec. The protein content of sonicates was determined by the method of Lowry et al. (43).
Spectrophotometric Determination of Soluble Thiols.
Soluble thiols were measured spectrophometrically after reaction with 5,5′ dithio-bis{2-nitrobenzoic acid} (DTNB, Ellman’s reagent, Sigma) as modified from the method of Sedlak and Lindsay (44). Briefly, cells were collected and lysed in ddH2O, and protein was determined by Lowry (43). Protein was precipitated with 5% trichloroacetic acid. After the addition of 2.0 ml of 0.4 M Tris⋅HCl, pH 8.9 to 1.0 ml of acid-precipitated lysate, 0.1 ml of DTNB (3.96 mg/ml methanol) was added to each sample. Samples were measured spectrophotometrically at 412 nm 5 min after addition of DTNB.
KG-1a Apoptosis and Protection.
KG-1a cells were pretreated in fresh media (0.5 × 10⁶ cells/ml) with 10 μM HQ or vehicle control (PBS) for 24 h. After pretreatment, KG-1a cells were counted, resuspended in fresh media (0.5 × 10⁶ cells/ml), and treated with HQ, etoposide, MUC, staurosporine, or DMSO (vehicle control) for 12 h. The percentage of apoptotic cells was determined according to morphological criteria as described (21).
Field Inversion Gel Electrophoresis.
Cells were collected, embedded in 1% agarose plugs, and incubated at 55°C in NDS buffer (0.5 M EDTA/10 mM Tris⋅HCl/1% lauroylsarcosine, pH 9.5) containing 1 mg/ml protease for 24–48 h. Plugs were rinsed in TE8 loaded into a 1% agarose gel, and field inversion electrophoresis was performed for 8 h at 200 V, 14°C with a forward field linear time gradient of 2.4–24 sec and a reverse field linear time gradient of 0.8–8 sec.
Bone Marrow Culture.
Human bone marrow was aspirated from healthy adult volunteers with informed consent according to University of Colorado Health Sciences Center Institutional Review Board-approved procedures. The mononuclear fraction of bone marrow aspirates was obtained by Ficoll (Histopaque 1077) purification, washed with PBS + 1% BSA, and cultured (875,000 cells/ml) in RPMI medium 1640 supplemented with 20% FBS, 20 units/ml of penicillin, 20 μg/ml streptomycin, 58.4 μg/ml l-glutamine, and 20 μM sodium citrate. Approximately 20 × 106 freshly purified bone marrow cells were collected from each bone marrow aspirate to serve as a control for culture conditions. Cells were treated with HQ or CAT immediately after suspension in culture media. Cells were collected 24 h after treatment, and sonicates were prepared as described above. Attached cells were not included in analyses.
CD34+ Cells.
CD34+ cells were isolated by using the VarioMacs separation system as directed by the manufacturer (Miltenyi Biotec, Auburn, CA) as described (21). Immediately after isolation, the percentage of cells expressing CD34 was determined by flow cytometry. Cells used in these studies were 88%, 89%, and 97% CD34+. Isolated CD34+ cells were resuspended in MyeloCult H5100 media (StemCell Technologies, Vancouver) + 1 μM hydrocortisone + 30 units/ml of penicillin, 30 μg/ml streptomycin, 87.6 μg/ml l-glutamine, and 30 μM sodium citrate (0.6–1 × 10⁵ cells/ml) and cultured under a humidified atmosphere (5% CO2/air) at 37°C. CD34+ cells were treated with HQ immediately and collected 18 h after treatment, and sonicates were prepared as described above and concentrated with 3-kDa microconcentrator filters (Amicon, Austin, TX). Attached cells were not included in analyses.
NQO1 Activity.
NQO1 activity of cell sonicates was assayed according to Ernster (45) as modified by Benson et al. (33) as described (37). NQO1-specific activity was calculated based on the dicoumarol-sensitive reduction of 2,6-dichlorophenol-indophenol as monitored spectrophotometrically at 600 nm.
NQO1 Immunoblot Analysis.
Cell sonicate containing 50 μg (5 μg for CD34+ cells) cellular protein/sample were tested for immunoreactivity against an anti-huNQO1 mouse mAb (A180) as described (46). A180 recognizes both recombinant protein generated from human cDNA containing the C-to-T substitution at position 609 as well as wild-type human protein.
PCR-Restriction Fragment Length Polymorphism (RFLP) Determination of NQO1 Genotype.
The genotypes of bone marrow donors and the KG-1a cell line were obtained by PCR-RFLP analysis of genomic DNA according to the methods of Traver et al. (37).
Statistics.
Data were analyzed by one-way ANOVA and Dunnett’s t test for comparison of multiple samples with a single control or F test for ANOVA followed by the t test for comparison of two samples with unequal variance.
RESULTS
Human Bone Marrow Mononuclear Cells Fail to Express NQO1 Protein.
No NQO1 protein or activity was detected in freshly isolated human bone marrow mononuclear (C/C, n = 3; C/T, n = 3; T/T, n = 2) or progenitor (C/C, n = 2) cells from any of the donors regardless of genotype at position 609 of the NQO1 coding region.
Benzene Metabolites Induce NQO1 Protein and Activity in KG-1a Cells.
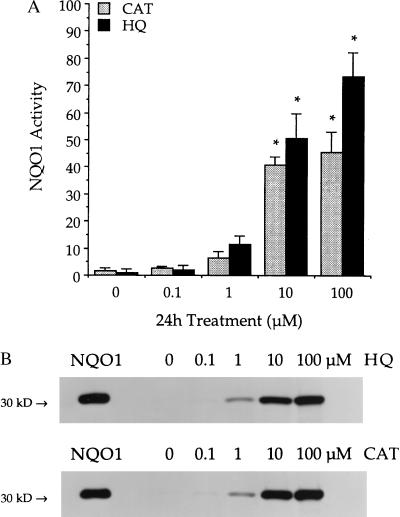
KG-1a cells were found to be heterozygous for the C609T substitution by using PCR-restriction fragment length polymorphism analysis. NQO1 activity was less than 5 nmol/min per mg in untreated KG-1a cells, and no NQO1 protein or message could be detected by immunoblot or Northern analysis, respectively. KG-1a cells treated with HQ or CAT showed induction of NQO1 activity and protein (Fig. 1). NQO1 message also increased in KG-1a cells exposed to HQ (data not shown). Activities were significantly (P ≤ 0.05) induced after 24-h treatment with either 10 μM HQ (50.6 ± 9.3 nmol/min per mg), 100 μM HQ (73.5 ± 8.8 nmol/min per mg), 10 μM CAT (40.9 ± 2.9 nmol/min per mg), or 100 μM CAT (45.7 ± 7.5 nmol/min per mg). The induction of NQO1 protein as measured by immunoblot analysis was consistent with NQO1 activity values for all samples.
Figure 1.
NQO1 induction in KG-1a cells exposed to benzene metabolites. (A) NQO1 activity was measured after treatment with 0–100 μM HQ (black bars) or 0–100 μM CAT (gray bars) for 24 h. Activities are reported as nmol 2,6-dichlorophenol-indophenol reduced/min per mg cellular protein. Data are presented as mean ± SD (n = 3). ∗, Significantly greater than control (P ≤ 0.05). (B) NQO1 protein was determined by immunoblot analysis after above treatments. Purified recombinant human NQO1 protein (5 ng) was included as a standard (NQO1). Immunoblots are representative of three separate experiments for each compound.
HQ Induces Soluble Thiols in KG-1a Cells.
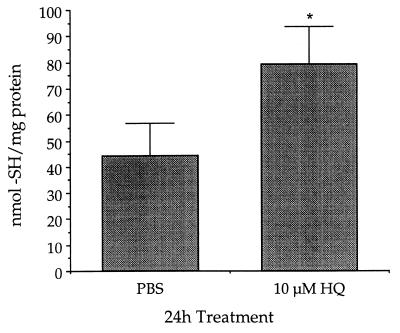
KG-1a cells treated with 10 μM HQ for 24 h contained 1.8-fold more soluble thiols than control cells. KG-1a cells treated with vehicle control (PBS) contained 44 ± 13 nmol thiols/mg protein whereas KG-1a cells exposed to HQ contained 79 ± 14 nmol thiols/mg protein (Fig. 2).
Figure 2.
Pretreatment with HQ increased soluble thiols in KG-1a cells. KG-1a cells were cultured with 10 μM HQ or vehicle control (PBS) for 24 h. Data are presented as mean nmol thiol/mg protein ± SD (n = 5). ∗, Significantly greater than control (P ≤ 0.05).
Pretreatment with HQ Protects Against HQ-Induced Apoptosis in KG-1a Cells.
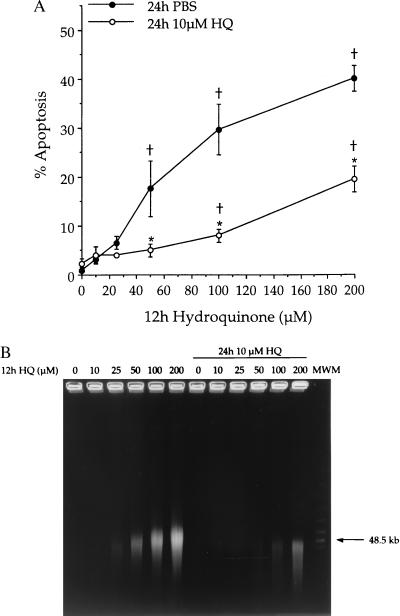
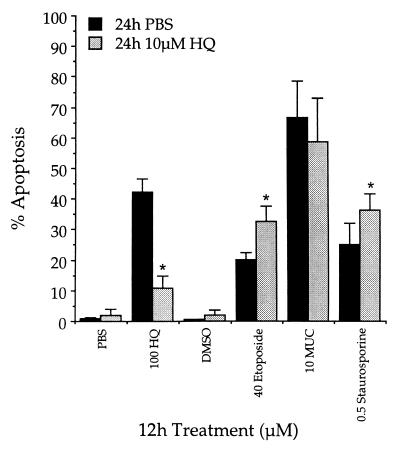
Exposure to increasing concentrations of HQ for 12 h induced apoptosis in KG-1a cells (Fig. 3, ●). When both NQO1 and soluble thiols were induced by a 24-h pretreatment with 10 μM HQ, significant reduction in the percentage of apoptotic cells induced by subsequent exposure to HQ was observed (Fig. 3, ○). No significant apoptosis was observed after pretreatment with 10 μM HQ. The appearance of DNA large fragments, a biochemical indicator of apoptosis (47, 48), was consistent with data obtained by using morphological criteria (Fig. 3B). To rule out the possibility that HQ exposure resulted in a general protection against apoptosis, similar experiments were performed by using a diverse group of compounds that induced apoptosis in KG-1a cells. Exposure to HQ did not protect against apoptosis induced by subsequent 12-h treatment with MUC and slightly potentiated the apoptosis induced by subsequent 12-h treatments with either etoposide or staurosporine (Fig. 4).
Figure 3.
Protection against HQ-induced apoptosis in KG-1a cells after induction of NQO1. Cells were pretreated with 10 μM HQ (○) or vehicle control (PBS, ●) for 24 h. Subsequently, cells were treated with HQ (0–200 μM) for 12 h after which apoptosis was measured. (A) Apoptosis was determined based on morphological criteria. Data are presented as mean percentage apoptotic cells ± SD (n = 3). †, Percentage of apoptosis is significantly greater than control (P ≤ 0.05). ∗, Protection is significant (P ≤ 0.05). (B) Chromatin degradation into large fragments was measured by field inversion gel electrophoresis. Gel is representative of three separate experiments.
Figure 4.
Pretreatment with HQ failed to protect against apoptosis induced by compounds other than HQ. KG-1a cells were pretreated with 10 μM HQ or vehicle control for 24 h. Subsequently, cells were exposed to various inducers of apoptosis for 12 h. Data are presented as mean percentage apoptotic cells ± SD (n = 4). ∗, Significantly different from that observed with the corresponding treatment in cells pretreated with PBS (P ≤ 0.05).
The Presence of the NQO1 Polymorphism Affects NQO1 Induction in Primary Human Bone Marrow Cells.
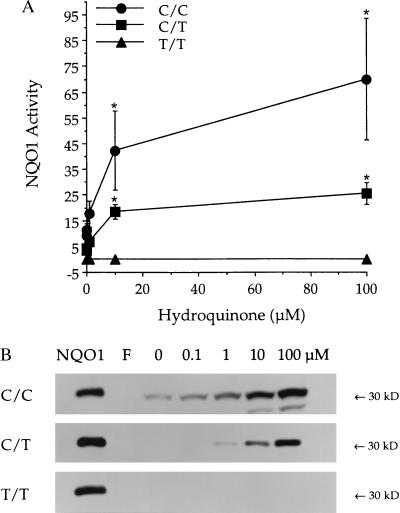
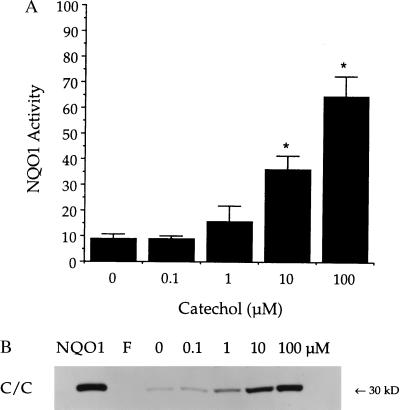
In wild-type bone marrow mononuclear cells (C/C), HQ induced NQO1 activity and protein. NQO1 activity was only marginally induced by culture conditions in the absence of treatment with any benzene metabolites (10.0 ± 2.3 nmol/min per mg). Induction of NQO1 activity in C/C bone marrow was statistically significant (P ≤ 0.05) after culture with 10 μM HQ (48.0 ± 9.8 nmol/min per mg) or 100 μM HQ (79.5 ± 11.8 nmol/min per mg) for 24 h (Fig. 5A). No NQO1 activity was detected in cultured bone marrow cells from three healthy donors with the T/T NQO1 genotype, either before or after culture with HQ (Fig. 5A). Bone marrow cells from three healthy donors with the C/T NQO1 genotype showed induction of NQO1 activity after culture with HQ intermediate (10 μM HQ, 18.5 ± 2.8 nmol/min per mg; 100 μM HQ, 25.6 ± 4.2 nmol/min per mg) to that observed in C/C versus T/T cells (Fig. 5A). CAT also induced NQO1 activity in C/C bone marrow, although to a slightly lesser degree than that induced by HQ (Fig. 6A). The induction of NQO1 protein as measured by immunoblot analysis was consistent with NQO1 activity values in all cases (Figs. 5B and 6B).
Figure 5.
Effect of the C609T substitution on induction of NQO1 by HQ in human bone marrow cells. (A) NQO1 activity was measured after bone marrow cells C/C (●), C/T (■), or T/T (▴) at position 609 in the coding region of NQO1 were treated with 0–100 μM HQ for 24 h. Activities are reported as nmol 2,6-dichlorophenol-indophenol reduced/min per mg cellular protein. Data are presented as mean ± SD (n ≥ 3). ∗, Significantly greater than control (P ≤ 0.05). (B) NQO1 protein was measured by immunoblot analysis. Representative immunoblots of NQO1 protein in HQ-treated cells with the C/C, C/T, or T/T genotype are shown (n ≥ 3 for each genotype). Purified recombinant human NQO1 protein (5 ng) was included as a standard (NQO1). Freshly isolated bone marrow cells (F) lacked detectable NQO1 protein in all cases.
Figure 6.
Induction of NQO1 in C/C bone marrow cells after exposure to 0–100 μM CAT. (A) NQO1 activity was measured 24 h after treatment and is reported as nmol 2,6-dichlorophenol-indophenol reduced/min per mg cellular protein. Data are represented as mean ± SD (n = 3). ∗, NQO1 activity was significantly greater than control (P ≤ 0.05). (B) NQO1 protein was measured by immunoblot analysis. Purified recombinant human NQO1 was included as a standard (5 ng, NQO1). No NQO1 protein was detected in freshly isolated bone marrow cells (F). Immunoblot is representative of three separate experiments.
HQ Induces NQO1 Protein and Activity in Human Bone Marrow Progenitor (CD34+) Cells.
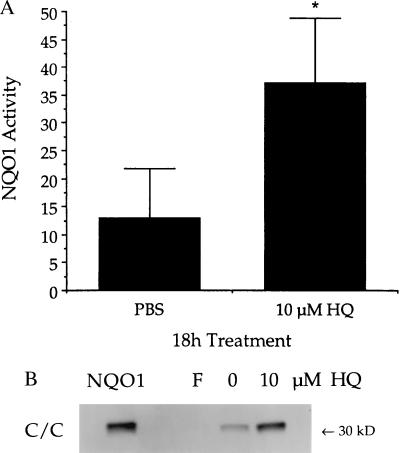
Bone marrow mononuclear cells from three wild-type donors (C/C) were enriched for cells expressing CD34. Cell populations obtained contained 87%, 88%, and 97% CD34+ cells. Culture in the presence of 10 μM HQ induced NQO1 protein and activity significantly greater than that observed after 18-h culture with PBS (Fig. 7). Although culture conditions did induce NQO1, induction in HQ-treated cells was 3.5-fold greater than that observed in PBS-treated cells.
Figure 7.
Induction of NQO1 in human bone marrow mononuclear cells enriched for CD34 expression. Isolated CD34+ cells were cultured with or without HQ (10 μM) for 18 h. All three donors were genotyped as C/C at position 609 of the coding region of NQO1. (A) NQO1 activity. Data are presented as mean ± SD (n = 3). ∗, Significantly greater than control (P ≤ 0.05). (B) NQO1 protein was measured by immunoblot analysis. Purified recombinant human NQO1 was included as a standard (0.5 ng, NQO1). Immunoblot is representative of three separate experiments. No NQO1 activity or protein was detected in freshly isolated CD34+ cells (F).
DISCUSSION
Evidence implicates metabolite-induced toxicity and/or perturbation of the human hematopoietic progenitor compartment in benzene hematotoxicity (49). KG-1a cells are human promyeloblastic leukemia cells that express phenotypic surface markers believed to identify hematopoietic progenitor cells (50, 51) and therefore were used as an in vitro model to investigate the effects of benzene metabolites in human bone marrow progenitor cells. Despite a C/T genotype at position 609 of the coding region of NQO1, KG-1a cells fail to express appreciable levels of NQO1. We previously have shown that HQ and CAT induce apoptosis in human hematopoietic cells (21), which was also the case in KG-1a cells. KG-1a cells pretreated with a noncytotoxic concentration of HQ, however, were protected from apoptosis induced by subsequent treatment with elevated concentrations of HQ.
Exposure to HQ is likely to induce a number of protective mechanisms, probably via the antioxidant response element (31, 52–54). Both NQO1 and GSH are thought to play a role in protection against HQ. Twerdok et al. (28) concluded that both GSH and NQO1 contributed to HQ detoxification in murine bone marrow stromal culture. KG-1a cells pretreated with HQ not only demonstrated higher NQO1 activity, but also contained almost twice the soluble thiols as control cells. This increase in soluble thiols is consistent with previous work documenting GSH depletion immediately preceding BQ-induced apoptosis in KG-1a cells (55) and HQ-induced cytotoxicity in human hematopoietic cell lines (30). Although increased soluble thiols would be expected to reduce the susceptibility of cells to oxidative damage and toxicity induced by thiol-reactive xenobiotics, GSH conjugates of BQ are pro-oxidants (56, 57), induce apoptosis in HL-60 cells (58), and are erythrotoxic in rats (59). Our observations that HQ exposure failed to protect against apoptosis induced by a topoisomerase II inhibitor (etoposide), a protein kinase C inhibitor (staurosporine), or an α, β-unsaturated aldehyde (trans, trans-MUC) suggest that HQ-mediated protection did not result from general inhibition of apoptotic processes. Of interest is the failure of the increased thiols to reduce the apoptosis induced by the thiol reactive agent, trans, trans-MUC (60).
Several lines of evidence support a role for NQO1 in the detoxication of quinones including those derived from the benzene metabolites HQ, CAT, and 1,2,4-benzenetriol. When NQO1 was first characterized by Ernster et al. (61), BQ, the quinone generated by the oxidation of HQ, was identified as one of the most efficient substrates for NQO1. Inhibition of NQO1 activity with dicoumarol, an inhibitor of NQO1, increased covalent binding of 14C-HQ to acid insoluble macromolecules in murine fibroblastoid stromal cells (11) and potentiated HQ-induced cytotoxicity in rat and mouse bone marrow stroma (29). Induction of NQO1 activity protected against HQ-induced cytotoxicity in murine bone marrow stromal cells (28) and BQ-induced cytotoxicity in human T lymphocytic Molt-4 cells (32). Cells with constitutively low expression of NQO1 such as murine bone marrow stroma macrophages are more susceptible to benzene metabolite-induced toxicity, whereas those with constitutively high expression of NQO1 such as bone marrow fibroblasts appear to be relatively resistant to direct toxicity induced by metabolites of benzene (7, 26, 27). Finally, in a recent case control study of benzene-exposed workers in China, individuals with T/T at position 609 in the coding region of NQO1 were at 2.6-fold increased risk of developing benzene-induced hematotoxicity (41). The relative risk of developing benzene-induced hematotoxicity was even greater (7.8-fold) for individuals with both a phenotype indicative of rapid P450 2E1 metabolism and a T/T NQO1 genotype.
The increased susceptibility to benzene-induced hematotoxicity associated with a T/T NQO1 genotype is difficult to reconcile with the lack of NQO1 activity in human bone marrow. The ability of benzene metabolites to induce NQO1 in murine embryonic fibroblasts and hepatoma cells has been demonstrated (32, 35, 36), and HQ, CAT, and BQ induced gene expression from a reporter plasmid containing a portion of the human NQO1 promoter (31). We therefore hypothesized that the mechanism underlying the increased susceptibility of individuals with the T/T genotype to benzene toxicity was the result of a failure to induce NQO1. No NQO1 protein or activity could be detected in fresh bone marrow aspirate or freshly isolated bone marrow progenitor cells, regardless of NQO1 genotype. After exposure to low concentrations of HQ or CAT, however, NQO1 activity and protein were induced in bone marrow cells with either the C/C or C/T NQO1 genotype. Exposure to HQ also resulted in the induction of NQO1 activity and protein in human bone marrow progenitor cells with a C/C NQO1 genotype. Induction of NQO1 by HQ treatment was not observed, however, in bone marrow cells with the T/T NQO1 genotype. The lack of detectable NQO1 induction in T/T bone marrow cells agrees with previous observations that cell lines with a T/T genotype at position 609 in the coding region of NQO1 fail to express detectable NQO1 activity or protein (37, 39, 40).
Although evidence suggests that phenolic metabolites of benzene are capable of directly activating the human NQO1 promoter (31), it is also possible that the increased NQO1 observed in our systems was not a result of direct induction. As bone marrow mononuclear cells remain in culture, components of the aspirate differentiate to form a monolayer resembling bone marrow stroma. Coincident with this differentiation and over the course of several weeks NQO1 expression also increases (25, 46). In the present studies, however, the relatively brief incubation time (24 h) and the fact that no attached cells were collected for analysis argues that the NQO1 induced by HQ did not result from stimulation of stromal differentiation. HQ also induced NQO1 in CD34+ cells after only 18 h. Although CD34+ cells do differentiate in culture, differentiation into populations distinguishable from primary cells by flow cytometric detection of surface markers is just beginning after 3 days (62). Li et al. (30) observed increased NQO1 in myeloid leukemia cells induced to differentiate. KG-1a cells, however, do not differentiate in response to compounds that stimulate differentiation in other myeloid leukemia cell lines (63, 64). Indeed, KG-1a cells exposed to HQ did not show any change in CD34 expression (data not shown), loss of which occurs concomitant with differentiation (65). The high background of NQO1 induced in our experimental systems may have resulted from transcriptional activation via the antioxidant response element/TPA (12-O-tetradecanoylphorbol-13-acetate) response element by components of serum and/or stressors to which cells may have been exposed during isolation procedures (66, 67). For example, the DNA binding activities of Fos and Jun family members are regulated by oxidative changes (68, 69) and transcription of c-fos is activated when cells are exposed to serum via a serum response element in its promoter (70).
In summary, although hematopoietic protective mechanisms against the toxicity of benzene metabolites are undoubtedly multifactorial, our data provide a potential explanation for the increased susceptibility of individuals lacking NQO1 to the hematotoxicity of benzene. Our data demonstrate that NQO1 induction occurs after exposure to benzene metabolites in KG-1a cells, bone marrow cells, and bone marrow progenitor cells carrying a C/C or C/T NQO1 genotype, but that induction of NQO1 is not observed in bone marrow cells with a T/T genotype. These data suggest that NQO1 is induced in human bone marrow after exposure to benzene metabolites where it contributes to protection against HQ-induced apoptosis. These results also suggest that the increased risk of benzene hematotoxicity in individuals with the T/T NQO1 genotype may result from a failure to induce functional NQO1 enzyme.
Acknowledgments
We thank James A. Ruth and David J. Claffey for synthesizing trans, trans-MUC. This work was supported by National Institutes of Health Grant RO1 ES 09554.
ABBREVIATIONS
- HQ
hydroquinone
- CAT
catechol
- BQ
benzoquinone
- NQO1
NAD(P)H:quinone oxidoreductase
- GSH
glutathione
- MUC
muconaldehyde
Footnotes
This paper was submitted directly (Track II) to the Proceedings Office.
A Commentary on this article begins on page 7624.
References
- 1.Aksoy M. CRC Benzene Carcinogenicity. Boca Raton, FL: CRC; 1988. [Google Scholar]
- 2.Yardley-Jones A, Anderson D, Parke D V. Br J Indus Med. 1991;48:437–444. doi: 10.1136/oem.48.7.437. [DOI] [PMC free article] [PubMed] [Google Scholar]
- 3.Wallace L. Environ Health Perspect. 1996;104:1129–1136. doi: 10.1289/ehp.961041129. [DOI] [PMC free article] [PubMed] [Google Scholar]
- 4.Seaton M J, Schlosser P M, Bond J A, Medinsky M A. Carcinogenesis. 1994;15:1799–1806. doi: 10.1093/carcin/15.9.1799. [DOI] [PubMed] [Google Scholar]
- 5.Rickert D E, Baker T S, Bus J S, Barrow C S, Irons R D. Toxicol Appl Pharmacol. 1979;49:417–423. doi: 10.1016/0041-008x(79)90441-1. [DOI] [PubMed] [Google Scholar]
- 6.Greenlee W F, Sun J D, Bus J S. Toxicol Appl Pharmacol. 1981;59:187–195. doi: 10.1016/0041-008x(81)90189-7. [DOI] [PubMed] [Google Scholar]
- 7.Thomas D J, Sadler A, Subrahmanyam V V, Siegel D, Reasor M J, Wierda D, Ross D. Mol Pharmacol. 1990;37:255–262. [PubMed] [Google Scholar]
- 8.Levay G, Ross D, Bodell W J. Carcinogenesis. 1993;14:2329–2334. doi: 10.1093/carcin/14.11.2329. [DOI] [PubMed] [Google Scholar]
- 9.Irons R D. J Toxicol Environ Health. 1985;16:673–678. doi: 10.1080/15287398509530777. [DOI] [PubMed] [Google Scholar]
- 10.Lind C, Hochstein P, Ernster L. Arch Biochem Biophys. 1982;216:178–185. doi: 10.1016/0003-9861(82)90202-8. [DOI] [PubMed] [Google Scholar]
- 11.Ross D, Siegel D, Gibson N W, Pacheco D, Thomas D J, Reasor M, Wierda D. Free Radical Res Commun. 1990;8:373–381. doi: 10.3109/10715769009053371. [DOI] [PubMed] [Google Scholar]
- 12.Smart R C, Zannoni V G. Mol Pharmacol. 1984;26:105–111. [PubMed] [Google Scholar]
- 13.Cronkite E P, Inoue T, Carsten A L, Miller M E, Bullis J E, Drew R T. J Toxicol Environ Health. 1982;9:411–421. doi: 10.1080/15287398209530174. [DOI] [PubMed] [Google Scholar]
- 14.Green J D, Snyder C A, LoBue J, Goldstein B D, Albert R E. Toxicol Appl Pharmacol. 1981;58:492–503. doi: 10.1016/0041-008x(81)90102-2. [DOI] [PubMed] [Google Scholar]
- 15.Gaido K, Wierda D. Toxicol Appl Pharmacol. 1984;76:45–55. doi: 10.1016/0041-008x(84)90027-9. [DOI] [PubMed] [Google Scholar]
- 16.Gaido K W, Wierda D. Toxicol Appl Pharmacol. 1985;81:469–475. doi: 10.1016/0041-008x(85)90418-1. [DOI] [PubMed] [Google Scholar]
- 17.Bonnet D, Dick J E. Nat Med. 1997;3:730–737. doi: 10.1038/nm0797-730. [DOI] [PubMed] [Google Scholar]
- 18.Fialkow P J, Singer J W, Adamson J W, Berkow R L, Friedman J M, Jacobson R J, Moohr J W. N Engl J Med. 1979;301:1–5. doi: 10.1056/NEJM197907053010101. [DOI] [PubMed] [Google Scholar]
- 19.Raza A, Mundle S, Iftikhar A, Gregory S, Marcus B, Khan Z, Alvi S, Shetty V, Dameron S, Wright V, et al. Am J Hematol. 1995;48:143–154. doi: 10.1002/ajh.2830480302. [DOI] [PubMed] [Google Scholar]
- 20.Marsh J C W, Chang J, Testa N G, Hows J M, Dexter T M. Br J Haematol. 1991;78:258–267. doi: 10.1111/j.1365-2141.1991.tb04426.x. [DOI] [PubMed] [Google Scholar]
- 21.Moran J L, Siegel D, Sun X M, Ross D. Mol Pharmacol. 1996;50:610–615. [PubMed] [Google Scholar]
- 22.Hiraku Y, Kawanishi S. Cancer Res. 1996;56:5172–5178. [PubMed] [Google Scholar]
- 23.Schattenberg D G, Stillman W S, Gruntmeir J J, Helm K M, Irons R D, Ross D. Mol Pharmacol. 1994;46:346–351. [PubMed] [Google Scholar]
- 24.Strobl H, Takimoto M, Majdic O, Fritsch G, Scheinecker C, Höcker P, Knapp W. Blood. 1993;82:2069–2078. [PubMed] [Google Scholar]
- 25.Ross D, Siegel D, Schattenberg D G, Sun X M, Moran J L. Environ Health Perspect. 1996;104:1177–1182. doi: 10.1289/ehp.961041177. [DOI] [PMC free article] [PubMed] [Google Scholar]
- 26.Trush M A, Twerdok L E, Rembish S J, Zhu H, Li Y. Environ Health Perspect. 1996;104:1227–1234. doi: 10.1289/ehp.961041227. [DOI] [PMC free article] [PubMed] [Google Scholar]
- 27.Ganousis L G, Goon D, Zyglewska T, Wu K K, Ross D. Mol Pharmacol. 1992;42:1118–1125. [PubMed] [Google Scholar]
- 28.Twerdok L E, Rembish S J, Trush M A. Toxicol Appl Pharmacol. 1992;112:273–281. doi: 10.1016/0041-008x(92)90197-z. [DOI] [PubMed] [Google Scholar]
- 29.Zhu H, Li Y, Trush M A. J Toxicol Environ Health. 1995;46:183–201. doi: 10.1080/15287399509532028. [DOI] [PubMed] [Google Scholar]
- 30.Li Y, Lafuente A, Trush M A. Life Sci. 1994;54:901–916. doi: 10.1016/0024-3205(94)00626-1. [DOI] [PubMed] [Google Scholar]
- 31.Wang B, Williamson G. Biochim Biophys Acta. 1996;1307:104–110. doi: 10.1016/0167-4781(96)00028-0. [DOI] [PubMed] [Google Scholar]
- 32.Flescher E, Snyder C A. Arch Toxicol. 1995;69:684–689. doi: 10.1007/s002040050232. [DOI] [PubMed] [Google Scholar]
- 33.Benson A, Hunkeler M J, Talalay P. Proc Natl Acad Sci USA. 1980;77:5216–5220. doi: 10.1073/pnas.77.9.5216. [DOI] [PMC free article] [PubMed] [Google Scholar]
- 34.Winner E J, Prough R A, Brennan M D. Drug Metab Dispos. 1997;25:175–181. [PubMed] [Google Scholar]
- 35.Prochaska H J, De Long M J, Talalay P. Proc Natl Acad Sci USA. 1985;82:8232–8236. doi: 10.1073/pnas.82.23.8232. [DOI] [PMC free article] [PubMed] [Google Scholar]
- 36.Prestera T, Holtzclaw W D, Zhang Y, Talalay P. Proc Natl Acad Sci USA. 1993;90:2965–2969. doi: 10.1073/pnas.90.7.2965. [DOI] [PMC free article] [PubMed] [Google Scholar]
- 37.Traver R D, Siegel D, Beall H D, Phillips R M, Gibson N W, Franklin W A, Ross D. Br J Cancer. 1997;75:69–75. doi: 10.1038/bjc.1997.11. [DOI] [PMC free article] [PubMed] [Google Scholar]
- 38.Kelsey K T, Ross D, Traver R D, Christiani D C, Zuo Z F, Spitz M R, Wang M, Xu X, Lee B K, Schwartz B S, Wiencke J K. Br J Cancer. 1997;76:852–854. doi: 10.1038/bjc.1997.474. [DOI] [PMC free article] [PubMed] [Google Scholar]
- 39.Traver R D, Horikoshi T, Danenberg K D, Stadlbauer T H, Danenberg P V, Ross D, Gibson N W. Cancer Res. 1992;52:797–802. [PubMed] [Google Scholar]
- 40.Ross D, Traver R D, Siegel D, Kuehl B L, Misra V, Rauth A M. Br J Cancer. 1996;74:995–996. doi: 10.1038/bjc.1996.477. [DOI] [PMC free article] [PubMed] [Google Scholar]
- 41.Rothman N, Smith M T, Hayes R B, Traver R D, Hoener B, Campleman S, Li G L, Dosemeci M, Linet M, Zhang L, et al. Cancer Res. 1997;57:2839–2842. [PubMed] [Google Scholar]
- 42.Goon D, Cheng X, Ruth J A, Petersen D R, Ross D. Toxicol Appl Pharmacol. 1992;114:147–155. doi: 10.1016/0041-008x(92)90107-4. [DOI] [PubMed] [Google Scholar]
- 43.Lowry O H, Rosebrough N J, Farr A L, Randall R J. J Biol Chem. 1951;193:265–275. [PubMed] [Google Scholar]
- 44.Sedlak J, Lindsay R H. Anal Biochem. 1968;25:192–205. doi: 10.1016/0003-2697(68)90092-4. [DOI] [PubMed] [Google Scholar]
- 45.Ernster L. Methods Enzymol. 1967;10:309–317. [Google Scholar]
- 46.Siegel D, McGuinness S M, Winski S L, Ross D. Pharmacogen. 1999;9:113–121. doi: 10.1097/00008571-199902000-00015. [DOI] [PubMed] [Google Scholar]
- 47.Brown D G, Sun X-M, Cohen G M. J Biol Chem. 1993;268:3037–3039. [PubMed] [Google Scholar]
- 48.Oberhammer F, Wilson J W, Dive C, Morris I D, Hickman J A, Wakeling A E, Walker P R, Sikorska M. EMBO J. 1993;12:3679–3684. doi: 10.1002/j.1460-2075.1993.tb06042.x. [DOI] [PMC free article] [PubMed] [Google Scholar]
- 49.Smith M T, Fanning E W. Leuk Res. 1997;21:361–374. doi: 10.1016/s0145-2126(96)00122-1. [DOI] [PubMed] [Google Scholar]
- 50.Clave E, Carosella E D, Gluckman E, Dubray B, Socie G. Int J Radiat Oncol Biol Phys. 1996;35:709–719. doi: 10.1016/0360-3016(96)00137-x. [DOI] [PubMed] [Google Scholar]
- 51.Koeffler H P, Billing R, Lusis A J, Sparkes R, Golde D W. Blood. 1980;56:265–273. [PubMed] [Google Scholar]
- 52.Prestera T, Talalay P. Proc Natl Acad Sci USA. 1995;92:8965–8969. doi: 10.1073/pnas.92.19.8965. [DOI] [PMC free article] [PubMed] [Google Scholar]
- 53.Venugopal R, Jaiswal A K. Proc Natl Acad Sci USA. 1996;93:14960–14965. doi: 10.1073/pnas.93.25.14960. [DOI] [PMC free article] [PubMed] [Google Scholar]
- 54.Lee S F, Liang Y C, Lin J K. Chem-Biol Interact. 1995;98:283–301. doi: 10.1016/0009-2797(95)03652-0. [DOI] [PubMed] [Google Scholar]
- 55.Efferth T, Rucker G, Falkenberg M, Manns D, Olbrich A, Fabry U, Osieka R. Arzneimittelforschung. 1996;46:196–200. [PubMed] [Google Scholar]
- 56.Rao G S. Toxicology. 1996;106:49–54. doi: 10.1016/0300-483x(95)03159-d. [DOI] [PubMed] [Google Scholar]
- 57.Brunmark A, Cadenas E. Chem-Biol Interact. 1988;68:273–298. doi: 10.1016/0009-2797(88)90021-x. [DOI] [PubMed] [Google Scholar]
- 58.Bratton S, Lau S S, Monks T J. Toxicologist. 1998;42:189. (abstr.). [Google Scholar]
- 59.Bratton S B, Lau S S, Monks T J. Chem Res Toxicol. 1997;10:859–865. doi: 10.1021/tx960208r. [DOI] [PubMed] [Google Scholar]
- 60.Goon D, Matsuura J, Ross D. Chem-Biol Interact. 1993;88:37–53. doi: 10.1016/0009-2797(93)90083-b. [DOI] [PubMed] [Google Scholar]
- 61.Ernster L, Danielson L, Ljunggren M. Biochim Biophys Acta. 1962;58:171–188. doi: 10.1016/0006-3002(62)90997-6. [DOI] [PubMed] [Google Scholar]
- 62.Gross S, Helm K, Gruntmeir J J, Stillman W S, Pyatt D W, Irons R D. Eur J Haematol. 1997;59:318–326. doi: 10.1111/j.1600-0609.1997.tb01693.x. [DOI] [PubMed] [Google Scholar]
- 63.Koeffler H P, Bar-Eli M, Territo M C. Cancer Res. 1981;41:919–926. [PubMed] [Google Scholar]
- 64.Koeffler H P. Blood. 1983;62:709–721. [PubMed] [Google Scholar]
- 65.Esposito F, Agosti V, Morrone G, Morra F, Cuomo C, Russo T, Venuta S, Cimino F. Biochem J. 1994;301:649–653. doi: 10.1042/bj3010649. [DOI] [PMC free article] [PubMed] [Google Scholar]
- 66.Jaiswal A K. Biochem Pharmacol. 1994;48:439–444. doi: 10.1016/0006-2952(94)90272-0. [DOI] [PubMed] [Google Scholar]
- 67.Gomez del Arco P, Martinez-Martinez S, Calvo V, Armesilla A L, Redondo J M. Immunobiology. 1997;198:273–278. doi: 10.1016/S0171-2985(97)80047-2. [DOI] [PubMed] [Google Scholar]
- 68.Abate C, Patel L, Rauscher F J d, Curran T. Science. 1990;249:1157–1161. doi: 10.1126/science.2118682. [DOI] [PubMed] [Google Scholar]
- 69.Bergelson S, Pinkus R, Daniel V. Cancer Res. 1994;54:36–40. [PubMed] [Google Scholar]
- 70.Bi N, Mamrack M D. Exp Cell Res. 1994;212:105–112. doi: 10.1006/excr.1994.1124. [DOI] [PubMed] [Google Scholar]


