

Abstract
The mammalian cochlea depends on an amplification process for its sensitivity and frequency-resolving capability. Outer hair cells are responsible for providing this amplification. It is usually assumed that the membrane–potential-driven somatic shape changes of these cells are the basis of the amplifying process. It is of interest to see whether mechanical reactance changes of the cells might accompany their changes in cell shape. We now show that the cylindrical outer hair cells change their axial stiffness as their membrane potential is altered. Cell stiffness was determined by optoelectronically measuring the amplitude of motion of a flexible vibrating fiber as it was loaded by the isolated cell. Voltage commands to the cell were delivered in a tight–seal whole–cell configuration. Cell stiffness was decreased by depolarization and increased by hyperpolarization.
Cochlear outer hair cells (OHCs) are sensory receptor cells that possess a unique motor capability (1) by which the cylindrical cells change their lengths. The membrane–potential-dependent motor process (2) is generally assumed to provide feedback to the basilar–membrane/tectorial–membrane complex of the cochlea, thereby locally amplifying the traveling wave. This amplification process is apparently responsible for high sensitivity, broad dynamic range, exquisite frequency resolution, and a host of nonlinear behaviors evident in the normal mammalian ear (for review see refs. 3 and 4). We were interested in examining the possibility that the OHCs’ voltage–induced motile response might be coupled to a change in the cells’ mechanical impedance. Specifically, we questioned whether the cells’ axial stiffness might be voltage-dependent. This study was designed to examine such putative stiffness modulation. Previously, we and others reported preliminary results.†,‡,§
The static axial stiffness of OHCs has been measured previously (5–13). There have also been attempts to manipulate this static stiffness. Russell and Schauz (11) showed that axial stiffness decreases when salicylate is applied to the cell, but Hallworth (12) found no such changes, even though force generation by his cells was reduced. Dallos et al. (14) showed that delivery of the efferent neurotransmitter acetylcholine to the cells’ synaptic pole also decreased the axial stiffness.
In the experiments described here, the cells were stimulated electrically and their stiffnesses were measured with the driven-fiber method (refs. 15 and 16; Fig. 1 a and b). Fig. 1c depicts an equivalent mechanical circuit that represents the hair–cell driven–fiber system. The circuit is a simplified version of one that we used previously (14) and represents the system considered by Russell and Schauz (11) and Hallworth (12). The aggregate of putative elementary motors (17) produces an electromotile response (displacement) of the unloaded cell, G(V). The unloaded displacement of the driven fiber is xo, and its stiffness is ko. The driving–point stiffness of the cell is K, which is the stiffness that is presented by the cell to the elastic driven fiber. In this formulation, G(V) and K comprise the mechanical Thevenin equivalent of the cell. In other words, no matter how complex the internal mechanics of the cell might be, it can be represented, as viewed from the outside, by a displacement source G(V) and a stiffness K. This representation is valid at those low frequencies where the mechanical impedance is stiffness-dominated. This equation is an appropriate representation of the present experiments (see below). The displacement at the junction of the cell and attached fiber is expressed as:
 |
1 |
If one assumes that the cell’s internal stiffness, K, is a constant, then whatever the spectral content of the two “driving signals” [G(V) and xo] might be, the displacement x will contain the simple sum of these spectra. In other words, the electrically and mechanically induced responses will not intermodulate. If, however, K depends on the driving voltage V, then the spectrum of x will differ from the simple sum of individual spectra and intermodulation will occur. In simple terms, if the cell’s stiffness changes during the electrical stimulation cycle, an amplitude modulation of the fiber-driven mechanical response will take place. This modulation can be detected either in the time waveform of the displacement or in the frequency spectrum of the displacement response. In fact, amplitude modulation has a spectral “signature” of components at the sum and difference of the carrier and modulating frequencies, which in this case are those of the mechanical and electrical signals, respectively.
Figure 1.

(a) Video image of an OHC in the whole-cell patch configuration. The contact between the cell and the patch electrode is at the cell’s synaptic pole. A driven glass fiber is brought against the cell’s ciliated pole, and its motion is measured by using the photodiode. (b) The set up is similar to that shown in a, but the recording is made from one cell that is a part of a cluster of cells. (c) Equivalent mechanical circuit representation of the cell and the driven fiber. The aggregate of the putative molecular motors that produce cell contraction and elongation in response to a voltage command (V) is modeled by the displacement source G(V). The displacement G(V) represents the unloaded (“open circuit”) motile response of the cell. The displacement produced by the piezoelectric bimorph on the distal end of the fiber is signified by the displacement source xo. The total driving–point stiffness of the cell, measured at its ciliated pole, is K, and the stiffness of the fiber is ko. Both stiffnesses are represented as springs. The displacement measured by the photodiode is x.
METHODS
Pigmented guinea pigs (weight range: 150–300 g) were anesthetized with an overdose of sodium pentobarbital. The cochleae were dissected and kept in cold tissue-culture medium (Leibovitz’s l-15). The organ of Corti was isolated from the second, third, and fourth turns of the cochlea. After brief enzymatic digestion (1 mg/ml type IV collagenase, Sigma), cells were transferred to small plastic chambers filled with enzyme-free culture medium. Isolated cells were obtained after gentle trituration. The normal medium was Leibovitz’s l-15 (GIBCO), supplemented with 15 mM Hepes and adjusted to pH 7.35 and 300–310 milliosmol (inorganic components in mM: NaCl 136, NaH2PO4 5.8, KCl 5.4, CaCl2 1.3, MgCl2 0.9, and MgSO4 0.4). Animal handling and care procedures were approved by the Northwestern University Institutional Review Board and the National Institutes of Health. All experiments were performed at room temperature.
Glass fibers were pulled from 1.5-mm glass tubing by a microforge (Stoelting). The tapered tip of a fiber was usually 4–5 mm in length and 2–3 μm in diameter. Fiber stiffness ranged between 2.6 and 8.3 mN/m as calibrated by the “string instrument” method of Zwislocki and Cefaratti (18). The glass fiber was attached to a single–axis piezoelectric actuator, which was mounted on a three-axis micromanipulator. The experimental arrangement for stiffness-change measurement is illustrated in Fig. 1. The tip of the glass fiber was brought against the ciliated pole of the cell by using the micromanipulator, so that the long axes of the cell and fiber were approximately perpendicular. When determining the stiffness change of a cell under whole-cell voltage-clamp conditions, some recordings were done on isolated OHCs (Fig. 1a), and others were done on individual cells in a cluster of cells (Fig. 1b). This latter technique was used because a cell was more mechanically stable in a cluster and had less of a tendency to turn or rotate when the fiber was loaded onto it. This stability also helped to prevent loss of the seal during loading by the fiber and the subsequent measurement. The fiber was placed transverse to the OHC’s long axis so that the fiber’s lateral motions would compress or relax the cell. It was important that the fiber compress the cell somewhat before the fiber or cell was set into motion; if it were not preloaded, the fiber could become detached from the cell either when the cell contracted or when the fiber moved away from it.
Whenever possible, several quantities were measured. These were “unloaded motility,” the measurement of the cells’ electrically induced motile displacement response without loading by the fiber (designated as G); “free-fiber” motion, the displacement of the tip of the fiber when driven by the bimorph but not loaded by the cell (designated as xo); and “loaded response,” the joint displacement of the junction between cell and fiber after loading (designated as x). In this last category, distinction is made among responses obtained (i) when only the cell was electrically stimulated and the fiber served as a passive load (loaded motility), (ii) when only the fiber was actively moved and the cell served as a load (“fiber-driven response”), and (iii) when both electromotility and fiber motion were induced. The last response type provided the fundamental data for this paper.
OHCs were bathed in l-15 medium (Fig. 1 b and c). Whole–cell voltage-clamp recording was established by using the standard technique described for hair cells (19, 20). The patch electrodes were pulled from 1.5-mm borosilicate glass (A-M Systems, Everett, WA) by using a two-stage microelectrode puller (Narishige, Tokyo). The pipettes were filled with a solution containing (in mM): KF 120, KCl 20, MgCl2 2, EGTA 10, and Hepes 10. The solution was buffered to pH 7.4 with Trizma Base (Sigma), and osmolarity was adjusted to 300–310 milliosmol with glucose. The pipettes had initial resistances between 4 and 6 MΩ in the bath. The series resistance was ≈8–10 MΩ when whole–cell recording configuration was established. At least 70% of this resistance was compensated. Cells were voltage-clamped at −70 mV by using an Axon patch-clamp amplifier (Axopatch 200 A; Axon Instruments, Foster City, CA). Sinusoidal or step stimuli (V) were used to evoke motile responses.
Cell motion and fiber motion were measured by a photodiode system. A magnified image of the junction between the cell’s ciliated pole and the fiber was projected onto the photodiode through a rectangular slit. The position of the slit in front of the photodiode was adjustable so that the image of the object could always be projected onto the photodiode without moving the cell or the fiber. The position of the image in the slit was monitored by a video camera behind it. Cell-length changes or fiber displacements were measured by changes in the current of the photodiode. The photocurrent response was calibrated to displacement units by moving the slit a fixed distance with the image of the cell (and/or fiber) in front of the photodiode at the beginning of each trial. It was possible to measure displacements up to ≈3,000 Hz with the photodiode-measuring system (3-dB cut-off; frequency of 1,100 Hz). For measuring low-frequency responses, 5 averages were preset for each trial, whereas, for measuring high frequency responses, 100 averages were preset. Averaging only five samples provided an average noise–floor of 3.1-nm peak/spectral component (range: 1.4- to 7.1-nm peak). A linear relationship between the command voltage to the bimorph and the recorded free-fiber displacement was observed. This linearity extends over a range well in excess of the displacements actually measured during these experiments.
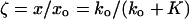
One potential problem with these experiments pertains to the necessity of maintaining adequate contact between the driven fiber and the cell throughout a given measurement series. Consider that if the fiber were to detach during some part of the cycle, the cell would present a load to the fiber only during the time when contact was maintained. In other words, when fiber and cell move toward one another (because of the motion of either), a stiffness load to the fiber would be presented by the cell, whereas if they move apart the load would be removed. This nonlinearity (rectification) could simulate the phenomenon whose presence we are testing. The coupling—decoupling mechanism would be unlikely to operate as long as the both the fiber and the cell (considered as springs) were compressed beyond their resting lengths to assure the maintenance of contact between them. This maintained contact can be ascertained by a simple comparison of loaded-fiber motion and free-fiber motion. If the fiber’s stiffness is ko and that of the cell is K, then loaded-fiber motion (x) is expected to be the following fraction of the free-fiber motion (xo):
 |
2 |
As long as the two “springs” (ko and K) remain coupled, ζ < 1; if they become decoupled, ζ = 1. If the former condition is maintained throughout the measurement, one can be assured that contact is sustained. In other words, with a flexible fiber, its motion amplitude is a sensitive measure of the stiffness load by the cell on the fiber. The average ζ was 0.323 in this experimental series, and, unless we assured ourselves of an adequate contact, the experiment was discarded. Another indicator that the experimental results seen were not caused by coupling–decoupling of the fiber is a lack of measurable second harmonic of the fiber–motion frequency in the loaded–motion spectrum. In these experiments, the only cases when a second harmonic was present were those when the unloaded-fiber response itself contained measurable second harmonic content. Even then, the relative magnitude of the second harmonic did not increase from free to loaded conditions. This result is not what one would expect if rectification took place because of coupling—decoupling, insofar as halfway rectification produces a spectrum rich in even harmonics.
Data analysis, consisting of high- and low-pass digital filtering and computation of Fourier spectra, was performed with igor pro (WaveMetrics, Lake Oswego, OR). Before computing the spectra, waveforms were windowed with the built-in Hanning function of igor pro and adjusted to 2n sample lengths, usually 1,024 points. The digital filters were of the type that does not introduce any phase shift caused by the filtering process.
RESULTS
Isolated OHCs are generally depolarized because of sodium-loading (21). In our hands, their average initial zero-current membrane potential is −25 mV (14). After allowing the cell’s content to equilibrate with the electrolyte in the patch pipette, the average zero–current membrane potential changes to −55.7 mV. It was of interest to see whether modulation could be detected around the normal OHC resting potential of approximately −70 mV (21). Control of membrane potential permits the determination of the stiffness vs. voltage functional dependence.
Cells (n = 7) were examined (Fig. 1 b or c) under voltage clamp with the whole-cell recording technique (22) and a two-frequency stimulus paradigm. The base of the fiber was driven sinusoidally at 100 Hz, while the OHC was electrically stimulated via the patch pipette with a 10-Hz sinusoidal voltage on top of the −70 mV holding potential. Of the seven cells, six showed voltage-dependent stiffness. A representative example is shown in Fig. 2. Fig. 2a provides the waveform of the loaded fiber, superimposed on the recording of unloaded-fiber motion; electromotility was elicited during the second half of the presentation period. A segment of the response is shown high-pass filtered in Fig. 2b to emphasize the amplitude modulation visible in the 100-Hz fiber motion. Superimposed is a low-pass filtered version of the response that corresponds to loaded motility. It is noted that decreases in amplitude occur during the upward (expansion) cycle of the cell motion during which the cell is hyperpolarized. In Fig. 2c, the spectra of the responses during the first and second 1-s periods are plotted. Intermodulation components are prominent at 90 and 110 Hz during the second period when the voltage command was applied to the cell, as signified by the 10-Hz spectral component (loaded motile response).
Figure 2.

(a) Responses obtained during whole–cell voltage–clamp experiment (as in Fig. 1a). Free-fiber motion in response to 100-Hz sinusoidal drive (thin dotted lines) and loaded-fiber response during stimulation of electromotility (by a 10-Hz, 40-mV signal) during the second half of the mechanical input (superimposed heavy line). Comparison of the first 1-s period of loaded- and free-fiber motions provides an indication of secure contact between fiber and cell by indicating that the former is considerably smaller than the latter (ζ = 0.53; Eq. 2). (b) High-pass filtered loaded-fiber motion during elicitation of motile response (thin dotted line) in comparison with the low-pass filtered (superimposed solid line) version of the same response. The latter represents the loaded electromotile response of the cell. In b, a segment of the response from a is shown on an expanded time scale. Note the apparent amplitude modulation in the high-frequency response. Upward deflections in the low-pass filtered response reflect cell elongation (during hyperpolarization). (c) Fourier spectra of the first (open circles) and second 1-s periods (filled circles) of the loaded-fiber waveform from Fig. 2a. Note the presence of intermodulation components at 90 and 110 Hz, aside from energy at 10 Hz (electromotile response) and 100 Hz (mechanical driving signal), in the trace representing the second half of the response. Also note the absence of these components (and of course the 10-Hz component representing the electromotile response) during the first period. Resting cell length = 60 μm.
To examine the voltage dependence of response change and its relation to electromotility, further whole–cell voltage-clamp experiments were conducted on seven additional cells. In Fig. 3a, some response waveforms are shown when the voltage commands were 150-ms DC offsets around the holding potential of −70 mV. In these experiments, a 100-Hz signal was driving the fiber, and a DC step of variable size (Top Left) was applied to the cell. During the presentation of DC step voltages, one sees a DC shift in the baseline, representing the electromotile response of the cell to the voltage step. It is also seen that during the step the amplitude of the 100-Hz fiber-motion amplitude is altered. Hyperpolarization produces cell elongation and a decrease in the amplitude of fiber motion. Conversely, depolarization of the cell produces contraction and an increased fiber amplitude.
Figure 3.

(a) Waveforms obtained during a whole–cell voltage-clamp experiment (as in Fig. 1b). Voltage-clamp command waveforms are shown (Top Left); they are 150-ms-long DC shifts superimposed on the −70-mV holding potential. Free-fiber motion is shown (Center Left). The remaining waveforms provide examples of loaded-fiber motion while electromotile response is elicited with different voltage commands. Upward deflections represent cell elongation; downward deflections show contraction. From the loaded responses at the holding potential and from the unloaded-fiber motion, one computes ζ = 0.33. (b) Loaded-fiber response amplitude change at 100 Hz (expressed relative to the response at holding potential) as a function of membrane potential. Resting cell length = 70 μm.
In Fig. 3b, the percentage change in the fiber’s response magnitude is plotted as a function of membrane potential. In this simple case, when a constant stiffness change is seen during the delivery of voltage offsets, one can compute the actual change in stiffness. One notes from Eq. 1 that the first term produces no 100-Hz component. Consequently, the amplitude of the 100-Hz response component and the solution for K are as follows
 |
3 |
Where xo and x are substituted as the amplitudes of the 100-Hz response at various values of the command voltage to compute the voltage–dependence of the cell stiffness K.
To present and correlate stiffness changes and resulting magnitude changes with motile response, we normalize these quantities. This normalization is done so that individual variations in response magnitude should not obscure common trends. Computed percentage of stiffness change (relative to resting stiffness¶) as the function of membrane potential is shown for six cells in Fig. 4a. The same measure, plotted as a function of loaded motile response (normalized at +20 mV membrane potential), is shown in Fig. 4b. Here, the abscissa is derived motile response, that is, the difference between baseline and centerline of the response during the step, expressed as the percentage of the motile response at +20 mV. It is seen that stiffness increase in excess of 50% is attained with large hyperpolarization, whereas the stiffness decreases to about 40% of its resting value during large depolarization. The slope of the stiffness function is ≈0.38% per mV at the holding potential. Finally, in Fig. 4c, the percentage response change is plotted for the six cells as a function of loaded electromotile response. The motile response at +20 mV is again taken as 100%.
Figure 4.

Group data from six cells (measured as described for Fig. 3). (a) Computed percentage change of cell stiffness (during electrical command) from that at the holding potential (−70 mV). (b) The ordinate is the same as in a, but the abscissa is the loaded electromotile response. The latter is expressed as percentage of motile response at +20 mV membrane potential. (c) The abscissa is same as in b, but the ordinate is change in the 100-Hz response at different membrane potentials. These response changes are normalized to those seen at +20 mV. Thus, all cells have a common point in the graph at (100%, 100%). Cell lengths = 75, 70, 70, 65, 60, and 55 μm.
Although we do not report on them here, we note that experiments similar to those described for Fig. 2 have been conducted on isolated OHCs that were stimulated in the microchamber (23).‖ The microchamber is a suction pipette that partitions the inserted OHC both electrically and mechanically; its advantage is that the cell’s mechanical condition is not compromised. The disadvantage is that the cell’s membrane potential is unknown. We, using low frequencies (1–10 Hz) to elicit electromotility, examined modulation of the fiber-driven length–change of the cell when electromotility was evoked. Of these, a large majority showed clear indication of amplitude modulation. In addition, we examined modulation of the fiber-driven mechanical response of cells when the mechanical driving signal to the fiber was increased to 2,000 Hz. The electrical signal to the cell was varied up to 1,750 Hz. The purpose of this experiment was to inquire whether the phenomenon of voltage-induced stiffness change is confined to very low frequencies. The general finding is that the frequency dependence of stiffness change and of electromotile response (24) parallel one another.
DISCUSSION
The data presented here establish a distinct phenomenon. This phenomenon was shown by measuring the amplitude of driven vibrations of a fiber that was brought against an isolated OHC while the cell was electrically stimulated. The amplitude of fiber motion was significantly modulated during the contraction–elongation cycle (electromotility) of the cell. The finding is interpreted as a voltage-dependent axial stiffness change of cochlear OHCs. The rationale is that the cell presents a load to the fiber, the mechanical impedance of which, as well as that of the cell, is assumed to be a pure reactive stiffness (see below). Consequently, if the amplitude of the fiber motion changes, this change must be the consequence of an altered load on it—ergo, altered cell stiffness.
All our results are interpreted in terms of changes in the cell’s internal axial stiffness. It is legitimate to ask whether there is reasonable justification for this choice. In other words, do we know that changes in the cell’s internal damping might not play a significant role? We addressed this issue in another context (14) and dismissed the cell’s internal damping as a quantity that would significantly influence the cell’s motile response at low audio frequencies. This issue can be revisited with the aid of data available from the present experiments. If the cell’s mechanical input impedance (that which is presented to the driving fiber) is stiffness-dominated, then one does not expect a significant phase shift between unloaded and loaded-fiber displacements. We have computed the phase difference between loaded- and free-fiber motions for 20 cells where these data were available at 2,000 Hz. The average phase shift was 8.5°. Assuming a first-order low-pass stiffness plus damping system (ignoring mass), knowing the phase shift at any frequency allows its computation at any other frequency or the frequency at any other phase shift. From the measured phase shift, an average bandwidth (at 45° lag) can be estimated as ≈13.4 kHz. The small phase shift between free- and loaded-fiber motions signifies that damping has minimal effect at the frequencies studied and, more importantly, that putative voltage-dependent damping changes (if any) could not account for the experimental results.
Loaded-fiber response decreases during hyperpolarization (cell elongation) and increases during depolarization (cell contraction). The stiffness change that underlies the amplitude changes is nontrivial. As Fig. 4a shows, the ratio of voltage-controlled stiffness to resting cell stiffness (at holding potential) varies over a significant range. At large hyperpolarizing commands, stiffness increases between 50 and 80%, whereas, at large depolarizing commands, axial cell stiffness decreases to about one-half of its resting value. At small command voltages around the holding potential, the slope of the stiffness function is ≈0.38% per mV. It is possible, however, that the numerical values obtained here are an underestimate of possible stiffness modulation. The resting stiffness of the cell is probably reduced during deflation by the patch pipette. The reported measures for a “typical” 60-μm-long isolated cell range from 0.4 to 8.5 mN/m (5–13). Our measurements are similar to these. It is at least possible that in vivo, where the membrane potential is at its normal value of −70 mV and full turgor is probably maintained, both resting and voltage-controlled stiffness might be greater. Of course, the receptor potential swing of in vivo OHCs about their resting membrane potential is limited to 20–30 mV (25, 26). It is thus difficult to estimate the range of stiffness changes in vivo, but they may be nontrivial.
The observed amplitude modulation has been interpreted as a stiffness change under control of membrane potential. The question naturally arises whether the changes seen are actually voltage-controlled or whether they depend on cell length. After all, as the cell’s membrane potential is altered, electromotility ensues, producing correlated length changes. To distinguish between the two mechanisms, the following reasoning was employed. If the change in stiffness depended on cell length, then intermodulation between two frequencies would be expected as long as both produced a length change. Thus, if both signals at frequencies f0 and f1 are fed to the bimorph, intermodulation components at f0 ± f1 are expected in this case. If, however, cell length is of no consequence and stiffness depends on membrane potential, no intermodulation will occur. We have conducted such experiments by using the microchamber technique, with both high- and low-frequency signals (100 Hz plus 10 Hz) applied to the bimorph that drives the fiber. The cell functions as a load of possibly length-dependent stiffness, but its electromotile response is not elicited. Experiments in which both low- and high-frequency signals were conveyed to the bimorph were carried out on 16 cells. Small intermodulation components were present in some experiments, and in some, we could detect no length-dependent stiffness. When intermodulation was seen, it was significantly below that obtained with the low-frequency signal changing the cell’s membrane potential, that is, when voltage-dependent stiffness was activated in the same cell. Inasmuch as the OHC behaves as a piezoelectric material, undergoing small membrane potential changes in response to mechanical stress (27, 28), it is possible that the small intermodulation produced in some cells on purely mechanical activation was a result of membrane-potential change caused by this reciprocal process. In any case, this effect is at most a second–order one in comparison with voltage–controlled stiffness change.
The mechanism whereby membrane potential controls the cell’s aggregate axial stiffness remains obscure. However, amplitude changes occur on the first half-cycle of the electrical stimulus, which suggests that the stiffness change is elicited more rapidly than what would be likely if a second messenger process controlled it. We have shown that such a slowly activating stiffness change also occurs in OHCs in response to efferent-neurotransmitter (acetylcholine) application (14). It is noted that there is still uncertainty about the underlying process of the possibly related phenomenon of electromotility (1), some 15 years after its discovery. One provocative finding is a general correlation between voltage-dependent cell stiffness and electromotility. Thus, as we show elsewhere‖, as measured in the microchamber, these phenomena show quantitative similarity in their frequency response, voltage dependence, and susceptibility to gadolinium (29). As a result, we now entertain the possibility that stiffness change is the primary phenomenon, with motility as its consequence. A complete model of motility and stiffness change may be derived by assuming that the cell is preloaded and that, as its stiffness changes with its membrane potential, its length is altered as a result. The simplest model assumes that elementary membrane-bound molecules undergo conformational changes that are stochastically dependent on membrane potential (17). In a two-state model, the molecule presents two different stiffnesses in its different isomeric forms. Aggregate action of a large number of molecules provides both graded voltage-dependent stiffness and correlated cell-length changes.
What might be the consequence of these stiffness changes if, in fact, they occur in vivo? Assume that OHCs significantly contribute to the total stiffness of the cochlear partition (30). As the OHC’s membrane potential is altered because of its mechanical stimulation, its stiffness is changed and, consequently, so is the stiffness of the total vibrating structure, the cochlear partition. Aside from phasic control of cell stiffness by the OHC’s receptor potential, tonic changes are also expected. OHCs in the apical half of the cochlea generate significant DC potentials coincident with sound stimulation. This potential is depolarizing around the cell’s best frequency and hyperpolarizing at low frequencies (25, 26, 31). OHCs in the high-frequency region of the cochlea generate mostly hyperpolarizing DC receptor potentials below their best frequency (32). These DC potentials can produce tonic-stiffness increases for stimuli below best frequency and, at least in the low-frequency apical region of the cochlea, tonic-stiffness decreases for best frequency inputs. It is not unreasonable to assume that cochlear amplification depends on some combination of electromotile response and stiffness change. In addition, the inherent nonlinearity of the stiffness modulation process could be one of the sources of prominent, OHC-related, cochlear distortion (33–35).
Some caveats need to be stated. First, available static-stiffness measurements of basilar membrane and isolated OHCs have some discrepancies for basal cochlear locations but indicate possible similarity for apical locations (reviewed in refs. 11 and 36). Of course, it is to be noted that discrepancies in stiffness are detrimental to amplification via electromotile response as well. An internally “soft” generator cannot effectively drive a “hard” load, and a soft spring, in parallel with a hard one, cannot effectively alter the total stiffness. The possibility cannot be dismissed that in vitro measurements of axial OHC stiffness inadequately represent the in vivo values. The second objection, once again equally applicable to the amplification scheme that uses electromotility or influence of cochlear mechanics via stiffness modulation, is that AC receptor potentials are attenuated at high frequencies by the low–pass filter inherent in the cell membrane (37). As a consequence, cycle-by-cycle control at high frequencies is problematic. A possible solution, control by extracellular potential gradients, has been suggested (24).
Finally, it might be argued that the stiffness changes shown are not large enough to cause significant alteration of cochlear mechanics. Alterations of a similar degree in certain other variables are known to produce profound effects. For example, the application of furosemide reduces the driving voltage to the OHC receptor current by ≈50%, but it causes a reduction in the gain of the cochlear response by 100- to 1,000-fold (38). This effect is understood when one considers that OHCs are the cochlear elements responsible for amplification. A modest change in the gain of this amplifier element can cause very large change in the gain of the total feedback system (39). It is thus possible that relatively modest stiffness changes of OHCs might have significant influence on cochlear mechanics and cochlear nonlinearities.
Acknowledgments
We thank our colleagues M. A. Cheatham, G. Emadi, and C.-P. Richter for their help. Discussions with George Zweig were of great help in improving the manuscript. This work was supported by National Institute on Deafness and Other Communication Disorders, National Institutes of Health Grant DC000708.
ABBREVIATION
- OHC
outer hair cell
Footnotes
He, D. Z. Z., Lin, X. & Dallos, P., 20th Meeting of the Association of Research Otolaryngology, Feb. 2–6, 1997, St. Petersburg Beach, FL, abstr. 299.
Frolenkov, G. I., Belyantseva, I. A. & Kachar, B., 21st Meeting of the Association of Research Otolaryngology, Feb. 15–19, 1998, St. Petersburg Beach, FL, abstr. 254.
He, D. Z. Z. & Dallos, P., 22nd Meeting of the Association of Research Otolaryngology, Feb. 13–18, 1999, St. Petersburg Beach, FL, abstr. 725.
The average resting axial stiffness measured from eight cells was 4.8 mN/m (individual values were 0.28, 2.2, 2.3, 3.6, 4.0, 5.3, 8.7, and 12.4).
Dallos, P. & He, D. Z. Z., Recent Developments in Auditory Mechanics Meeting, July 26–30, 1999, Zao, Japan.Dallos, P. & He, D. Z. Z., Sendai Ear Symposium, July 31, 1999, Sendai, Japan.
References
- 1.Brownell W E, Bader C R, Bertrand D, de Ribaupierre Y. Science. 1985;227:194–196. doi: 10.1126/science.3966153. [DOI] [PubMed] [Google Scholar]
- 2.Santos-Sacchi J, Dilger J P. Hear Res. 1988;35:143–150. doi: 10.1016/0378-5955(88)90113-x. [DOI] [PubMed] [Google Scholar]
- 3.Dallos P. J Neurosci. 1992;12:4575–4585. doi: 10.1523/JNEUROSCI.12-12-04575.1992. [DOI] [PMC free article] [PubMed] [Google Scholar]
- 4.Dallos P. In: The Cochlea. Dallos P, Popper A N, Fay R R, editors. New York: Springer; 1996. pp. 435–502. [Google Scholar]
- 5.Holley M C, Ashmore J F. Nature (London) 1988;335:635–637. doi: 10.1038/335635a0. [DOI] [PubMed] [Google Scholar]
- 6.Zenner H P, Gitter A H, Rudert M, Ernst A. Acta Otolaryngol (Stockh) 1992;112:248–253. doi: 10.1080/00016489.1992.11665413. [DOI] [PubMed] [Google Scholar]
- 7.Gitter A H, Rudert M, Zenner H P. Pflügers Arch. 1993;424:9–14. doi: 10.1007/BF00375096. [DOI] [PubMed] [Google Scholar]
- 8.Iwasa K H, Adachi M. Biophys J. 1997;73:546–555. doi: 10.1016/S0006-3495(97)78092-5. [DOI] [PMC free article] [PubMed] [Google Scholar]
- 9.Ulfendahl M, Chan E, McConnaughey W B, Prost-Domasky S, Elson E L. Pflügers Arch. 1998;436:9–15. doi: 10.1007/s004240050598. [DOI] [PubMed] [Google Scholar]
- 10.Hallworth R. J Neurophys. 1995;74:2319–2328. doi: 10.1152/jn.1995.74.6.2319. [DOI] [PubMed] [Google Scholar]
- 11.Russell I J, Schauz C. Auditory Neurosci. 1995;1:309–319. [Google Scholar]
- 12.Hallworth R. Hear Res. 1997;114:204–212. doi: 10.1016/s0378-5955(97)00167-6. [DOI] [PubMed] [Google Scholar]
- 13.Tolomeo J A, Steele C R, Holley M C. Biophys J. 1996;71:421–429. doi: 10.1016/S0006-3495(96)79244-5. [DOI] [PMC free article] [PubMed] [Google Scholar]
- 14.Dallos P, He D Z Z, Sziklai I, Lin X, Mehta S, Evans B N. J Neurosci. 1997;17:2212–2226. doi: 10.1523/JNEUROSCI.17-06-02212.1997. [DOI] [PMC free article] [PubMed] [Google Scholar]
- 15.Strelioff D, Flock Å. Hear Res. 1984;15:19–28. doi: 10.1016/0378-5955(84)90221-1. [DOI] [PubMed] [Google Scholar]
- 16.Howard J, Ashmore J F. Hear Res. 1986;23:93–104. doi: 10.1016/0378-5955(86)90178-4. [DOI] [PubMed] [Google Scholar]
- 17.Dallos P, Hallworth R, Evans B N. J Neurophysiol. 1993;70:299–323. doi: 10.1152/jn.1993.70.1.299. [DOI] [PubMed] [Google Scholar]
- 18.Zwislocki J, Cefaratti L K. Hear Res. 1989;42:211–228. doi: 10.1016/0378-5955(89)90146-9. [DOI] [PubMed] [Google Scholar]
- 19.Ashmore J F. J Physiol (London) 1987;388:323–347. doi: 10.1113/jphysiol.1987.sp016617. [DOI] [PMC free article] [PubMed] [Google Scholar]
- 20.Ashmore J F, Meech R W. Nature (London) 1986;322:368–371. doi: 10.1038/322368a0. [DOI] [PubMed] [Google Scholar]
- 21.Dallos P, Santos-Sacchi J, Flock Å. Science. 1982;218:582–584. doi: 10.1126/science.7123260. [DOI] [PubMed] [Google Scholar]
- 22.Hamill O P, Marty A, Neher E, Sakmann B, Sigworth F J. Pflügers Arch. 1981;391:85–100. doi: 10.1007/BF00656997. [DOI] [PubMed] [Google Scholar]
- 23.Evans B N, Hallworth R, Dallos P. Hear Res. 1991;52:288–304. doi: 10.1016/0378-5955(91)90019-6. [DOI] [PubMed] [Google Scholar]
- 24.Dallos P, Evans B N. Science. 1995;267:2006–2009. doi: 10.1126/science.7701325. [DOI] [PubMed] [Google Scholar]
- 25.Dallos P. J Neurosci. 1985;5:1591–1608. doi: 10.1523/JNEUROSCI.05-06-01591.1985. [DOI] [PMC free article] [PubMed] [Google Scholar]
- 26.Dallos P. Hear Res. 1986;22:185–198. doi: 10.1016/0378-5955(86)90095-x. [DOI] [PubMed] [Google Scholar]
- 27.Iwasa K. Biophys J. 1993;65:492–498. doi: 10.1016/S0006-3495(93)81053-1. [DOI] [PMC free article] [PubMed] [Google Scholar]
- 28.Gale J E, Ashmore J F. Proc R Soc London Ser B. 1994;255:243–249. doi: 10.1098/rspb.1994.0035. [DOI] [PubMed] [Google Scholar]
- 29.Santos-Sacchi J. J Neurosci. 1991;11:3096–3110. doi: 10.1523/JNEUROSCI.11-10-03096.1991. [DOI] [PMC free article] [PubMed] [Google Scholar]
- 30.Allen J B. In: The Mechanics and Biophysics of Hearing. Dallos P, Geisler C D, Matthews J W, Ruggero M A, Steele C R, editors. Berlin: Springer; 1990. pp. 324–332. [Google Scholar]
- 31.Cheatham M A, Dallos P. Hear Res. 1993;68:107–114. doi: 10.1016/0378-5955(93)90069-d. [DOI] [PubMed] [Google Scholar]
- 32.Russell I J, Sellick P M. J Physiol (London) 1983;435:493–511. [Google Scholar]
- 33.Goldstein J L. J Acoust Soc Am. 1967;41:676–689. doi: 10.1121/1.1910396. [DOI] [PubMed] [Google Scholar]
- 34.Goldstein J L, Kiang N Y S. Proc IEEE. 1968;56:981–992. [Google Scholar]
- 35.Dallos P, Schoeny Z G, Worthington D W, Cheatham M A. Science. 1969;164:449–451. doi: 10.1126/science.164.3878.449. [DOI] [PubMed] [Google Scholar]
- 36.Naidu R C, Mountain D C. Hear Res. 1998;124:124–131. doi: 10.1016/s0378-5955(98)00133-6. [DOI] [PubMed] [Google Scholar]
- 37.Santos-Sacchi J. J Neurosci. 1992;12:1906–1916. doi: 10.1523/JNEUROSCI.12-05-01906.1992. [DOI] [PMC free article] [PubMed] [Google Scholar]
- 38.Ruggero M A, Rich N C. J Neurosci. 1991;11:1057–1067. doi: 10.1523/JNEUROSCI.11-04-01057.1991. [DOI] [PMC free article] [PubMed] [Google Scholar]
- 39.Yates G K. In: The Mechanics and Biophysics of Hearing. Dallos P, Geisler C D, Matthews J W, Ruggero M A, Steele C R, editors. Berlin: Springer; 1990. pp. 106–113. [Google Scholar]