Abstract
This second of three papers, in which we functionally characterize activation gating in Shaker potassium channels, focuses on the properties of a mutant channel (called V2), in which the leucine at position 382 (in the Shaker B sequence) is mutated to valine. The general properties of V2's ionic and gating currents are consistent with changes in late gating transitions, in particular, with V2 disrupting the positively cooperative gating process of the normally activating wild type (WT) channel. An analysis of forward and backward rate constants, analogous to that used for WT in the previous paper, indicates that V2 causes little change in the rates for most of the transitions in the activation path, but causes large changes in the backward rates of the final two transitions. Single channel data indicate that the V2 mutation causes moderate changes in the rates of transitions to states that are not in the activation path, but little change in the rates from these states. V2's data also yield insights into the general properties of the activation gating process that could not be readily obtained from the WT channel, including evidence that intermediate transitions have rapid backward rates, and an estimate of a total charge 2 e0 for the final two transitions. Taken together, these data will help constrain an activation gating model in the third paper of this series, while also providing an explanation for V2's effects.
Keywords: ion channel, gating current, single-channel current, patch clamp, kinetic model
introduction
The S4-S5 region of many voltage-gated channels contains a leucine heptad repeat motif (McCormack et al., 1989) that, in the Shaker B amino acid sequence, spans residues 375–403. A possible role of this motif in the Shaker channel activation process was suggested by the work of McCormack et al. (1991) in which the five leucines were individually substituted by other hydrophobic residues. Substitutions of the first two leucines (L1 and L2) by valine were seen to produce positive shifts of the midpoint voltage of activation of 60 mV or more and reduce the voltage sensitivity. Substitution of alanine for L1 has a similar effect (Lopez et al., 1991), as does the substitution of phenylalanine in the L1 position in Domain 1 of the rat brain II sodium channel (Auld et al., 1990).
This paper concerns a mutation in which L2 is substituted by valine, referred to here as the V2 mutation. Despite the reduced voltage sensitivity of the V2 channel, a comparison of gating currents in noninactivating wild-type (WT)1 and V2 channels in a previous study showed no change in the total charge movement per channel (Schoppa et al., 1992). To interpret these effects, we previously fitted the equilibrium voltage dependence of channel opening and charge movement to a model similar to:
This model, which invokes the tetrameric structure of Shaker channels (MacKinnon, 1991; Kavanaugh et al., 1992; Li et al., 1994), has the channel open after each of four subunits undergoes one transition (from S0 to S1) and one additional concerted conformational change. In the context of this model, V2 causes a 70-mV positive shift in the midpoint voltage for the equilibrium constant k 2, but causes a negligible (5-mV) shift in the midpoint voltage of k 1 (Schoppa et al., 1992). The strongly shifted midpoint voltage of k 2 allows the V2 channel to open only at depolarized voltages and confers the weak voltage dependence of k 2 on the channel open probability. Subsequent analysis of other point mutations of L2 has provided some information about changes in the local environment of that residue (McCormack et al., 1993; Sigworth, 1994; Holmgren et al., 1996) and a possible role of this residue in the inactivation process (Ayer and Sigworth, 1997).
While Scheme SI provides a useful framework for considering V2's effects on equilibrium properties, it cannot describe Shaker's activation kinetics. The scheme has the channel undergo only five transitions, which cannot produce a long enough delay to account for the channel activation time course (Zagotta et al., 1994 a, 1994b; Schoppa and Sigworth, 1998b ). Also, the model has only two different types of transitions, while Shaker channels have at least three distinct types of transitions that can be distinguished by their voltage dependences (Schoppa and Sigworth, 1998a ).
Scheme I.
In this paper, we extend the kinetic analysis of the Shaker channel to the effects of the V2 mutation. This characterization of V2 serves two purposes. First, it serves to further delineate the steps in channel activation that are affected by the structural changes caused by the mutation. Second, it can provide additional information about the channel activation process. Because the V2 mutation leaves the total gating charge unchanged, we will assume that its effects can be explained by changes in the free energy of conformational states of the protein, leaving unaffected the charge movements accompanying the transitions. Thus, we assume that the basic conformational changes that are involved in channel opening are preserved in V2. This view is supported by the qualitatively similar effects of four other amino acid substitutions at this position (McCormack et al., 1993; Sigworth, 1994), and by the similar voltage dependences seen in rate constants of WT and V2 channels, as will be shown here. From within this framework, the data obtained from V2 can provide some insights into the activation gating process that cannot be directly obtained from WT data. In the following paper (Schoppa and Sigworth, 1998b ), these data will be used to help constrain a model of the activation process that accounts simultaneously for the properties of V2 and WT channels.
As in the study of the normally activating WT channel in the preceding paper, the V2 mutant channel that we study has its NH2 terminus truncated to remove the fast inactivation process (Hoshi et al., 1990). It was characterized using patch-clamp measurements of macroscopic ionic and gating currents, and also single channel currents recorded from oocytes expressing the V2 channel. In this paper, we first consider the general effects of the V2 mutation on activation gating, and then present a detailed analysis of rate constants that parallels the analysis performed on WT in the previous paper.
methods
V2's macroscopic ionic and gating currents and single channel currents were measured in inside-out membrane patches from Xenopus laevis oocytes expressing the V2 channel, which in our experiments contains a deletion of residues 2–30 to remove N-type inactivation (Hoshi et al., 1990). The construction of the V2 Shaker 29-4 cDNA and in vitro synthesis of cRNA have been described previously (McCormack et al., 1991; Schoppa et al., 1992). The current recordings were made as described previously (Schoppa and Sigworth, 1998a ), with some differences in procedures related to possible artifacts as described below.
Ion and Time Effects on V2's Macroscopic Currents
In our previous paper (Schoppa and Sigworth, 1998a ), we reported that the substitution of cesium ions for potassium in the bath, done to facilitate the removal of ionic currents, caused small changes in WT's gating currents. A comparison of V2's gating currents recorded in different patches with bath Cs+ or K+ indicated that these currents are kinetically similar, and the Q-V relations that were derived from these two types of measurements are not distinguishable. Gating currents recorded in Cs+ were thus used more extensively than was the case for WT experiments, and were used in the experiments shown in Figs. 4 C and 8.
Figure 4.
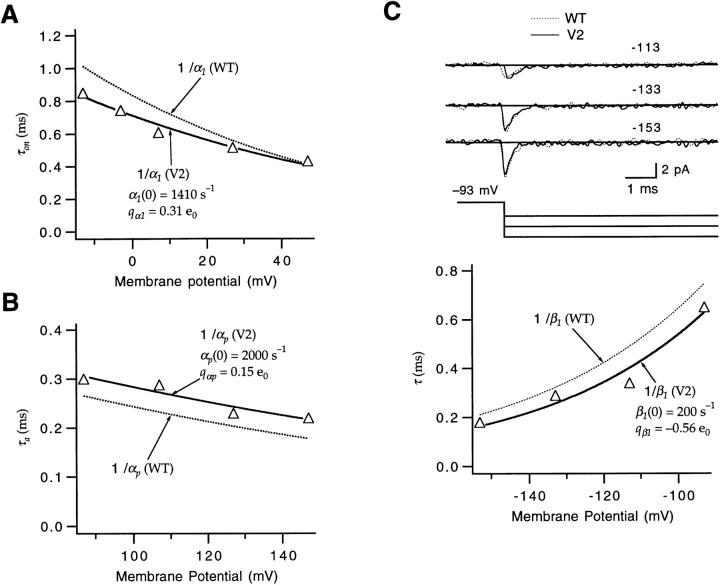
Estimates of α1, αp, and β1 for V2. (A) The voltage dependence of α1 was estimated by fitting an exponential to τon values derived from the on gating currents at voltages between −13 and +47 mV. From the data in the patch shown in Fig. 3 A, estimates were obtained α1(0) = 1,410 s−1 and q α1 = 0.31 e0, which are similar to WT's (dotted curve). (B) The voltage dependence of V2's αp was estimated by fitting an exponential to V2's τa values taken from macroscopic ionic current time courses measured between +87 and +147 mV. From the data in the patch shown in Fig. 2 A, estimates were obtained (αp(0) = 2,000 s−1 and q α1 = 0.15 e0) that are similar to WT's (dotted curve). (C) The voltage dependence of β1 was estimated from gating currents induced by voltage steps between −93 and −153 mV. These gating currents for V2 (solid curves, top) are nearly superimposable with WT's (dotted curves). Patches v240 and w249. The bottom plot shows that the time constants of the single exponentials fitted to the decay of V2's currents in this patch yielded estimates (β1(0) = 200 s−1 and q β1 = −0.56 e0) that are similar to the mean estimates obtained for WT's β1 (dotted curve).
Figure 8.
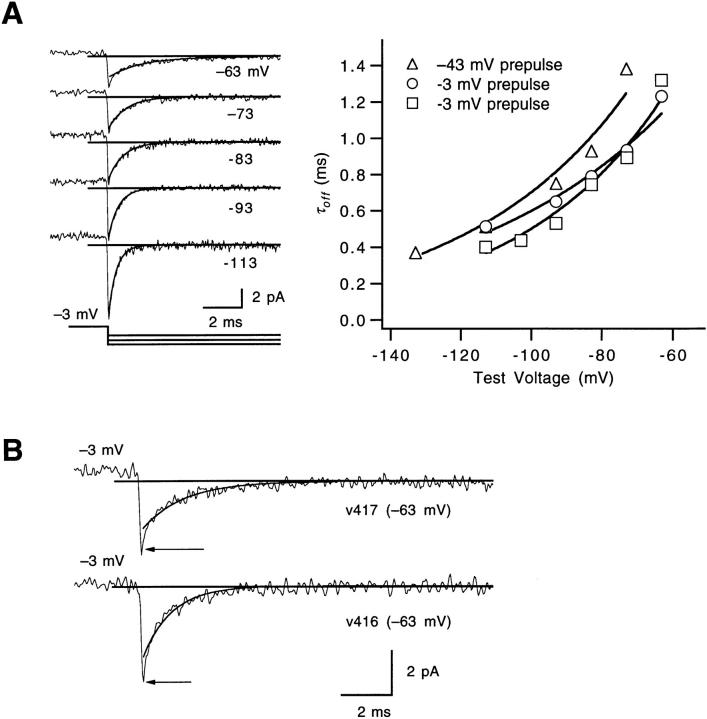
V2's off gating currents yield other information about intermediate transitions. (A) V2's off gating currents measured after a prepulse to −3 mV were used to estimate the partial charge q βd of the backward rates of intermediate transitions. The off currents measured at test voltages between −63 and −113 mV were fitted to an exponential, yielding a decay time constant τoff. The τoff values from this and two other patches were then fitted with an exponential function of voltage (solid curves, right), yielding values for q βd = −0.44, −0.54, and −0.61 e0. For one of the displayed experiments, the prepulse voltage was −43 mV. (B) Close examination of V2's off gating current at −63 mV (from this and one other patch) indicates the presence of a fast component (arrows) that is poorly accounted for by a fit of a single exponential, consistent with some intermediate transitions having more rapid backward kinetics than the first transition at this voltage.
Secondly, it was reported (Schoppa and Sigworth, 1998a ) that WT's macroscopic ionic tail currents displayed a threefold slowing during the first several minutes of a given patch recording. However, for V2, the time-dependent changes in deactivation were much smaller: from <45 s after patch excision to ≥4 min later, ionic tail currents showed a nonsignificant slowing of only 15 ± 11% (n = 3). Therefore, in contrast to experiments with WT channels, V2 tail currents measured immediately after excision were not excluded from the analysis of the deactivation process. None of the other macroscopic gating properties showed time-dependent effects, as was also observed for WT channels in the previous study.
Heterogeneity in V2 Single-Channel Behavior
In recordings of single channel currents, one important consideration is the stationarity of the channel behavior, as inhomogeneous kinetics introduce spurious components into the closed and open dwell-time histograms. Here we describe that V2's single channels display two types of nonstationarities and discuss how each was taken into account in our analysis.
The first type of nonstationary behavior corresponds to obvious shifts in the voltage dependence of P o that lasted for tens of minutes. In one single-channel patch recording that lasted 84 min, currents were measured at +7 mV during three different 2–3-min epochs at 10, 35, and 70 min after patch excision. Between the epochs, the mean P o changed from 0.46 ± 0.14 (mean ± SD; n = 151 traces) to 0.20 ± 0.15 (n = 86) and back to 0.50 ± 0.16 (n = 78). The change was well described by a 20-mV shift in the voltage dependence of P o, as well as in many kinetic parameters that were derived from the closed dwell-time histograms, the first latencies, and the ensemble average current taken from the data. A similar reversible switch from high to low P o activity was observed in one other patch recording, with the P o -V relations during the high and low P o periods in this second patch recording being nearly superimposable with the P o -V relations in the first patch recording. Also, in nine additional patch recordings in which P o was relatively stable, the derived P o -V relations clustered around the same two voltage ranges. These results would suggest that the observed changes in P o did not arise from artifacts such as a change in the temperature of the bathing solution; we take this behavior instead as indicative of two gating modes.
To avoid the effects of these shifts in P o, we ignored all low P o-mode activity in the analysis. This approach was justified since the V2 channel apparently spends much more time in the high than in the low P o mode. Of 11 single-channel patch recordings, two patches displayed both high and low P o-mode activity, seven patches displayed only high P o-mode activity, and only two patches displayed only low P o-mode activity. In these 11 patches, high P o-mode activity was displayed during 78% of the total 482 min of recording time. Additionally, an analysis of a variety of equilibrium and kinetic parameters indicated that V2 macroscopic currents were composed of the summed activity of a large number of mostly high P o-mode channels. For example, the activation time constant τa derived from the rising phase of the macroscopic current was similar to the τa derived from the ensemble average of the high P o-mode single channels but not that from low P o-mode single-channel events.
V2's single channel activity, like WT's (Schoppa and Sigworth, 1998a ), also showed a subconductance behavior, in which the channel occasionally shows a reduced current amplitude. This activity was accounted for by ending the analysis of a given single channel current trace at the point at which the currents appear to become smaller.
Evidence that our selection criteria did not significantly bias the analysis was obtained by considering the properties of the idealized single channel activity as contained in the event tables produced by the analysis program. For a channel with one open state, the form of the macroscopic tail current as a function of time τ should match the conditional probability of the channel being open at time t + τ given that the channel is open at t. In several patches, this conditional probability was computed within individual sweeps and averaged across sweeps; the resulting time course matched well the time course of macroscopic tail currents at the same voltage.
Slow Inactivation
Parameters of double-exponential fits to the slow inactivation phase of V2's currents were very similar to those of WT: at +67 mV, V2's current measured during 4-s pulses decayed with time constants of 76 ± 19 and 1,136 ± 250 ms (n = 3) with the fast component comprising 28 ± 17% of the total amplitude. Fits of exponentials to the ionic currents that are reported include a term reflecting the ∼80-ms component of the slow inactivation process.
Characterization of Kinetics and Voltage Dependences
For characterization of the time course of channel activation, a single-exponential function with time constant τ and delay δ,
 |
1 |
was fitted to the time course of the current, starting at the time when the current has reached 50% of its final value I max. It was shown in the preceding paper that, in the case of a sequential scheme with unidirectional transitions, δ provides a remarkably good estimate of the sum of the reciprocals of all of the rate constants, excluding the smallest one. Further, if one transition is rate limiting, its rate constant is well estimated by τ−1; this result also holds for branched models. In some cases, when this function was fitted to activation time courses, we added a second exponential term with a longer time constant to account for a slow relaxation that is seen at depolarized voltages.
As before, we assume that rate constants have exponential voltage dependences of the form
 |
 |
2 |
where the partial charges q αi and q βi are related to the gating charge movement z i accompanying a transition from state i − 1 to state i according to
 |
3 |
As a simple characterization of the equilibria of voltage-dependent processes, we use fits to a Boltzmann function,
 |
4 |
where q B is the effective charge parameter.
Values of quantities are given as mean ± SEM unless otherwise noted.
results
General Properties of V2 Channels
Comparison of WT and V2's equilibrium properties.
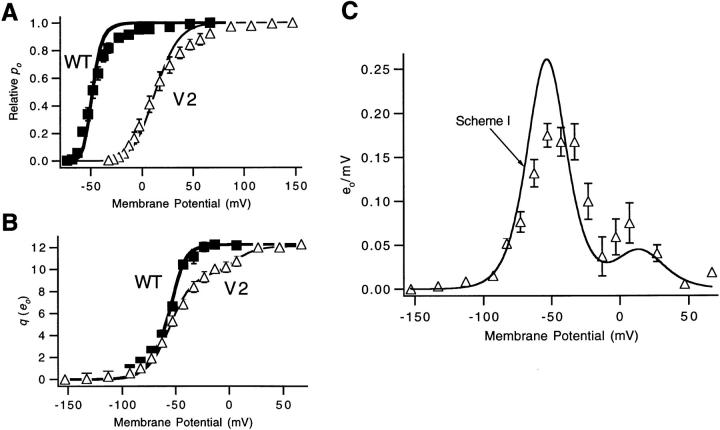
Fig. 1, A and B compares the voltage dependence of channel open probability P o and the single-channel charge movement q in WT and V2 channels. As described previously (Schoppa et al., 1992), the V2 mutation causes a large positive shift in the voltage dependence of channel opening, and makes the P o -V curve less steep. In fits of P o -V relations obtained in several patches, values for the Boltzmann charge parameter ranged from 3 to 4 e0 for WT, but from 1.5 to 2 e0 for V2. For the q-V relation, V2 causes a large positive shift in the voltage dependence of part of the charge movement, and also apparently reduces the steepness of the q-V relation. A number of possible explanations exist for WT's steep voltage dependence of P o and q (Bezanilla et al., 1994; Zagotta et al., 1994 a); for example, there may be positive cooperativity introduced by a late gating transition that is very forward biased. V2 might lower the voltage sensitivity of P o and q, if V2 alters the equilibrium of such a late gating transition.
Figure 1.
WT and V2's voltage dependence of charge movement and channel opening. (A) Voltage dependence of channel opening P o for WT (▪) and V2 (▵). The P o values were evaluated from macroscopic ionic currents as described in Fig. 1 of Schoppa and Sigworth (1998a) and were normalized to unity. Each value reflects one to nine experiments. Superimposed curves are fits of Scheme SI to the averaged data with V 1/2 values for k 1 equal to −59 and −54 mV, and V 1/2 values for k 2 equal to −54 and +14 mV, for WT and V2 respectively. (B) Voltage dependence of charge movement for WT (▪) and V2 (▵) scaled to match the maximal single-channel charge movement, q max = 12.3 e0 (Schoppa et al., 1992). Each value reflects one to seven experiments. Superimposed curves are fits to Scheme SI to the averaged WT and V2 data with parameter estimates given in A. (C) The derivative Δq/ΔV of V2's q-V relation was calculated from the difference in q measured between different voltages (in 10-mV increments, except 20-mV increments at V ≤ −93 and V > +7 mV). Each value reflects measurements in four patches. Besides the main peak centered near −50 mV, a second smaller peak is seen at depolarized voltages near +10 mV. The smooth curve is the derivative of the simulated q-V curve shown in B for V2.
In V2's q-V relation, there also appears to be an inflection near −10 mV. This is graphically illustrated in the plot of the derivative of V2's charge versus voltage in Fig. 1 C. The derivative plot has two peaks: the largest near −50 mV, which corresponds to the steepest portion of V2's q-V relation at negative voltages, and a second peak near +10 mV. These properties would be consistent with there being two distinct sets of transitions occurring over different voltage ranges. From the position of the inflection in the q-V relation (Fig. 1 B), which is near −13 mV, we can divide the charge movement into two parts, q L and q H, associated with the sets of transitions that occur at low and high voltages, respectively. A value of q H = 2.2 ± 0.3 e0 (n = 6) is estimated for the amount of charge that is associated with the set of transitions that move at high voltages.
Comparison of WT and V2 channel opening and “on” gating current kinetics.
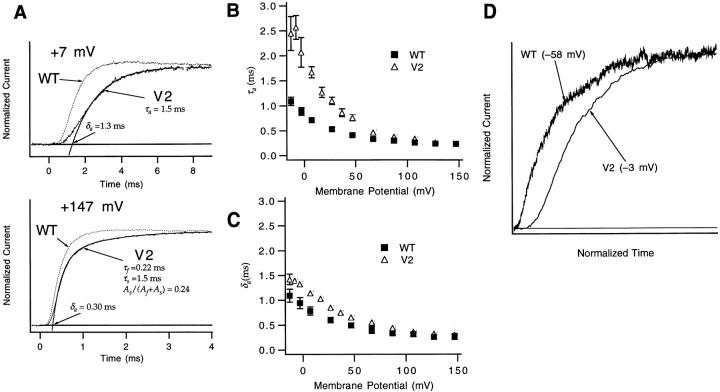
V2's general effects on gating kinetics are illustrated in the time courses of the macroscopic ionic current and gating currents in Figs. 2 and 3. In a comparison of channel opening time courses (Fig. 2), V2 displays somewhat slower kinetics at both low and high voltages. The difference at lower voltages is reflected in the differences in the values for the activation time constant τa, with V2 displaying τa values that are as much as two to three times slower than WT (Fig. 2 B). The τa values are, however, very similar above +60 mV. Over the entire voltage range, the delay in the channel opening time course is roughly similar to WT's (Fig. 2 C).
Figure 2.
V2's effects on activation kinetics. (A) At both low and high voltages, V2 has slower channel opening kinetics, reflected here in a comparison of WT and V2 currents at +7 and +147 mV. Patches w312 and v096. V2's ionic current at +7 mV was fitted to a single exponential to estimate the activation time constant τa and an activation delay δa. The current at +147 mV was fitted to the sum of two exponentials, I(t) = (A f + A s) − A f e −(t−δa)/τa +A s e −(t−δa)/τs. The faster time constant is τa, which is taken to reflect the kinetics of the main activation path (Schoppa and Sigworth, 1998a ). (B) The derived values for τa for V2 are larger than WT at V < +67 mV, but are similar at higher voltages. Individual values reflect two to seven experiments. Error bars are smaller than the symbols in many cases. (C) WT and V2 have similar, though not identical, values for the activation delay δa (from the same experiments as in B). (D) Comparison of the sigmoidicity of WT and V2 ionic currents at voltages where the two channels have P o ≅ 0.2. The current traces have normalized amplitudes and have their time axes scaled to yield the same rising phase kinetics of the current. Patches w312 and v142.
Figure 3.
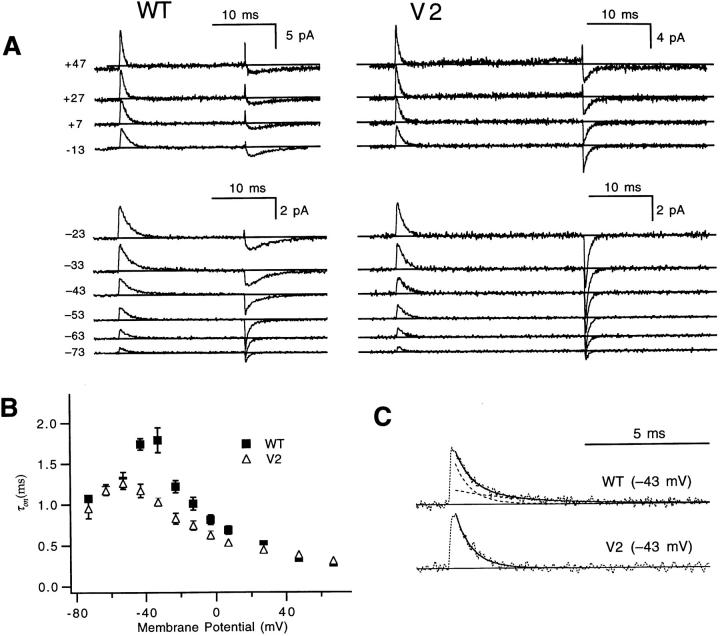
V2's effects on gating currents. (A) WT (left) and V2's (right) gating currents induced by voltage steps from −93 mV to test voltages between −73 and +47 mV. WT and V2 have roughly similar on current time courses at most voltages, but V2 displays markedly faster off current kinetics after the larger depolarizations. The upward deflections at the end of the test pulses at depolarized voltages reflect a leak subtraction artifact arising from charge movement that occurs during the −133- to −153-mV voltage pulse used to calculate the leak and capacitive currents (Stühmer et al., 1991). Patches w212 and v219. (B) The time constant τon fitted to the decay of WT and V2's on gating currents have similar values at most voltages, but are nearly two times faster at some intermediate voltages near −40 mV. Each value reflects three to seven experiments, except WT's value at +67 mV (n = 1). (C) V2's faster decaying on gating current at −43 mV in A reflects the absence of a slow component that is present in WT's currents, associated with WT's channel opening. WT's trace (top) has been fitted to a sum of two exponentials with time constants equal to 1.2 and 4.8 ms (dashed curves). The bottom trace shows that a scaled version of the fast component (τ = 1.2 ms) accounts for V2's current very well. Horizontal lines reflect the estimated baseline of the current, taken from the mean current during the last 2 ms of the test pulse.
Interpreting the ionic currents is complicated by the fact that at high voltages (V ≥ +67 mV), Shaker's channel opening time course has a slow component that reflects the kinetics of an alternate activation path, through the closed states Ci (Schoppa and Sigworth, 1998a ). However, in fits of the sum of two exponentials to the channel opening time course at V ≥ +67 mV, V2 causes no apparent effect on the time constant of the faster component (Fig. 2 B), which we take to be τa, reflecting the kinetics of the main activation path. It will be shown more explicitly below that the difference in the appearance of the currents at high voltages reflects a higher propensity for V2 to enter into the slow activation path.
The on gating current time courses of V2 (Fig. 3 A) are qualitatively similar to WT's. The similar time courses at many of the voltages are reflected in the similar values for the time constant τon of an exponential fitted to the decay of the on currents (Fig. 3 B). The similar gating current time courses at voltages above 0 mV, together with the discrepancies in WT and V2 channel opening time courses at the same voltages (Fig. 2 A), implies that V2 has little effect on early gating transitions, but an effect on late transitions. For a sequential gating mechanism, decreasing the rate of an early gating transition would slow both the ionic and gating current time courses, but a change in a late transition could slow channel opening without affecting the gating current.
Some moderate differences in the τon values are apparent at intermediate voltages, near −40 mV, where V2's on currents decay nearly twice as rapidly as WT's. This difference might be an indirect effect of V2's shifted voltage dependence of channel opening. It has been reported that WT's on currents at these voltages include a slow component that reflects the slow kinetics of channel opening (Bezanilla et al., 1994). Since V2 does not open at these voltages, this component would not be expected to appear in V2's currents (McCormack et al., 1994). Consistent with this simple interpretation, WT's on currents at −43 mV (Fig. 3 C) can be fitted by the sum of two exponentials with one component having a time constant (τ = 4.2 ± 0.5 ms; n = 4) that matches WT's activation time constant at this voltage (τa = 4.9 ± 0.9 ms; n = 5), and the other component having a time constant (τ = 1.2 ± 0.2 ms; n = 4) that matches the time constant of the single exponential fitted to V2 gating currents (τ = 1.2 ± 0.1 ms; n = 4).
In contrast to the modest effects on the on gating currents, V2 has a dramatic effect on the decay of the “off” gating currents. After moderate and large depolarizations, V2's gating currents decay very much more rapidly than WT's. To explain V2's faster off gating currents, we recognize first that WT's off currents after large, long depolarizations have a slow decay time course that reflects the slow return from the open state but a rapid decay time course after small or short depolarizations that fail to open the channel (Zagotta et al., 1994; Bezanilla et al., 1994). V2's faster off current after intermediate depolarizations (e.g., to −33 mV) could, then, just be due to the fact that V2 does not open at these voltages (Fig. 1 A). The faster off currents also seen after depolarizations that are large enough to open V2 channels (V ≥ −13 mV) are to be expected since, as shown below, V2 dramatically speeds the deactivation time course.
Comparison of WT and V2 channel opening kinetics at equivalent Po.
A final general kinetic effect of the V2 mutation is illustrated in Fig. 2 D, where WT and V2 activation time courses are compared at voltages where P o is similar for the two channels. The displayed currents are at −58 mV for WT and −3 mV for V2, where P o is ∼0.2 for the two channels. We follow the strategy used by Zagotta et al. (1994 a) by normalizing the amplitude and the time course of the currents to make comparisons about the sigmoidicity of WT and V2 currents.
WT's activation time course is actually ∼20-fold slower than V2's, but when the time scales have been adjusted to match the activation time constants τa, V2's activation time course is seen to be much more sigmoidal than WT's. One explanation for the slow rise and relatively small delay of WT currents is that there is positive cooperativity in the mechanism of activation at these voltages, arising from the presence of forward-biased late transitions (Zagotta et al., 1994 b). The faster rise but approximately equal delay in V2 activation is consistent with unchanged early activation steps but a late transition that is less forward biased.
Assignment of Rate Constants from Macroscopic Currents
The preceding sections have outlined the general differences in activation gating for WT and V2 channels. We now consider the rates of individual V2 gating transitions. For this analysis, we use the same general framework that was used to assign rates for WT in the previous paper (Schoppa et al., 1998a), in which the gating process is approximated by a linear sequence of transitions:
The rates shown are those that were evaluated for WT in the previous paper. To obtain values for forward rate constants, we consider mainly macroscopic ionic and gating currents obtained at depolarized voltages (V ≥ −13 mV), where V2's charge movement is mostly complete (Fig. 1 B). Backward rates are mainly evaluated from macroscopic ionic and gating currents measured at hyperpolarized voltages (V ≤ −93 mV), where little charge movement occurs.
Estimates of α1, β1, and αp.
For the WT channel, we were able to assign values for three rate constants associated with early and intermediate transitions (Schoppa and Sigworth, 1998a ). The forward rate of the first transition α1 was found to be rate limiting for channel activation at voltages near 0 mV, and estimates for α1 were obtained from the kinetics of channel opening and gating currents. For V2, estimates of α1 could be obtained with only a more limited analysis. V2's differential effects on the channel opening and on gating currents at voltages near 0 mV imply that the rate-limiting step to channel opening is a later transition. We assumed that the decay of V2's on currents still reflects α1, and estimates for α1(0) = 1,270 s−1 (n = 7) and qα1 = 0.28 ± 0.02 e0 were obtained (Fig. 4 A) that are similar to those obtained for WT (α1(0) = 1,200 s−1, n = 7, and qα1 = 0.36 e0). Estimates of the forward rate αp of the transition that is rate limiting at large positive voltages for V2 were obtained from the values of the activation time constant τa at very large depolarizations (V ≥ +87 mV; Fig. 4 B). The derived estimates for V2's αp(0) = 1,400 ± 100 s−1 (n = 5) and qαp(0) = 0.19 ± 0.01 e0 are similar to those obtained for WT (αp(0) = 2,100 s−1 and qαp(0) = 0.17 e0).
Estimates of the backward rate of the first transition β1 were obtained from gating currents induced by voltage steps between −93 mV and more hyperpolarized voltages (Fig. 4 C). We assume that these voltages are sufficiently negative that the resulting currents reflect only charge movement in the first gating step (Schoppa and Sigworth, 1998a ). The traces of V2's gating currents at these voltages are virtually superimposable with WT's, which is consistent with V2 having no significant effect on β1. Indeed, the estimates of β1(0) = 260 ± 100 s−1 (n = 3) and q β1 = −0.48 ± 0.05 e0 derived from these data are similar to those obtained for WT (β1(0) = 190 s−1 and q β1 = −0.53 e0).
Estimate of αN.
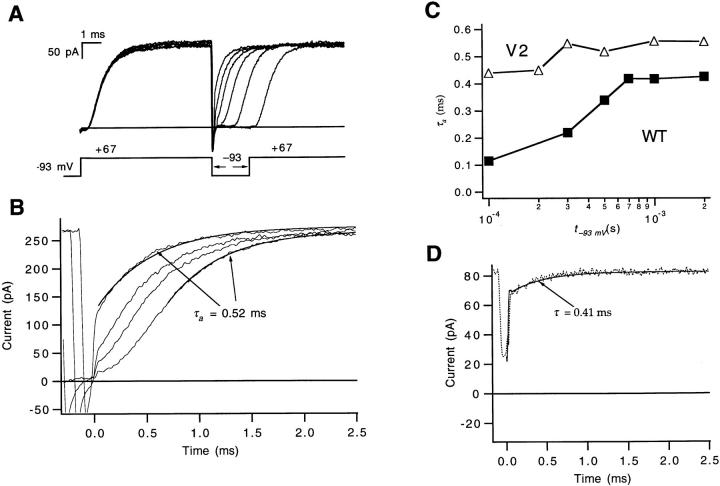
For WT, a direct estimate of the forward rate αN of the final transition was obtained from a rapid component in the time course of reactivation observed after very short hyperpolarizations. Fig. 5 A illustrates V2's reactivation time courses at +67 mV after hyperpolarizations with a fixed amplitude V h of −93 mV, but of various durations t h. In contrast to what was observed for WT the rising kinetics of V2's reactivation time course shows little dependence on t h (Fig. 5, B and C). The reactivation time course for the shortest t h = 100 μs is reasonably well accounted for by an exponential with the same time constant that is fitted to the reactivation time course for large t h values. No fast reactivating current is observed either when V h is changed to −13 mV (Fig. 5 D), which may be expected to be more effective in loading channels into closed states that are near the open state.
Figure 5.
Failure to estimate αN from V2's reactivation time courses. (A) V2's ionic currents elicited by a triple-pulse stimulus, using a pair of depolarizations to +67 mV separated by a voltage step to a hyperpolarized voltage V h = −93 mV. The displayed currents correspond to hyperpolarizations of different durations t h between 100 and 2,000 μs. Tail currents during the second pulse were inward since the pipette solution contained 5.4 mM K+ replacing an equivalent amount of the N-methyl- d-glucamine+ (NMDG+). Data were filtered at 12 kHz. Patch v165. (B) No fast-reactivating component is evident in the same traces that have been expanded and time shifted to align the start of the test pulses. Only traces corresponding to t h = 100, 200, 300, and 500 μs are shown. The current for t h = 500 μs has been fitted to a single exponential (with τa = 0.52 ms), and the current for t h = 100 μs is shown to be reasonably described by an exponential with the same time constant. (C) The negligible effect of prepulses of different t h on V2's reactivation time course compares with the strong dependence for WT, reflected in the nearly fourfold decrease in the derived τa values for shorter t h. Patches w448 and v165. (D) V2's reactivation time course at +67 mV in a different patch (v162) for V h = −13 mV and t h = 100 μs. To demonstrate that we have not missed a fast reactivating component that may have been obscured in the instantaneous current change, the reactivation time course has been fitted to Eq. 7 from Schoppa and Sigworth (1998a), which explicitly takes into account the delays in the recording system. It was assumed that the change in current due to gating is described by a function x(t) with a time constant (τ = 0.41 ms) that matches the τa value derived from V2's ionic current at +67 mV, measured in the absence of any conditioning pulses. The amplitude (−15 pA) was taken from the amount of decay of V2's tail current in the same patch at 100 μs. Data were filtered at 12 kHz.
One explanation for the absence of a fast component in V2's reactivation time course would be that V2 slows αN. An alternative explanation is that V2 accelerates the backward rate βN-1 so that the occupancy in the last closed state is never high enough for channels reactivating with the kinetics defined by αN to be observed. We may nevertheless place a lower bound on the value of αN from fits to the reactivation time courses in Fig. 5. There the time constant of the rate-limiting step τa = 0.33 ms implies that αN ≥ 3,000 s−1 at +67 mV. Using the estimate of q αN obtained for WT, this yields αN(0) ≥ 1,900 s−1. This lower limit is three to four times smaller than the estimate of αN for WT (αN(0) = 7,000 s−1).
Estimate of βN.
The most direct estimate of WT's channel closing rate βN was obtained from the time course of the ionic tail currents, although rather elaborate measures were required to account for the fact that WT's channel deactivation time course at most voltages reflects multiple reopenings of the channel. Estimates for WT's βN were obtained from fits of the sum of two exponentials to the tail currents at extremely hyperpolarized voltages (between −153 and −203 mV). V2's βN, however, could be evaluated using a much simpler strategy.
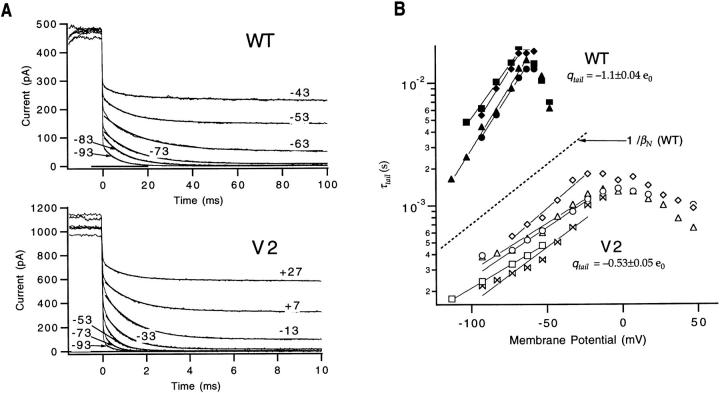
Fig. 6 A illustrates traces of WT's and V2's tail currents that were measured at voltages down to −93 mV. At all voltages, V2's deactivation is much faster than WT's. When a single exponential is fitted to these currents, it is seen that the time constants τtail are not only smaller but have a weaker voltage dependence for V2 (Fig. 6 B). Fitting the voltage dependence of τtail results in estimates for q tail of 1.1 ± 0.04 e0 (n = 4) and 0.53 ± 0.05 e0 (n = 5) for WT and V2, respectively. On the other hand, V2's q tail nearly matches the voltage sensitivity of βN that was estimated for WT (q βN = −0.57 e0). The similarity between V2's q tail and q βN implies that V2 changes the deactivation process from one that reflects the last two transitions to one that is a simple function of the channel closing rate βN. Consistent with the V2's tail current time course reflecting a single transition, it is reasonably well accounted by a single exponential (Fig. 6 A). The τtail values at V ≤ −23 mV yielded an estimate for βN(0) = 580 ± 100 s−1 (n = 5), which is approximately four times larger than the estimate for WT (βN(0) = 150 s−1).
Figure 6.
Estimate of βN. (A) Across a range of test voltages, WT's tail currents decay much more rapidly than V2's (taking into account the different time scales). The tail currents were measured after prepulses to +7 and +67 mV, respectively, for WT and V2; they were outward since measurements were made with 0 mM pipette K+. Estimates of the tail current decay time constant τtail were obtained by fitting the deactivation phase of the tail current to a single exponential. (B) The τtail values obtained from four WT (closed symbols) and five V2 (open symbols) patches were fitted to an exponential function of voltage yielding estimates of τtail(0) and q tail. Fits were made only to the τtail values at voltages at which the time constant values become faster with increasingly negative voltages (V ≤ −63 mV for WT and V ≤ −23 mV for V2). For most of the patches, currents were measured in 0 mM pipette K+, but for one patch each for WT and V2, currents were measured with 14 mM pipette K+ (▴ and □, respectively). For comparison, the value of 1/βN derived for WT in Schoppa and Sigworth (1998a) is plotted as a straight dashed line, indicating that V2's tail current decay has a similar voltage sensitivity as the channel closing rate.
For WT channels, estimates for the reverse rate of the second to last transition βN-1 were obtained by simultaneously considering the fast component in the reactivation time course that corresponds to αN, and also the double-exponential nature of the tail currents. This analysis could not be performed on V2 since it lacks a fast component in the reactivation time course and the tail currents do not show multiple components. The assignment of V2's βN-1 will rely on single channel data described below.
V2's effect on αd and βd.
While we were unable to assign values for the forward and backward rates of any other of V2's transitions from macroscopic current measurements, these data can be used to test whether V2 causes a change in the rates of these transitions. The rates of these additional transitions, which make a major contribution to the delay in activation, have been assigned the parameters αd and βd. As described in the preceding paper, the parameters reflect the summed properties of many intermediate transitions.
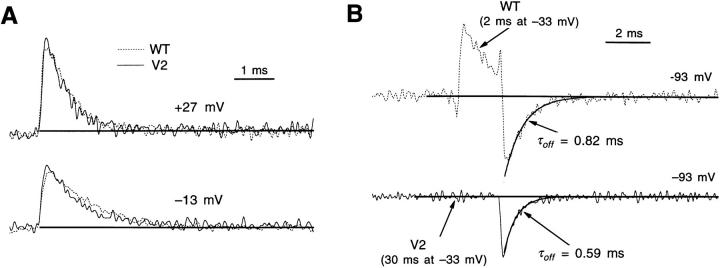
Information about the effect of V2 on αd and βd was first obtained by comparing WT's and V2's on and off gating current time courses. While the decay of the on currents at depolarized voltages reflects the rate-limiting α1, information about the rates of the transitions that follow α1 resides in the time course of current near its peak. Fig. 7 A superimposes WT and V2 on currents that were measured at two depolarized voltages (−13 and +27 mV). The time courses match quite well, consistent with V2 having similar forward rates for all of the rapid intermediate transitions. V2's effect on reverse rates was evaluated by comparing WT's and V2's off currents. To remove the contribution of channels residing in the open state to the off current time course, which would obscure the analysis of the intermediate transitions, we compared WT's and V2's off gating currents measured after prepulses that preload channels into intermediate and late closed states but not the open state. Fig. 7 B compares V2's off currents after a long depolarization to −33 mV with WT's off currents measured after a 2-ms depolarization to the same voltage. These prepulses move most (∼70–80%) of the charge but result in few open channels (<15% and <<1% for WT and V2, respectively). The similar off current kinetics suggests that V2 has little effect on the backward rates of virtually all of the gating transitions, apart from the final transitions.
Figure 7.
V2 has little effect on αd and βd gating currents. (A) WT (dotted curves) and V2 have nearly superimposable on gating currents at −13 and +27 mV, including similar time courses near the peak of the current. The current amplitudes were scaled slightly so that the peaks match. Patches w212 and v219. (B) Comparison of WT's and V2's off gating currents, following voltage steps that preload channels into late closed states but not the open state. For WT, the current was measured after a 2-ms pulse to −33 mV, and V2's current was measured after a 20-ms pulse to the same voltage. WT and V2's off currents have been fitted to a single exponential, yielding similar time constants τoff. The slightly slower time course for WT probably reflects the contribution of the small fraction of channels that are open at that end of the prepulse, which contribute a small slow component to the off current. Patches w217 and v219.
A second measure of V2's effect on αd and βd was provided by a comparison of the delay in the macroscopic channel opening time course. At depolarized voltages, the delay is expected to reflect the forward rates of all but the rate-limiting step to channel opening (Schoppa and Sigworth, 1998a ). The δa values for V2 (Fig. 2 C) are very similar to those of WT, tending however to be slightly longer (by 10–30%). The small difference in the delay is consistent with V2 having a small effect on the forward rates of a large number of transitions. A measure of βd was obtained by analyzing the delay in V2's reactivation time course after hyperpolarizations of different voltages and of different durations t h, using a strategy similar to that used for WT in the previous paper (Schoppa and Sigworth, 1998a ). The resulting relationships between t h and the delay δa are nearly identical for WT and V2 (data not shown), which is consistent with V2 having little effect on βd.
V2 also had little effect in an experiment that evaluated the Cole-Moore delay (Cole and Moore, 1960). This experiment evaluates the effect of different amplitude prepulses on the delay in the channel opening during a subsequent test pulse. (These data are not shown here, but see Fig. 18 in Schoppa and Sigworth, 1998b ). Since the voltage dependence of the delay reflects the equilibria of the various transitions that contribute to the delay, these results suggest, roughly, that the ratio of αd and βd for WT and V2 is similar.
More observations about V2's off gating currents measured after intermediate amplitude depolarizations.
We report here results obtained from one additional experiment that was performed for V2. Off gating currents were measured after prepulses of a fixed amplitude (−3 mV) with variable test voltages between −63 and −113 mV (Fig. 8 A). Since the prepulse moves most (85%) of V2's charge but opens few V2 channels (P o = 0.2), the measured off currents should reflect the backward rates of both the first and intermediate transitions.
These currents were first used to obtain a rough estimate of the charge q βd that determines the voltage sensitivity of the backward rates of intermediate transitions. Single exponentials were fitted to these currents to estimate a decay time constant τoff; the τoff values were then fitted to an exponential function of voltage, yielding q βd estimates in three patches of −0.44, −0.54, and −0.61 e0.
Single exponentials failed to fit a rapid component that is visible at some test voltages, however. The deviation is illustrated in the expanded traces of off current at −63 mV measured from two patches in Fig. 8 B. We take the presence of a fast component in the off current to reflect the presence of fast intermediate transitions; in the context of a sequential scheme, a fast component of the gating current must reflect the kinetics of the first transitions that occur during the relaxation. In these two patches, no fast component was observed in the off current at voltages more negative than −63 mV (data not shown), which might imply that the fast and slow components have different voltage dependences.
Analysis of Single-Channel Behavior
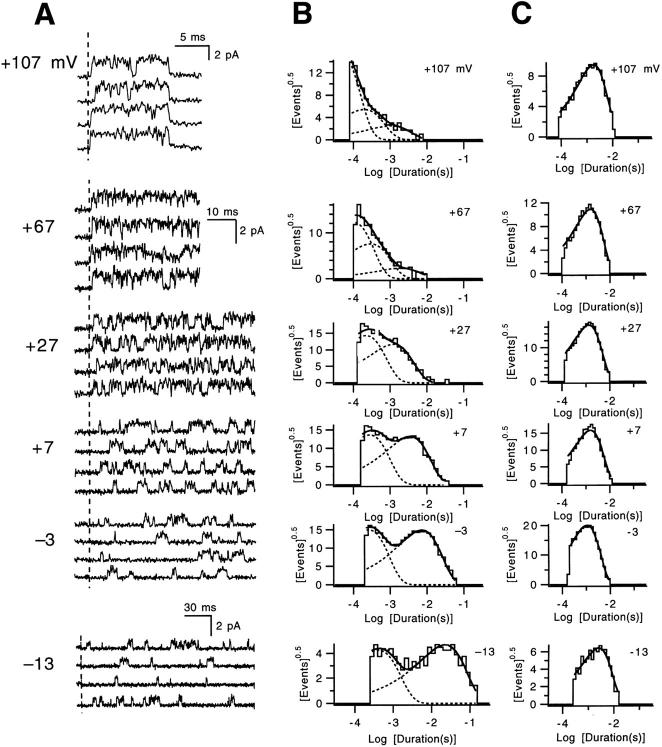
Additional information about V2's effects on the rates of the transitions nearest the open state was obtained from measurements of single channel currents. We begin by describing V2's single channel activity (Fig. 9 A). At voltages where P o is low (−13 and −3 mV), V2 has a latency to first opening of ∼10 ms, and long closures of a similar duration that separate brief (2–3-ms) bursts of channel openings are seen. During the bursts, the channel sometimes closes into short-lived closed states. With an increase in voltage, the main changes in the single channel activity are reductions in the time to first opening and the duration of the long closures (compare the traces at −13 and +7 mV). At the highest voltages (+107 mV), V2's single channels are similar to WT's (Hoshi et al., 1994; Schoppa and Sigworth, 1998a ), opening rapidly at the beginning of the pulse and remaining open for most of the trace, closing occasionally into short-lived closed states.
Figure 9.
V2 single channel activity at voltages between −13 and +107 mV. (A) Single channel activity induced by steps from −93 mV to the indicated voltages. The data displayed at voltages between −3 and +67 mV reflect measurements in one patch (v433) and are plotted on the same scale. The data at the two extreme voltages reflect two additional patches (v428 and v344). The dashed vertical line reflects the beginning of the test pulse, and, for all but the currents at +107 mV, the currents measured after the test pulse are not shown. In our measurements, V2's single channel conductance was usually ∼30% smaller than WT's (corresponding to a change in conductance from 11 to 8 pS). (B) Closed time histograms derived from the experiments shown in A. Superimposed solid curves on histograms are fits to mixtures of two or three exponentials; dashed curves illustrate each component. Each histogram contains at least 630 events. (C) Open time histograms, each fitted with a single exponential.
The closed dwell time histograms that correspond to these data at voltages between −13 and +27 mV (Fig. 9 B) were well fitted by a mixture of two exponentials. With increasing voltage there is a marked reduction in the duration of the long closures, while the relative amplitude of the long closure component and the duration of short closures show less change. The closed time histograms obtained at the highest voltages (+67 and +107 mV) display the three populations of closures characteristic of WT at the same voltages (Schoppa and Sigworth, 1998a ). At all voltages, V2's open time histograms (Fig. 9 C) were well fitted by a single exponential, which is consistent with a single open state (Hoshi et al., 1994).
V2's effects on transitions to Ci, Cf1, and Cf2.
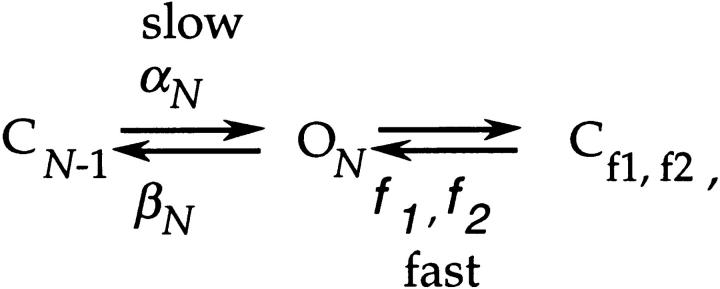
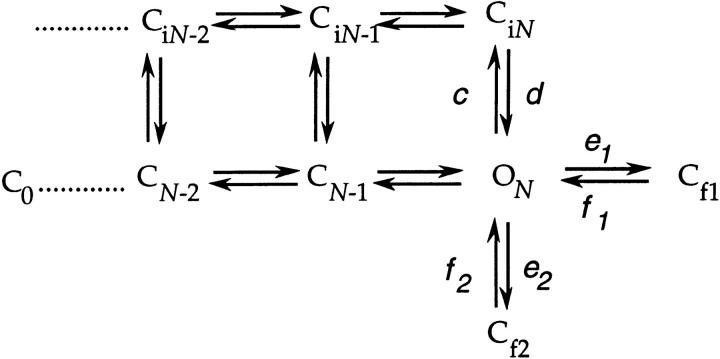
Single channel data from WT channels have been useful for obtaining information about states that are not in the activation path (Hoshi et al., 1994; Schoppa and Sigworth, 1998a ). In the previous paper, we suggested that there are several such states:
These include the states Cf1 and Cf2 that correspond to the observed short duration closures at depolarized voltages, and a set of states Ci that corresponds to the observed 1–2-ms component in the closed time histograms. Apparently, the Ci states can be entered from closed states that are in the activation path as well as from the open state.
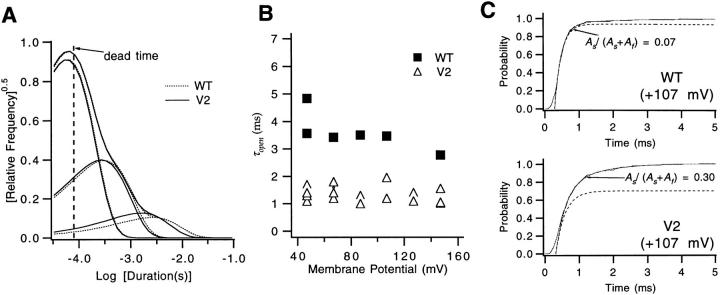
The rates d, f 1, and f 2 of the transitions from the states CiN, Cf1, and Cf2 to the open state are reflected in the closed time distributions at very depolarized voltages, where the open channel rarely closes into the activation path. Fig. 10 A superimposes the “average” WT and V2 closed time histograms at high voltages (V ≥ +47 mV). The shapes of the histograms cannot give direct information about rate constants, since many of the closures are poorly resolved; however, the fact that V2's average histogram matches WT's is consistent with V2 not altering the three rates.
Figure 10.
V2's effects on transitions to closed states outside of the main activation path. (A) WT (dotted curves) and V2 have nearly superimposable closed dwell-time histograms at very large depolarizations, indicating that the V2 has little effect on the transitions from C iN, C f1, and C f2 that correspond to each of the three components in these histograms. The time constants and amplitudes of the three exponentials fitted to 5 WT and 22 V2 closed time histograms at V ≥ +47 mV were averaged, and the curves reflect the derived means. (B) The measured open times for V2 at large depolarizations (▵) are approximately one-third as long as WT's (▪), indicating that V2 destabilizes the open state relative to C iN, C f1, and C f2. Open times are uncorrected for missed events, but may be compared since WT and V2 display the same closed time distributions at these voltages (from A), and the analysis filtering bandwidths were set to be equal for WT and V2. Each value reflects a single experiment. (C) WT (top) and V2 (bottom) cumulative first latency histograms at +107 mV were fitted to the sum of two exponentials (see legend for Fig. 2 A), starting at the time when P = 0.5. The dashed curves reflect the fast component in the same fits. The main difference between the fits for WT and V2 is the amplitude of the slow component with time constant τs, indicating that V2 increases the probability that a channel enters Ci states from closed states in the activation path. In the fitting, the values for τs for WT and V2 were 1.9 and 1.3 ms, respectively; values for the fast time constant τa were 0.21 and 0.29 ms. The values for A f and A s in the fits were adjusted for the delay in the fitted function. The two histograms reflect 182 and 258 sweeps, respectively. Patches w266 and v344.
The sum of the rates c, e 1, and e 2 of the transition from the open state to each of these three states determines the channel open time at very depolarized voltages (Fig. 10 B). While the poorly resolved short closures prevented a reliable estimate of the true channel open time, we could obtain an estimate of the effect that V2 has on these rates. Assuming that WT and V2 have identical closed time distributions at these voltages, an estimate of the effect of V2 on the stability of the open state may be made without correcting for missed events. At all voltages, WT's uncorrected open times are three- to fourfold longer than V2's. This, taken together with the similar shapes of WT and V2's closed time histograms, would suggest that V2 increases each of the rates by a factor of 3–4.
Finally, to evaluate V2's effect on the transition to Ci states from closed states in the activation path, we compared the cumulative first latency histograms of WT and V2 at very depolarized voltages (Fig. 10 C). WT's latency histograms at V ≥ +47 mV display a slow component that corresponds to channels entering Ci from closed states in the activation path (Schoppa and Sigworth, 1998a ). Compared with the WT latency histogram at +107 mV, V2's histogram has a slow component approximately four times larger in amplitude; the fitted fast and slow time constants are, however, very similar. An increased amplitude slow component was also consistently observed in the macroscopic activation time course at large depolarizations (V ≥ +47 mV), where, on average, V2's slow component accounted for 26 ± 2% of the time course (n = 28) compared with WT's 8 ± 1% (n = 21). Since it is not known from which closed states Shaker channels can enter Ci states, it is not clear whether the larger slow component for V2 arises from increased rates for transitions into Ci states, or simply is an effect of altered occupancies of states in the activation pathway.
Estimate of βN and βN-1 from single channels.
V2's single channel data could also be used to estimate the rates of the final transitions that are in the activation path. Indeed, one relevant observation has already been presented, which is V2's three- to fourfold shorter channel open times at depolarized voltages (Fig. 10 B). At these high voltages, most of the closures that determine the channel open time reflect closures into states that are not in the activation path, but it is notable that the magnitude of V2's effect on the open times nearly matches the fourfold faster channel closing rate into the activation path βN that was estimated from macroscopic tail currents. The rates of channel closure into the states that are not in the activation path and βN would all be expected to reflect the stability of the channel open state.
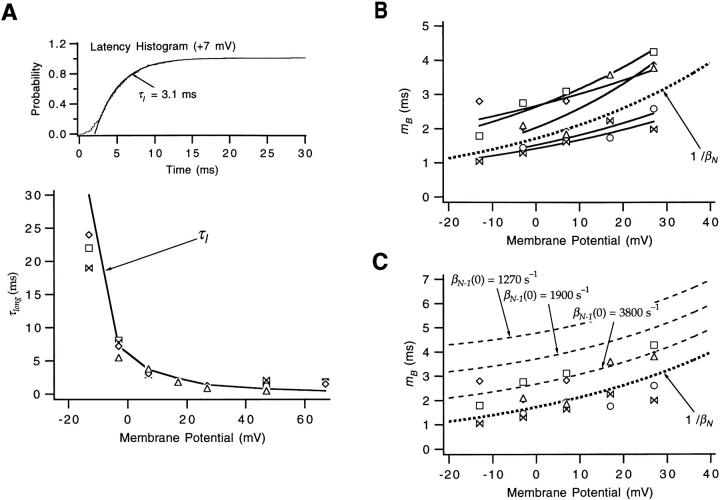
Other more direct information about the final transitions resides in the relatively well resolved single channel activity at V2's activation voltages (between −13 and +27 mV). The large difference in the voltage range where V2 channels open compared with the voltage range of charge movement (Fig. 1, A and B) suggests that the single channel activity at these voltages reflects the properties of just the subset of transitions that occur at high voltages. The fact that the observed long closures have a mean duration that matches the time constant fitted to the first latency histograms (Fig. 11 A) would indicate that these closures reflect sojourns in states in the activation path. We may, then, expect that the single channel activity reflects the rates αN, βN, and βN-1 of the last two transitions in the activation path.
Figure 11.
Estimates of βN-1 from V2's single-channel burst durations. (A) V2's cumulative first latency histograms at V2's activation voltages were well-fitted by a single exponential; an example is shown at top. As shown in the plot at the bottom, the time constant τl of the fitted exponential is similar to the time constant τlong of the longest duration exponential component in V2's closed time histograms. The τlong values at V ≤ +27 mV always reflect the longer of two fitted exponentials, and all but one of the τlong values at V ≥ +47 mV reflects the longest of three fitted exponentials. At high voltages, τlong reflects closures in Ci states and is generally longer than the latency time constant. Values reflect data obtained from five patches. (B) The mean duration m B of the bursts of openings separated by long closures had values similar to the reciprocal of V2's channel closing rate (bold dotted curve), defined by the parameters βN(0) = 580 s−1 and q βN = −0.53 e0. The m B values at V ≤ +27 mV were calculated by normalizing the measured channel open time by the fraction of the measured closures that correspond to the longer duration exponential component in fits of the closed time histograms to the sum of two exponentials. Solid curves reflect fits of the m B values obtained in each of the patches to an exponential, yielding estimates of m B(0) and q mB. Data reflect the same experiments as in A. (C) The same m B values as in B have been superimposed with the predictions of Eq. 5 for different values of βN-1(0). In the calculations, αN(0) was assumed to be 1,900 s−1. The charges q αN = 0.18 e0 and q βN-1 = −0.30 e0 were the WT values.
The approach that will be used in this analysis is first to consider two simple schemes that could each, in principle, describe V2's single channel activity at its activation voltages. The first possibility is reflected by the reduced three-state scheme,
in which the observed short duration closures are entirely contributed by sojourns in the two closed states Cf1 and Cf2 that are outside of the main activation path. The long closures would reflect sojourns in late states in the activation path, here represented by the single state CN-1. The observed bursts of openings would reflect the channel traversing back and forth between the open state and Cf1 and Cf2, and is terminated when the channel closes into CN-1. The second possibility that we consider is the four-state scheme,
in which the short duration closures are contributed by sojourns in the states Cf1 and Cf2, as well as sojourns in CN-1. The observed long closures would then reflect sojourns in closed states that are in the activation path that occur before CN-1, and the bursts of openings would reflect channels traversing from the open state into Cf1, Cf2, and CN-1, and are terminated when the channel closes back into CN-2.
An easy way to discriminate between these two possibilities takes advantage of the reliable estimate for V2's channel closing rate βN that has already been obtained (Fig. 6). Since, during the bursts of openings, the amount of time that the channel spends in the open state is long relative to the amount of time it spends in closed states (Fig. 9 A), Scheme SIV predicts that the mean burst duration m B will be equal to 1/βN . Scheme SV predicts that m B will be larger than 1/βN by an amount that is a function of the ratio of αN to βN-1. Fig. 11 B compares 1/βN with values for m B obtained in five separate patches. This comparison indicates that these bursts apparently have the same duration as 1/βN. Fitting an exponential to the m B values at different voltages yields estimates m B(0) = 1.9 ± 0.3 ms and q mB = 0.45 ± 0.05 e0, which are nearly identical to the values of 1/βN (1/βN(0) = 1.7 ms and −q βN = 0.53 e0). These results imply that the bursts of openings are terminated by the channel closing into the activation path and that Scheme SIV is a better representation of V2's single channel activity at these voltages.
Scheme IV.
Scheme V.
Consideration of the sum of the rate constants indicates that Scheme SIV cannot be explicitly correct. In particular, Scheme SIV implies that the long closures in the single channel activity correspond to sojourns in the last closed state in the activation path C N-1, but this would be incompatible with what is known about the rate αN from macroscopic currents. The observed long closures are ten milliseconds in duration (at −3 mV), but our lower bound estimate for αN(0) is 1,900 s−1, which would imply that the closures that correspond to sojourns in C N-1 (which is given by the reciprocal of the sum of αN and βN-1) can be no longer than 0.5 ms at this voltage. We may reconcile this discrepancy by an extension of Scheme SIV,
in which we now assume a relatively large value for αN but an even larger value for βN-1. For Scheme SVI, the bursts of openings will nearly always be terminated by channel closures into the activation path since a channel that closes into C N-1 will more frequently proceed back into CN-2 or earlier closed states in the activation path rather than enter back into the open state. The long closures would arise in the absence of any rate that is very slow due to the same reason: a channel starting in earlier closed states that are in the activation path that enters into C N-1 will almost always proceed back into earlier closed states than enter the open state.
Scheme VI.
These results have obvious implications for estimating βN-1. If we assume a value for αN(0) = 1,900 s−1, the similarity in the burst duration and 1/βN would suggest that V2's βN-1(0) is substantially larger than 1,900 s−1. Some insight into the magnitude of βN-1(0) is provided by a strategy in which we compare the measured burst duration with the predictions for the bursts, assuming a model in which the bursts are determined by channel openings and closures in C N-1. For this model, m B is given by
 |
5 |
(Here we have neglected the effect of dwells in Cf1 and Cf2, which, because they are brief and of low occupancy, will have little effect on the burst duration.) In Fig. 11 C, a family of curves is shown superimposed on the burst length values, computed assuming the lower bound estimate of αN(0) and various values for βN-1 . The m B values are perhaps best described by βN-1 = ∞• (the curve reflecting 1/βN), but a value for βN-1(0) that is as small as 3,800 s−1 cannot be ruled out. Values for βN-1(0) that are smaller than 3,800 s−1, however, predict a burst length that is too long. A value for βN-1(0) ≥ 3,800 s−1 (compared with WT's βN-1(0) = 320 s−1) implies that the V2 mutation causes a >10-fold change in βN-1.
discussion
The V2 mutation (L382V in the Shaker B sequence) causes a large positive shift and a reduction in the voltage sensitivity of opening of the Shaker potassium channel, but does not change the total gating charge (Schoppa et al., 1992). On the basis of the detailed study presented here, we find no reason to expect that this mutation causes a fundamental change in the channel activation process; instead, the mutation's effects appear to be limited to changes in a few rate constants, those governing late transitions that lead to channel opening.
Summary of V2's Effects
Besides V2's effects on the equilibrium gating properties, V2's qualitative effects on channel kinetics are (a) to slow channel opening at depolarized voltages, (b) to increase the sigmoidicity of the channel opening time course at the activation voltages, and (c) to make the tail currents and off gating currents decay more quickly. We have presented arguments that each of these differences can, at least in principle, be explained by a change in late transitions.
A more quantitative comparison of different rates indicates that V2's effects might, in fact, be limited to the final two gating transitions. Here, we have analyzed V2's currents to obtain first-pass estimates of rate constants in a way that parallels the study of WT in the previous paper. These results are summarized in Tables I and II. One marked effect is a three- to fourfold acceleration in the channel closing rate into the activation path (βN), as evaluated from ionic tail currents. Such a magnitude of an effect on the stability of the open state was also verified from an analysis of single channel open times at depolarized voltages (reflected in the rates c, e 1, and e 2). V2 apparently has a more profound effect on the backward rate from the final closed state (βN-1); this rate for V2, which is at least 10× larger than WT's, was assigned from the single channel burst durations at voltages between −13 and +27 mV. We have obtained a lower bound estimate of V2's channel opening rate αN from V2's reactivation time course, but, in fact, we do not know if V2 actually changes this rate at all.
Table I.
Estimates of Rate Constants for Transitions in the Activation Path
| Rate at 0 mV | ||||
|---|---|---|---|---|
| WT | V2* | Partial charge | ||
| α1(0) = 1200 s−1 | α1(0) = 1350 s−1 | qα1 = 0.36 e0 | ||
| αp(0) = 2100 s−1 | αp(0) = 1570 s−1 | qαp = 0.17 e0 | ||
| αN(0) = 7000 s−1 | αN(0) ≥ 1900 s−1 | qαN = 0.18 e0 | ||
| — | αd(0) = αd(0)WT | qαd = 0.25 e0 | ||
| β1(0) = 190 s−1 | β1(0) = 200 s−1 | qβ1 = −0.53 e0 | ||
| βN(0) = 150 s−1 | βN(0) = 520 s−1 | qβN = −0.57 e0 | ||
| βN-1(0) = 320 s−1 | βN-1(0) ≥ 3800 s−1 | qβN−1 = −0.30 e0 | ||
| βd(0) = 540 s−1 | βd(0) = 540 s−1 | qβd = −0.24 e0 | ||
In some cases, the listed values for V2 differ slightly from the estimates that are given in the text (for α1(0), αp(0), β1(0), and βN(0)). To obtain the modified estimates, we refitted selected voltage-dependent current parameters, while constraining the partial charges to be equal to the values obtained for WT in the previous paper (listed on the right).
Table II.
Estimate of Rate Constants for Transitions to States Outside of the Activation Path
| Rate at 0 mV | ||||
|---|---|---|---|---|
| WT | V2 | Partial charge | ||
| c = 5 s−1 | c = 15 s−1 | qc = 0.09 e0 | ||
| d = 300 s−1 | d = 300 s−1 | qd = 0.07 e0 | ||
| e 1 = 200 s−1 | e 1 = 600 s−1 | qe 1 ≈ 0.0 e0 | ||
| f 1 = 1600 s−1 | f 1 = 1600s −1 | qf 1 = 0.20 e0 | ||
| e 2 ≈ 103 s−1 | e 2 ≈ 3000 s−1 | qe 2−qf 2 = 0.0 e0 | ||
| f 2 ≈ 104 s−1 | f 2 ≈ 104 s−1 | |||
As far as we can tell, all of the other transitions for WT and V2 have nearly identical rates. Similar estimates were obtained for α1, αp, β1, which all reflect rates of specific transitions that occur relatively early in the activation process. Similar estimates were also obtained for the parameters αd and βd that reflect the composite properties of all of the transitions that come between the first and last transitions. It is important to emphasize that we cannot rule out that V2 changes some of the rates that we cannot identify with our kinetic measurements. An important test of the hypothesis that V2's effects are limited to the final two transitions will be whether, in our modeling, we can account for the large family of data that we have obtained for V2 with changes in the model that are limited to the last two transitions (Schoppa and Sigworth, 1998b ).
V2 Does Not Cause a Fundamental Change in the Activation Gating Process
An underlying assumption in our comparison of activation gating in WT and V2 channels is that V2 undergoes the same conformational changes and kinetic steps as WT during its activation process. Several lines of evidence support this assumption. First, not only is the maximal charge movement equal in the two channel types (Schoppa et al., 1992; Fig. 1 B), but also the partial charges that determine the voltage dependence of the rate constants α1, β1, and βN have been shown in the present study to be very similar in WT and V2. Second, the similarity of the delay in the activation time course (Fig. 2 C) suggests that the same large number of voltage-dependent transitions is operable in both channel types. Third, it should be kept in mind that the shifts in activation voltage due to amino acid substitutions at L382 correspond to only small changes ΔΔG in the energy to open the channel, on the order of 1 kcal/mol per Shaker subunit. These moderate energy changes are consistent with a simple change in the environment of this residue during activation (Sigworth, 1994; Holmgren et al., 1996). Thus, the effect of the V2 mutation can be imagined as a small perturbation of one or a few energy barriers, rather than as a wholesale remodeling of the energy landscape of the channel protein. We find no reason to reject the assumption that V2 undergoes the same conformational changes as WT in the process of activation.
Novel Insights into the Activation Gating Process from V2's Data
Several new pieces of information about the activation gating process came from V2's data. The first is derived from the shape of V2's q-V relation. The separation of the q-V relation into two components (Fig. 1, B and C) suggests that the charge movement q H associated with a subset of late gating transitions is 2 e0 in magnitude. From our kinetic analysis of WT in the preceding paper, it is already known that the final transition has a valence of only 0.75 e0 (the sum of q αN = 0.18 e0 and q βN = −0.57 e0); thus there must be more than one transition making up this charge movement of 2 e0. This consideration will be used in constraining the properties of the final transitions in the following paper.
We also obtained information about intermediate transitions from a set of measurements of V2's off gating currents after prepulses that were chosen to optimize the characterization of the intermediate transitions. This experiment was more easily done in V2 than in WT because the mutation causes channel opening to occur at much more positive voltages compared with the midpoint of the intermediate transitions. The observed off currents (Fig. 8) have two notable properties. The first is that the off currents decay with a voltage dependence given by the charge q βd ∼−0.5 e0. This charge estimate roughly verifies the estimate for q βd (q βd = −0.24 e0) obtained from the analysis of the delay in the channel reactivation time course (Schoppa and Sigworth, 1998a ). Both of these estimates are substantially smaller than the estimates for intermediate reverse rates that have been proposed in other models (Zagotta et al., 1994 b).
V2's off current time courses measured at −63 mV after an intermediate amplitude prepulse displayed a fast decaying component superimposed on a slow component, indicating that at least some of the intermediate transitions have rapid backward rates. Because the evidence we have provided suggests strongly that V2's effects are limited to the final transitions, we believe that it is reasonable to assume that the backward rates of WT's intermediate transitions are rapid, as they are for V2.
Scheme II.
Scheme III.
Abbreviation used in this paper
- WT
wild type
Footnotes
Dr. Schoppa's present address is Vollum Institute, Oregon Health Sciences University L-474, Portland, OR 97201-3098.
references
- Auld VJ, Goldin AL, Krafte DS, Catterall W, Lester HA, Davidson N, Dunn R. A neutral amino acid change in segment IIS4 dramatically alters the gating properties of the voltage-dependent sodium channel. Proc Natl Acad Sci USA. 1990;87:323–327. doi: 10.1073/pnas.87.1.323. [DOI] [PMC free article] [PubMed] [Google Scholar]
- Ayer RK, Sigworth FJ. Enhanced closed-state inactivation in a mutant Shaker K+channel. J Membr Biol. 1997;157:215–230. doi: 10.1007/s002329900230. [DOI] [PubMed] [Google Scholar]
- Bezanilla F, Perozo E, Stefani E. Gating of Shaker K+channels: II. The components of gating currents and a model of channel activation. Biophys J. 1994;66:1011–1021. doi: 10.1016/S0006-3495(94)80882-3. [DOI] [PMC free article] [PubMed] [Google Scholar]
- Cole KS, Moore JW. Potassium ion current in the squid giant axon: dynamic characteristic. Biophys J. 1960;1:1–14. doi: 10.1016/s0006-3495(60)86871-3. [DOI] [PMC free article] [PubMed] [Google Scholar]
- Holmgren M, Jurman ME, Yellen G. N-type inactivation and the S4-S5 region of the Shaker K+channel. J Gen Physiol. 1996;108:195–206. doi: 10.1085/jgp.108.3.195. [DOI] [PMC free article] [PubMed] [Google Scholar]
- Hoshi T, Zagotta WN, Aldrich RW. Biophysical and molecular mechanisms of Shakerpotassium channel inactivation. Science. 1990;250:533–538. doi: 10.1126/science.2122519. [DOI] [PubMed] [Google Scholar]
- Hoshi T, Zagotta WN, Aldrich RW. Shakerpotassium channel gating. I: Transitions near the open state. J Gen Physiol. 1994;103:249–278. doi: 10.1085/jgp.103.2.249. [DOI] [PMC free article] [PubMed] [Google Scholar]
- Kavanaugh MP, Hurst RS, Yakel J, Varnum MD, Adelman JP, North RA. Multiple subunits of a voltage-dependent potassium channel contribute to the binding site for tetraethylammonium. Neuron. 1992;8:493–497. doi: 10.1016/0896-6273(92)90277-k. [DOI] [PubMed] [Google Scholar]
- Li M, Unwin N, Stauffer KA, Jan YN, Jan LY. Images of purified Shakerpotassium channels. Curr Biol. 1994;4:110–115. doi: 10.1016/s0960-9822(94)00026-6. [DOI] [PubMed] [Google Scholar]
- Lopez GA, Jan YN, Jan LY. Hydrophobic substitution mutations in the S4 sequence alter voltage-dependent gating in Shaker K+channels. Neuron. 1991;7:327–336. doi: 10.1016/0896-6273(91)90271-z. [DOI] [PubMed] [Google Scholar]
- MacKinnon R. Determination of the subunit stoichiometry of a voltage-activated potassium channel. Nature. 1991;350:232–235. doi: 10.1038/350232a0. [DOI] [PubMed] [Google Scholar]
- McCormack K, Campanelli JT, Ramaswami M, Mathew MK, Tanouye MA, Iverson LE, Rudy B. Leucine-zipper motif update. Nature. 1989;340:103. [Google Scholar]
- McCormack K, Lin L, Sigworth FJ. Substitution of a hydrophobic residue alters the conformational stability of Shaker K+channels during gating and assembly. Biophys J. 1993;65:1740–1748. doi: 10.1016/S0006-3495(93)81202-5. [DOI] [PMC free article] [PubMed] [Google Scholar]
- McCormack K, Tanouye MA, Iverson LE, Lin JW, Ramaswami M, McCormack T, Campanelli JT, Mathew MK, Rudy B. A role for hydrophobic residues in the voltage-dependent gating of Shaker K+channels. Proc Natl Acad Sci USA. 1991;88:2931–2935. doi: 10.1073/pnas.88.7.2931. [DOI] [PMC free article] [PubMed] [Google Scholar]
- Schoppa NE, McCormack K, Tanuoye MA, Sigworth FJ. The size of gating charge in wild-type and mutant Shakerpotassium channels. Science. 1992;255:1712–1715. doi: 10.1126/science.1553560. [DOI] [PubMed] [Google Scholar]
- Schoppa NE, Sigworth FJ. Activation of Shakerpotassium channels. I. Characterization of voltage-dependent transitions. J Gen Physiol. 1998a;111:271–294. doi: 10.1085/jgp.111.2.271. [DOI] [PMC free article] [PubMed] [Google Scholar]
- Schoppa NE, Sigworth FJ. Activation of Shakerpotassium channels. III. An activation gating model for wild-type and V2 mutant channels. J Gen Physiol. 1998b;111:313–342. doi: 10.1085/jgp.111.2.313. [DOI] [PMC free article] [PubMed] [Google Scholar]
- Sigworth FJ. Voltage gating of ion channels. Q Rev Biophys. 1994;27:1–40. doi: 10.1017/s0033583500002894. [DOI] [PubMed] [Google Scholar]
- Stühmer W, Conti F, Stocker M, Pongs O, Heinemann SH. Gating currents of inactivating and non-inactivating potassium channels expressed in Xenopusoocytes. Pflügers Archiv Eur J Physiol. 1991;418:423–429. doi: 10.1007/BF00550881. [DOI] [PubMed] [Google Scholar]
- Zagotta WN, Hoshi T, Aldrich RW. b. Shakerpotassium channel gating. III. Evaluation of kinetic models for activation. J Gen Physiol. 1994;103:321–362. doi: 10.1085/jgp.103.2.321. [DOI] [PMC free article] [PubMed] [Google Scholar]
- Zagotta WN, Hoshi T, Dittman J, Aldrich RW. a. Shakerpotassium channel gating. II. Transitions in the activation pathway. J Gen Physiol. 1994;103:279–319. doi: 10.1085/jgp.103.2.279. [DOI] [PMC free article] [PubMed] [Google Scholar]


