Abstract
A functional kinetic model is developed to describe the activation gating process of the Shaker potassium channel. The modeling in this paper is constrained by measurements described in the preceding two papers, including macroscopic ionic and gating currents and single channel ionic currents. These data were obtained from the normally activating wild-type channel as well as a mutant channel V2, in which the leucine at position 382 has been mutated to a valine. Different classes of models that incorporate Shaker's symmetrical tetrameric structure are systematically examined. Many simple gating models are clearly inadequate, but a model that can account for all of the qualitative features of the data has the channel open after its four subunits undergo three transitions in sequence, and two final transitions that reflect the concerted action of the four subunits. In this model, which we call Scheme 3+2′, the channel can also close to several states that are not part of the activation path. Channel opening involves a large total charge movement (10.8 e0), which is distributed among a large number of small steps each with rather small charge movements (between 0.6 and 1.05 e0). The final two transitions are different from earlier steps by having slow backward rates. These steps confer a cooperative mechanism of channel opening at Shaker's activation voltages. In the context of Scheme 3+2′, significant effects of the V2 mutation are limited to the backward rates of the final two transitions, implying that L382 plays an important role in the conformational stability of the final two states.
Keywords: ion channel, gating current, single-channel current, patch clamp, kinetic model
introduction
Several functional kinetic models have been proposed that describe the activation gating process of Shaker potassium channels (Schoppa et al., 1992; Tytgat and Hess, 1992; Bezanilla et al., 1994; McCormack et al., 1994; Zagotta et al., 1994 b). However, these models are fundamentally quite diverse. One of the reasons for the differences is that no single group has attempted to model all of the available data that reflect the activation gating process for Shaker channels; instead, different groups have modeled different subsets of the data. Another reason is that the activation process is likely to involve a very large number of gating transitions (Zagotta et al., 1994 a), and data have not been available to constrain all of the transitions of appropriately complicated models.
This paper is the last in a series of three papers in which we describe our efforts to produce a well-constrained functional gating model for the Shaker potassium channel. The specific channel that we have studied is the Shaker 29-4 channel (Iverson and Rudy, 1990), which has been truncated at the NH2 terminus to remove rapid inactivation, and which has been expressed in Xenopus laevis oocytes. Our strategy in the first two papers (Schoppa and Sigworth, 1998a , 1998b ) has been to characterize in detail the electrophysiological properties of the Shaker channel, using a combination of measurements of macroscopic ionic and gating currents and single channel currents. We have obtained data from not only the normally activating (wild type, WT)1 channel, but also from a mutant channel (V2) having a leucine to valine mutation at position L370 in the Shaker 29-4 sequence, corresponding to L382 in the better-known ShB sequence. Data from these channels, taken together, have yielded starting estimates of rate constants for several gating transitions.
Our strategy for the modeling here will be first to explore systematically several classes of gating models. All of these models invoke the tetrameric structure of Shaker channels (MacKinnon, 1991; Kavanaugh et al., 1992; Li et al., 1994), by having many of their transitions correspond to Shaker's four subunits moving one subunit at a time, and with the subunits acting equivalently. We will show that different lines of data rule out the most simple models, leading us to our first hypothesis for a gating model, which we call Scheme 2+2′. This model has the channel open after each of Shaker's four subunits undergo two transitions in sequence, followed by two additional concerted conformational changes. Next, we compare detailed predictions of Scheme 2+2′ with data, and find that it is an inadequate model. Finally, we propose a more complicated gating model, called Scheme 3+2′, as an example of one model that can account for all of the qualitative features of the data. In this model, the Shaker channel opens after each of its four subunits undergoes three transitions in sequence, followed by two concerted transitions.
methods
Calculations for the Modeling
For the modeling of Shaker's activation gating, we assume continuous-time, discrete-state Markov models, which have performed adequately at describing the gating processes of many other ion channels (for example, see McManus and Magleby, 1988). For all of the calculations, the numerical techniques described by Colquhoun and Hawkes (1995) were used. For a gating scheme with n states, we constructed an n by n matrix K(0) of rate constants at 0 mV and a matrix Q of partial charges q ij that reflect the voltage dependence of the forward and backward rates of each transition between states i and j. For a given voltage V a matrix K(V ) was constructed with off-diagonal elements k ij(V ) calculated from the corresponding elements in K(0) and Q:
 |
1 |
and the diagonals were subsequently computed to cause the rows to sum to zero. The equilibrium and time-dependent state occupancies were derived from the eigenvalues and the eigenvectors of the K(V) matrix, which were found using standard routines (Eispack). Computations were performed within the PowerMod Modula-2 programming environment (Heka Electronic, Lambrecht, Germany) on a Macintosh Centris 650 computer. Please note that the matrix Q is not to be confused with Q, the relative charge movement measured in gating current experiments.
For the fitting of the macroscopic ionic and gating current time courses, typically two sets of calculations were performed: one to obtain the equilibrium state occupancies at the prepulse voltage, and a second to determine the time-dependent changes in occupancies during the test pulse. The simulations in Fig. 7, A and C, were done slightly differently, assuming that all of the channels reside in the first closed state at the beginning of the test pulse. This is a reasonable assumption since little charge has moved in the Q-V relation at the −93-mV prepulse voltage used in these experiments.
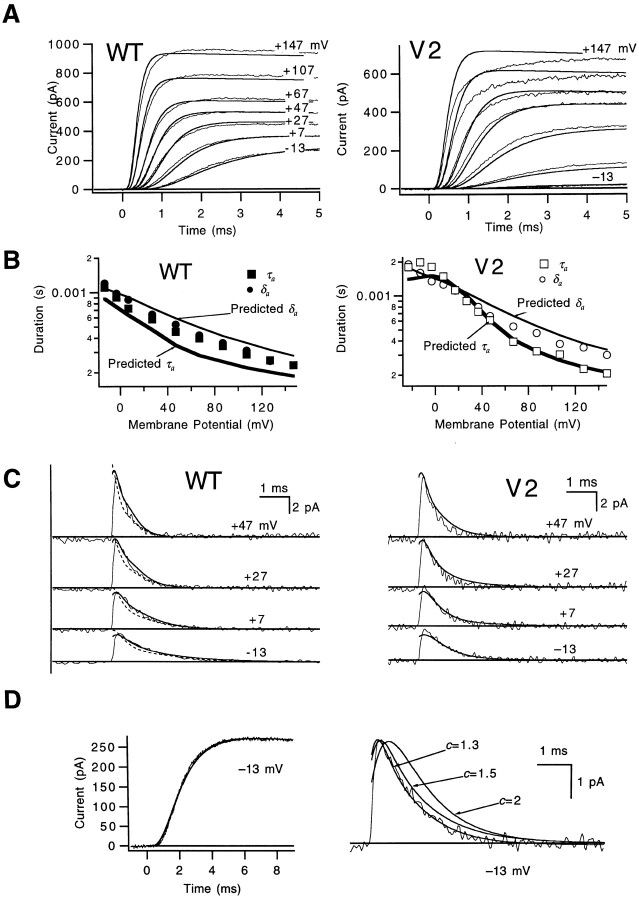
Figure 7.
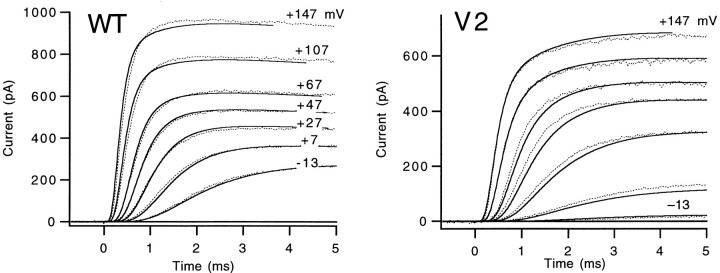
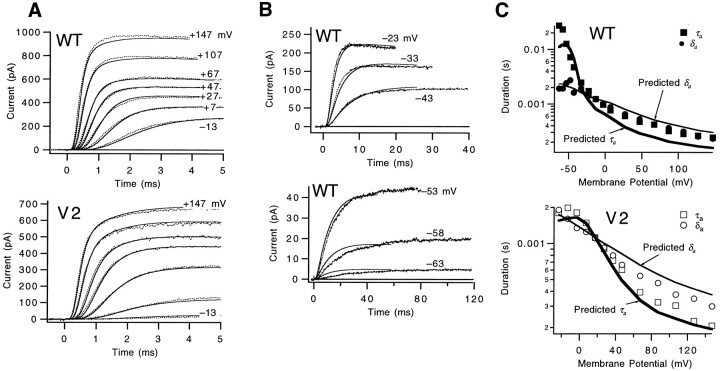
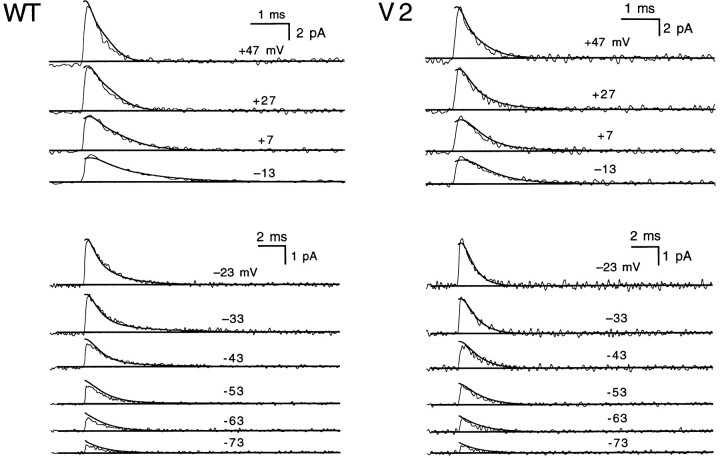
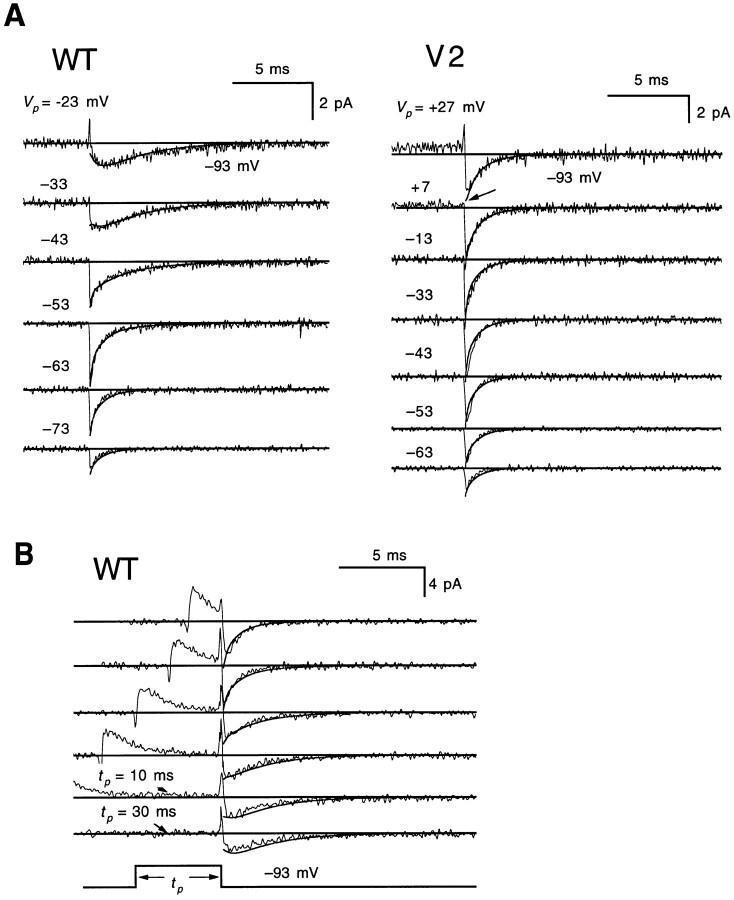
Fits of Scheme 2+2′ to WT and V2's ionic and gating current time courses at depolarized test voltages up to +147 mV. (A) A comparison of the measured and simulated ionic current time courses indicate that Scheme 2+2′ accounts for the channel opening kinetics quite well; the deviation at very large test depolarizations (especially prominent for V2) reflect the contribution of channel openings through a slow alternate activation path (Ci states; Schoppa and Sigworth, 1998a ) that is not included in the model. The holding potential was −93 mV. Data are from patches w312 and v096. (B) The measured/simulated currents in A were fitted to yield values for the activation time constant τa (squares, bold lines) and delay δa (circles, regular lines) using the strategy of Schoppa and Sigworth (1998a). At V ≥ +67 mV, the measured τa values reflect the fast time constant obtained in fits of the currents to the sum of two exponentials. (C) Fits of WT's and V2's gating currents at voltages between −13 and +47 mV (solid curves). The requirement for cooperative interaction (c > 1) for S0 ↔ S1 is illustrated by the discrepancy in the fits of WT's on gating currents to Scheme 2+2′ for no interaction (c = 1; dashed curves). Data are from patches w212 and v219. The holding potential was −93 mV in these recordings. (D) WT's gating current time course was used to place an upper limit on the degree of cooperative interaction assigned to S0 ↔ S1. For interactions corresponding to values of c = 1.5 and 2.0, values for a 1(0) were first adjusted to best account for WT's ionic current time courses at −13 mV (left). The resulting predictions for the gating currents at −13 mV on the right indicate that c ≥ 1.5 yields a predicted current with a peak that is too broad. To facilitate comparison, the simulated currents for c = 1.5 and 2.0 were scaled to peak at the same value as the current predicted by c = 1.3.
For ionic current relaxations, the occupancy of the open state was multiplied by the single channel current amplitude i, and the number of channels n that we estimated to contribute to the macroscopic current. Estimates of i for the current measurements made in the absence of the external potassium were obtained directly from the amplitudes of WT and V2 single-channel currents measured under the same ionic conditions. For the simulations of tail currents that were measured with 14 mM K+ in the pipette (see Fig. 3), no estimate of i was available, but the simulated curves were scaled to peak at the same value as the measured tail currents. The value for n was typically fixed to that which best fitted the family of current traces from a given patch, and was kept constant for all of the traces. However, in experiments in which currents were measured over ≥20 min of recording time (e.g., in the reactivation measurements in Fig. 10), small variations (<10%) in n were introduced into the fitting to account for the gradual run down of current.
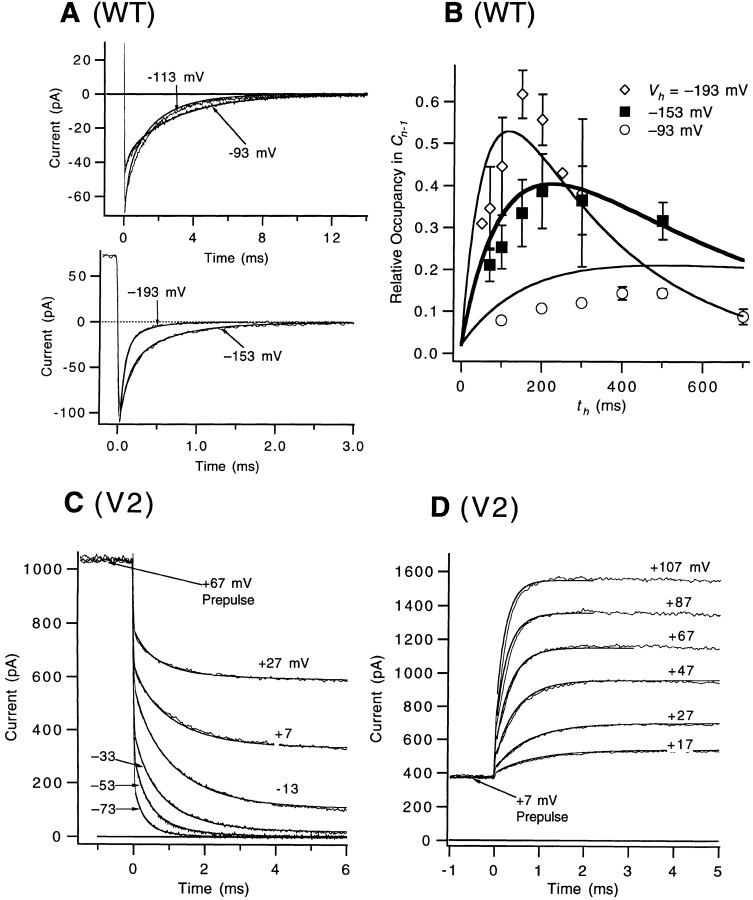
Figure 3.
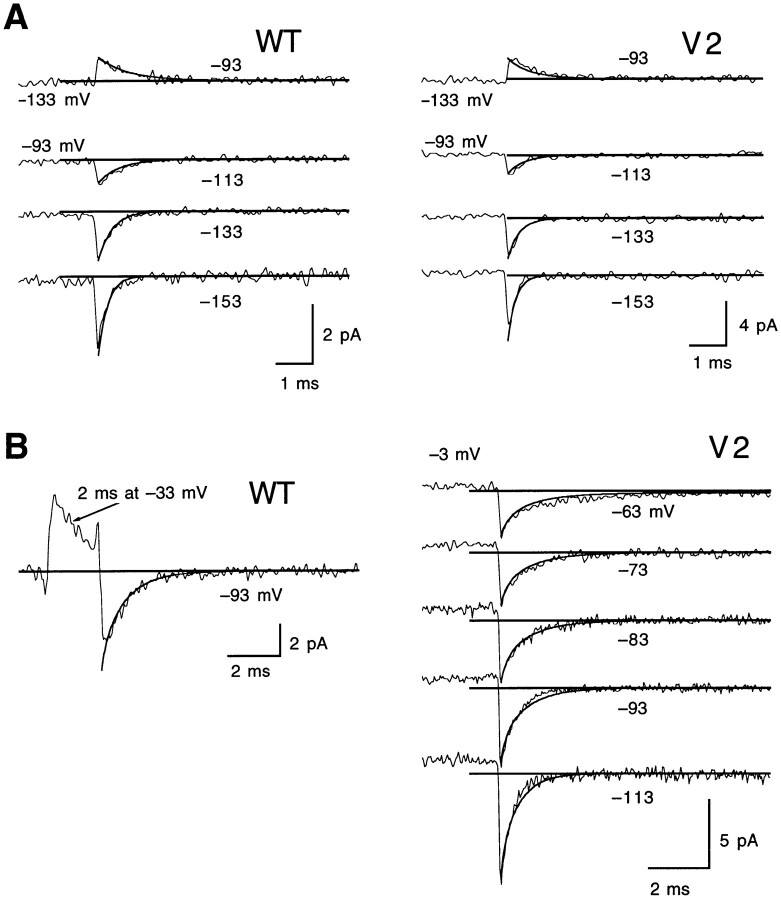
Fits of Scheme 0+2′ to selected WT and V2 macroscopic ionic current time courses that reflect the final transitions. For WT, these include (A) tail currents at voltages between −93 and −193 mV (patch w448), and (B) time-dependent occupancies in the last closed state in the activation path CN-1, derived from reactivation time courses. Occupancies in CN-1 are indicated for hyperpolarizations to voltages V h = −93, −153, and −193 mV as a function of the hyperpolarization duration t h. Occupancy estimates were derived from the amplitude of the fast reactivation component, as described in a previous paper (Schoppa and Sigworth, 1998a ), and reflect averages from one to four experiments. In the simulations of these data, we set αN-1 = 0 during the test pulse, or, effectively, βN-2 >> αN-1 at V ≤ −93 mV. Scheme 0+2′ also accounts for (C) V2's macroscopic ionic tail currents at voltages between −73 and +27 mV, and (D) V2's channel opening time courses after a prepulse to +7 mV. In D, the prepulse loads most channels into the last closed states, so that the test currents mostly reflect the kinetics of the final two transitions. All V2 data are from the same patch (v329).
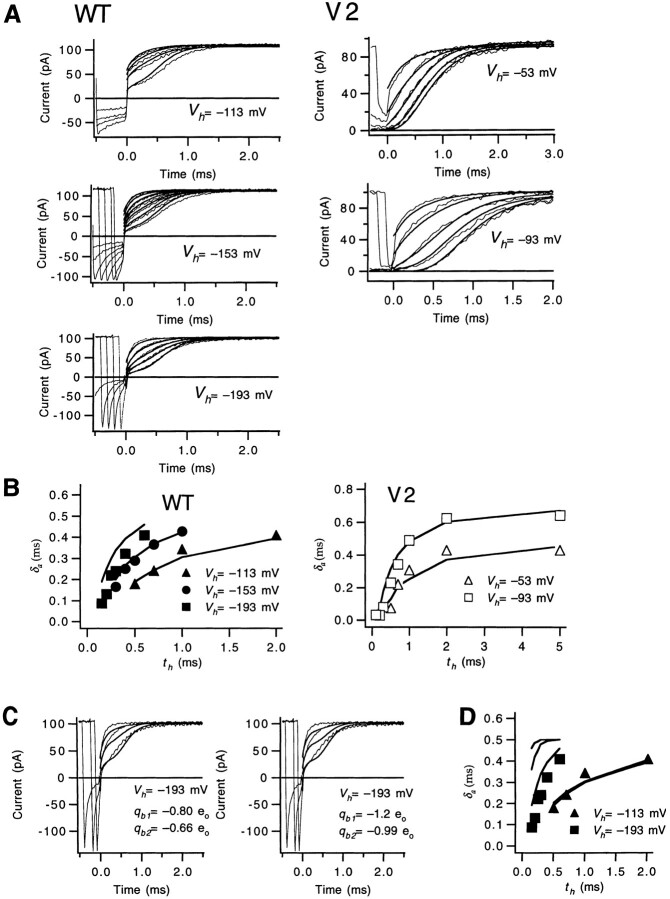
Figure 10.
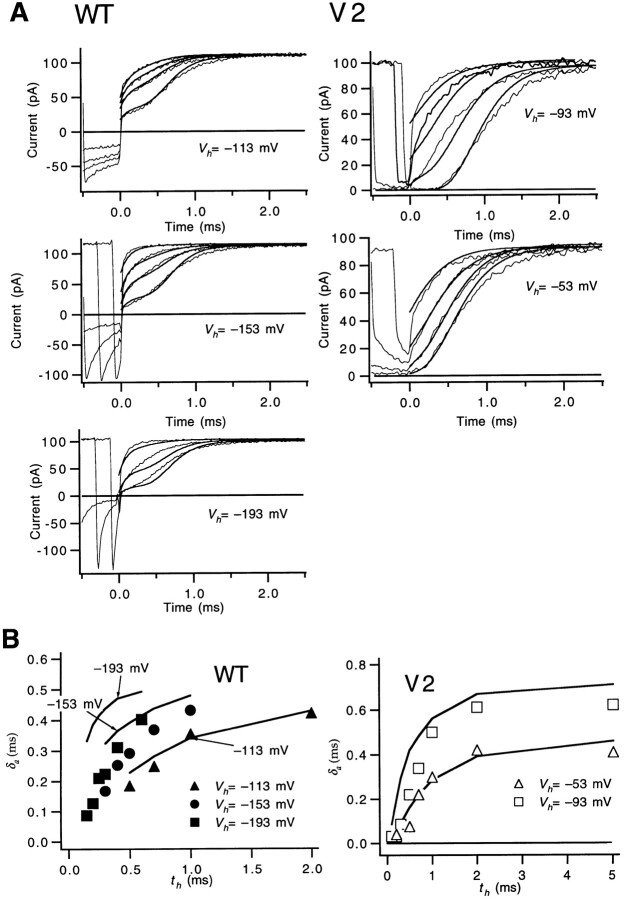
Fits of Scheme 2+2′ to WT and V2 reactivation kinetics. (A) Scheme 2+2′ accounts for WT and V2's reactivation time courses after hyperpolarizations of various amplitudes V h (between −53 and −193 mV) and duration t h. Test voltages were +37 and +67 mV for WT and V2, respectively. All of the displayed data come from the same WT and V2 patch recordings and correspond to the following t h values. WT: for V h = −113 mV, t h = 0.5, 0.7, 1, and 2 ms; for V h = −153 mV, t h = 0.1, 0.2, 0.3, 0.4, 0.5, 0.7, and 1 ms; for V h = −193 mV, t h = 0.1, 0.2, 0.3, 0.4, and 0.6 ms. V2: for V h = −53 mV, t h = 0.2, 0.5, 1, 2, and 5 ms; for V h = −53 mV, t h = 0.1, 0.2, 0.5, 1, and 5 ms. In the simulations, for WT, a 1 and a 2 were each increased by 20% compared with the values in Table II, and the values for βN-1(0) and βN(0) were 520 and 280 s−1. For V2, βN was changed to 1,100 s−1. Data are from patches w448 and v162. (B) Scheme 2+2′ accounts for the delay δa in WT and V2's reactivation time course for different V h and t h. The δa values were derived from the measured and simulated currents from A. (C and D) WT's reactivation time courses were used to place constraints on the sizes of q b1 and q b2. For reactivation time courses measured after V h = −193 mV, values for q b1 and q b2 that are two or three times as large as the values in Table II predict a reactivation delay that is too long. In D, the three superimposed lines to the left of the squares reflect δa values derived from simulated currents for the q b1 and q b2 values in Table II (the best fit) or q b1 and q b2 values that are two or three times larger. For these simulations, the values of b 1(0) and b 2(0) were first adjusted to achieve good fits of WT's reactivation time course for V h = −113 mV (shown by the derived δa values in D).
The slow inactivation process in Shaker channels has one rapid component (with τ ≅ 70 ms; Schoppa and Sigworth, 1998a ) with kinetics that are comparable to activation gating at some voltages. Thus, in the simulations, the current time courses predicted by the activation model were multiplied by a decaying single exponential reflecting this component. It was implicit in this approach that slow inactivation occurs during the test pulse independently of activation. Parameter estimates for this transition were taken from the measured time constant and amplitude of the fast component of slow inactivation, obtained by fitting a sum of two exponentials to ionic currents measured during 4–8-s voltage pulses.
For the fitting of the gating-current time courses, the amplitudes derived from the eigenvectors of K(V ) and the charge movements were scaled by the number of channels. At the 5-kHz filtering bandwidth at which the gating currents were usually recorded, we expected that any charge component decaying faster than ∼100 μs was likely to be distorted, given that the measured step response of the recording system required a few sample intervals to settle (Schoppa and Sigworth, 1998a ). In the simulations, this was accounted for by constraining the rates of the exponential relaxations: in each component with a time constant shorter than 100 μs, the time constant was fixed to 100 μs, and the amplitude of the component was appropriately adjusted to maintain the correct amount of charge.
The probability density functions fitted to the single-channel open and closed dwell time histograms were calculated using the methods that have been described previously (Colquhoun and Hawkes, 1981). For the calculations of the open times, a correction was performed for missed closed events, using described methods (Crouzy and Sigworth, 1990).
For the simple characterization of activation time courses, we sometimes fitted a single exponential function to simulated time courses in the same manner as was done for the experimental data (Schoppa and Sigworth, 1998a ). Briefly, an exponential function was fitted to the time course, starting at the time at which the relaxation reached 50% of its final value. The resulting time constant τa and delay δa parameters have simple interpretations in the case that all transitions have negligible reverse rates.
Using Data Obtained from Different Patch Recordings
It has been reported that Shaker channels exhibit variabilities in gating between different patches (Zagotta et al., 1994 b). Indeed, in our records, WT and V2 channels displayed patch-to-patch variabilities in several gating properties, including the voltage dependences and kinetics of channel opening (Fig. 1, A and B). For both channels, the variabilities in equilibrium P o and in the kinetics of channel opening (as reflected in the activation time constant τa) corresponded to a 5–10-mV voltage shift (Fig. 1 C). The extent of the variabilities was larger than would be expected from drift in the pipette voltage offset. This offset was corrected at the beginning of each recording; it was found to change by no more than 2–3 mV by the end of the experiment, when the offset was reevaluated. One possible source of the variability in the macroscopic currents of V2 is its modal single channel behavior (Schoppa and Sigworth, 1998b ). The macroscopic current time course could reflect the modal behavior if factors exist (e.g., second messengers) that shift the properties of the entire population of channels that contribute to the macroscopic current.
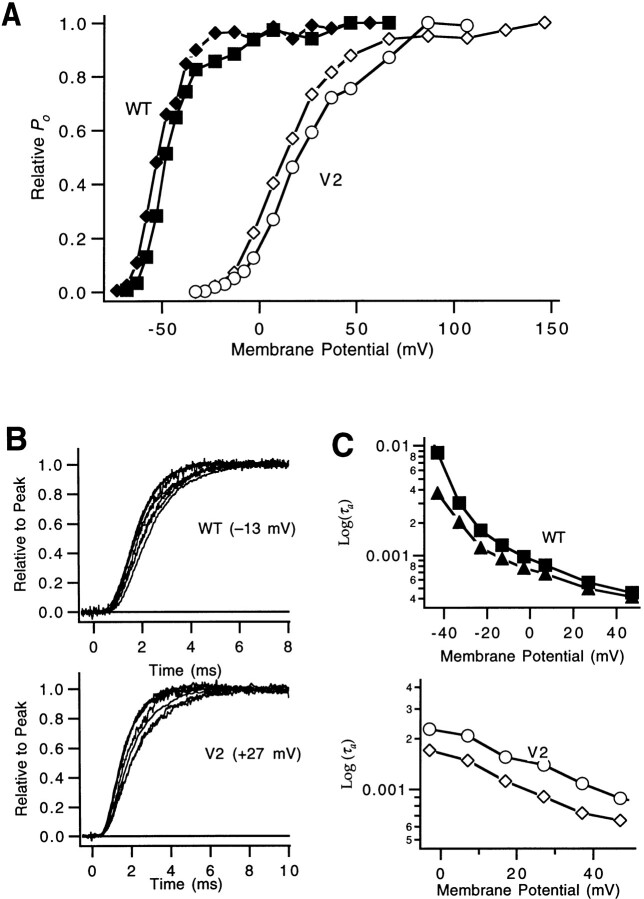
Figure 1.
Patch-to-patch variabilities are apparent in WT and V2 voltage dependence of P o (A) and ionic current time courses (B). The P o -V plots were taken from two different patches each for WT and V2, and time courses were taken from seven different patches. The test voltages for the currents in B were −13 and +27 mV for WT and V2, respectively. (C) A comparison of the τa values at different test voltages from two WT and V2 patches shows that the variability in the current kinetics is well accounted for by a simple voltage shift.
Since it was impossible to obtain all of the types of data from a single patch recording, the patch-to-patch variabilities implied that no single set of parameters could account for all of the data simultaneously. To account for the variabilities, we allowed the rate values (at 0 mV) to differ by as much as 20% between patches, but the charge values were the same for all the simulations. This magnitude of variation accounts for the ∼10-mV voltage shifts in P o and τa shown in Fig. 1. We considered this a satisfactory approach since our interest in the modeling was to discriminate between different fundamental mechanisms of channel gating rather than to determine rate constants to high precision. Most gating mechanisms could be quite easily ruled out by simple qualitative criteria or if they produced extremely poor fits of the data (e.g., the fits of Scheme 2+2′ to the equilibrium data in Fig. 11); allowing small variations in rate constants between patches did not obscure our ability to differentiate models. In fact, the number of instances that the rates differed from the values given in the appropriate tables is quite small. These are explicitly noted in the legends of Figs. 5, 10, 16, and 18.
Figure 11.
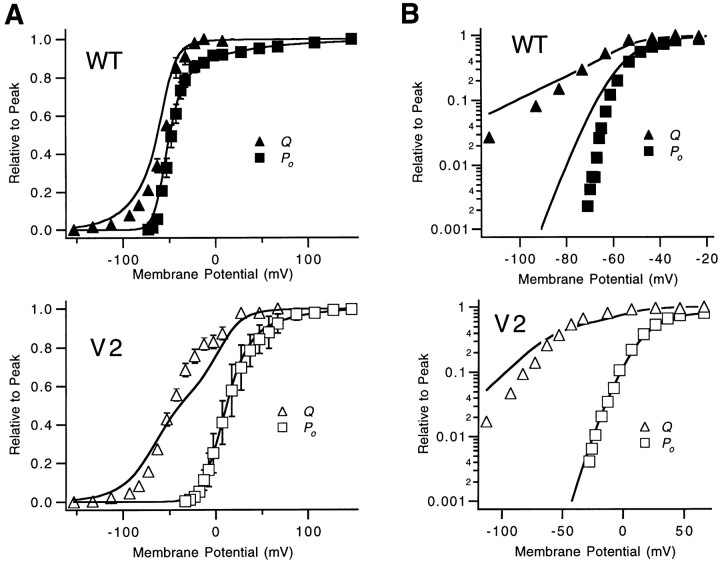
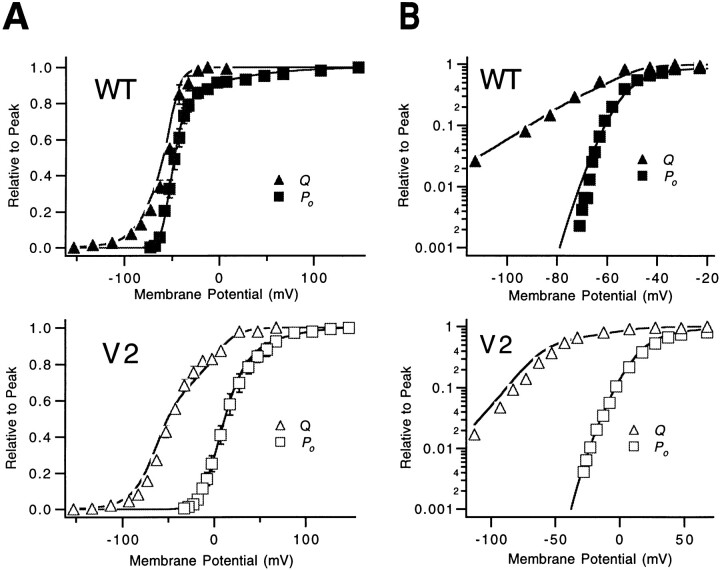
Scheme 2+2′ accounts for some but not all of the features of WT's and V2's equilibrium voltage dependence of channel opening and charge movement. WT and V2 plots are shown with ordinates that are either linear (A) or log transformed (B). The discrepancies in the fits are the largest for V2's linearly plotted Q-V relation and for WT's log-transformed values of P o. The model also slightly underestimates the steepness of the Q-V relation at the most hyperpolarized voltages (seen in B). For the linear plot, the values reflect mean ± SEM from one to eight experiments. The log-transformed data reflect single patch experiments (WT patches w158 and w249; V2 patches v206 and v240).
Figure 5.
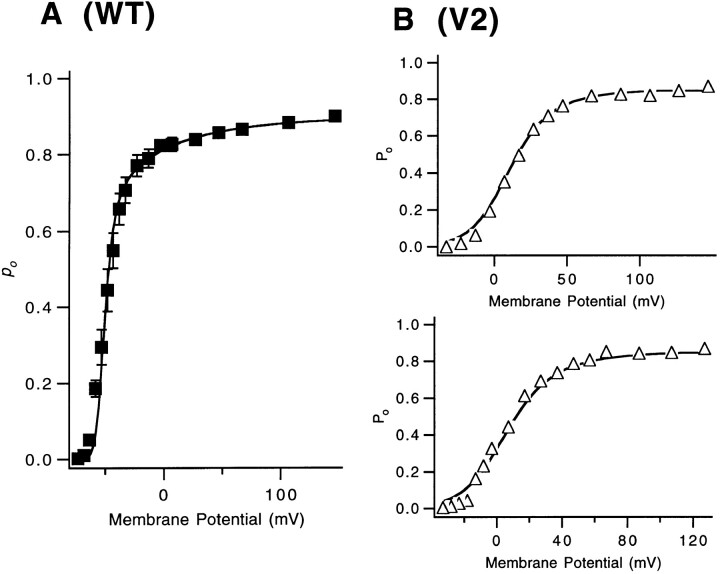
Fits of Scheme 0+2′ to the equilibrium P
o at depolarized voltages for WT (A) and V2 (B). For V2, we have fitted P
o
-V relations obtained from current measurements made in two patches (v096 and v142). For WT, we have fitted the mean P
o
-V relation, since its complete P
o
-V relation was constructed using observations that were made in more than one patch (Schoppa and Sigworth, 1998a
). In fitting WT's P
o
-V relation, we are here only interested in the shape of the P
o
-V relation at depolarized voltages, but needed to add several early transitions to Scheme 0+2′ to approximate P
o at lower voltages. The model used was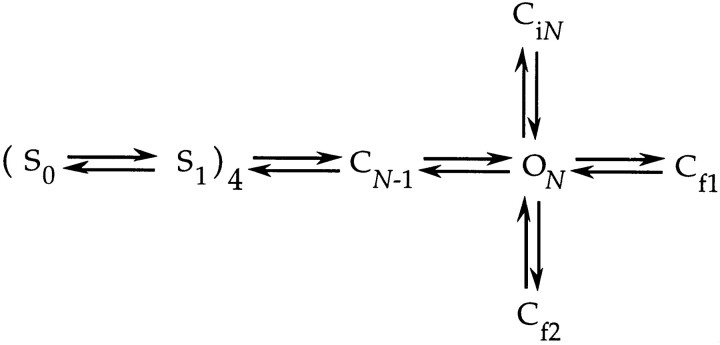 in which we have added one set of four subunit transitions to Scheme 0+2′. For the modified model, the charge associated with S0 ↔ S1 was set at 2.55 e0 and its midpoint voltage was −53 mV. The simulations for V2 reflect Scheme 0+2′, but the values for βN-1(0) varied slightly from those in Table I; for the two patches, βN-1(0) was 17,000 and 14,000 s−1.
Figure 16.
Scheme 3+2′ accounts for some but not all of WT's and V2's reactivation time courses. (A) Selected WT and V2 reactivation time courses from Fig. 10 were fitted to Scheme 3+2′. Scheme 3+2′ accounts for the reactivation time courses for the less negative V h reasonably well, but fails to account for the reactivation time courses for the most negative V h. In these simulations, for WT, the values of a 1, a 2, and a 3 were each increased by 20% compared with the values in Table III, and the values for βN-1(0) and βN(0) were 520 s−1 and βN = 280 s−1. For V2, βN was changed to 1,100 s−1. (B) The same deviations in the fits are shown in a comparison of the δa values that were derived from the measured and simulated currents in A. These discrepancies reflect the 20% increases in q b1, q b2, and q b3, used to help achieve a sufficiently large total gating charge.
Figure 18.
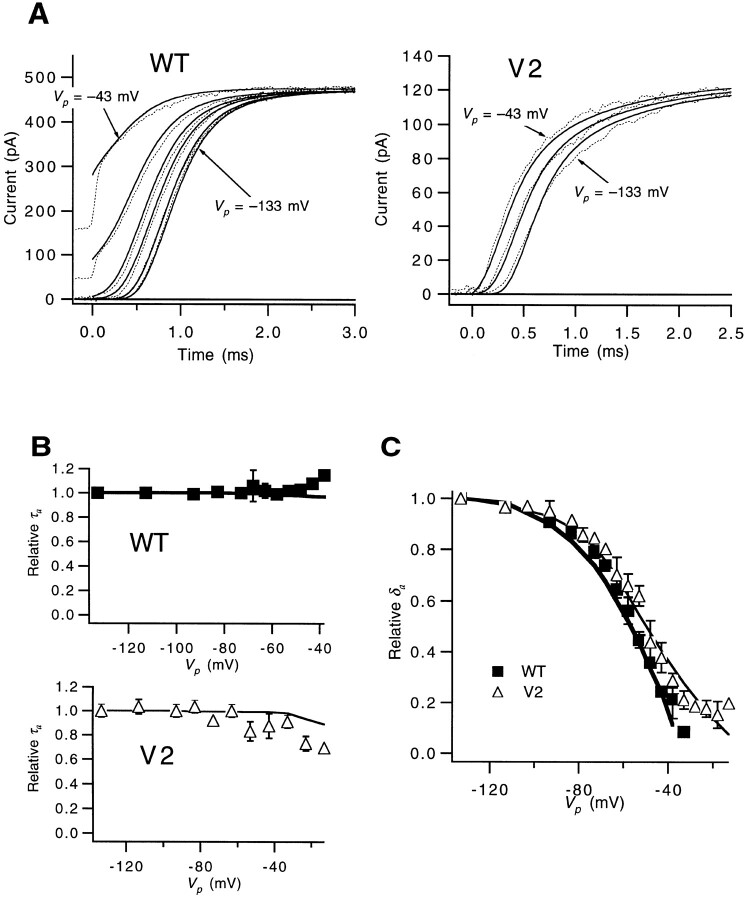
Fits of Scheme 3+2′ to WT's and V2's ionic current measured after prepulses of different amplitude V p. The test voltages used were +37 mV for WT and +107 mV for V2. (A) Scheme 3+2′ accounts well for the current time courses measured for wide range of V p values. These simulations were made while incorporating changes to Scheme 3+2′ identical to those described for Scheme 2+2′ in Fig. 8; that is, we include the transition from the last closed state to the state CiN-1 (and also the transition CiN-1 ↔ CiN). The rates for these additional transitions are those given in the legend to Fig. 8, except that rate of CN-1 → CiN-1 for V2 (at +147 mV) was increased from 6,700 to 8,600 s−1, to account for the relatively large amplitude of the slow activation component observed in this patch recording. Also, for WT, a 1, a 2, and a 3, were each increased by 4% compared with the values in Table III; for V2, each were increased by 10%. Data are from patches w139 and v148. (B and C) The good fits of the ionic currents are also reflected in a comparison of the normalized τa and δa parameters (symbols, lines) derived from the measured/simulated currents for different V p. WT's and V2's experimental τa and δa values reflect the mean ± SEM from one to four experiments. The τa values derived from V2's measured/simulated currents reflect the fast time constant in fits of these currents to the sum of two exponentials.
Finding Optimal Parameter Estimates
For previously described gating models, parameter estimates have typically been found by using a search algorithm that minimizes the error between the fitted curves and the data. In our initial modeling attempts, we employed the simplex search algorithm (Nelder and Mead, 1965; Press et al., 1992) to optimize fits, but obtained disappointing results. One problem was a bias in the fitting toward current traces that were larger in magnitude, since these yielded the largest error values. A simple weighting scheme improved things somewhat, but did not solve the problem that fits to individual traces often accounted well for certain features of the time course but not for others. For example, good fits of the rising phase and the final value of an ionic time course would be obtained (since these features account for most of the data points), but the delay would be poorly represented. The delay, however, was often the more important feature of the current for constraining models, since it reflects many more rates than the rest of the current.
Some attempts were made at using an appropriate error weighting function to avoid these problems. In our experience, however, determining the appropriate function was very tedious, and it was more expedient to perform the fitting by simply setting parameters manually and determining the goodness of fit by visual inspection. Our success in deriving a set of parameters with nonautomated methods can be attributed to the availability of good initial estimates for each of the rate constants.
The complexities surrounding the weighting of the errors in the fits, as well as the presence of variabilities between different patch experiments, made it difficult to provide meaningful confidence limits for the different parameter estimates that we give. However, we emphasize that each of the parameter estimates in our model is highly constrained. As we will describe below, we are generally able to identify particular current measurements that isolate each transition, and thus tightly constrain each of the parameters in the model. A good example of how making modest changes in the parameters affects the fits is illustrated in Fig. 10, C and D.
results
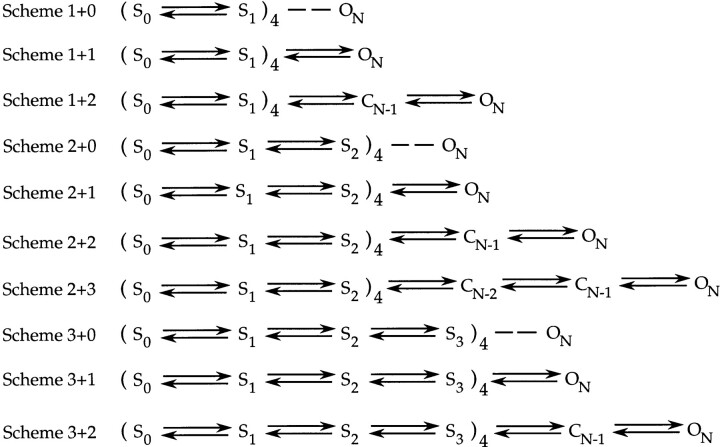
Several tenable classes of activation gating models are illustrated in Fig. 2. Since Shaker channels have a symmetrical structure composed of four identical subunits (MacKinnon et al., 1991; Kavanaugh et al., 1992; Li et al., 1994), a credible hypothesis for a gating model is one in which many of the transitions correspond to Shaker's four subunits moving one subunit at a time, and with the subunits acting equivalently. The symmetry can also be exploited in the modeling, since it reduces the number of different parameters that have to be constrained. Having many transitions correspond to the equivalent movement of single subunits has been a feature of many of the published gating models for Shaker (Schoppa et al., 1992; McCormack et al., 1994; Zagotta et al., 1994 b), and, for largely philosophical reasons, we also favor this formulation (see also below). Thus, in each of the models in Fig. 2, the channel opens after each of the four subunits undergoes at least one transition between different states that reflect the conformation of each of the individual subunits. These subunit states are designated S0, S1, S2, and S3, and we will refer to transitions among these states as “subunit transitions.” Some of the models in Fig. 2 have one or two additional transitions that follow the subunit transitions. These presumably reflect the concerted action of the four subunits. The naming of each of the models follows the assigned number of subunit transitions and the number of subsequent concerted transitions. For example, in Scheme 1+2, the channels open after one set of four subunit transitions and two concerted transitions.
Figure 2.
Classes of gating models for Shaker potassium channels. For each model, each of four subunits undergoes one, two, or three transitions between subunit states, designated by S0, S1, etc. In some of the models, the channel undergoes one, two, or three additional concerted transitions. The models are named by the number of subunit transitions and additional concerted transitions. For models with no concerted transitions, the channel is taken to be open after the fourth subunit has undergone the last subunit transition; this is indicated by the dashed line to the open state.
In each of the models, the subunit transitions occur in sequence with each other instead of independently since sequential subunit movement better accounts for the long delay in the channel opening time course. Sequential subunit transitions also better account for the presence of a rising phase in the “on” gating currents, assuming that different subunit transitions have different rates (Zagotta et al., 1994 b).
All of the models in Fig. 2 have a single open state. Two pieces of evidence in favor of single open state models have been presented previously by Hoshi et al. (1994) and Zagotta et al. (1994 a). The first is Shaker's single-exponential open dwell-time distributions, which are best explained by a single open state. The second is the shape of Shaker's voltage dependence of open probability P o. The activation curve becomes increasingly steep at low P o (see Fig. 11 B), reaching an asymptotic steepness corresponding with the channel's total charge movement (Seoh et al., 1996); this property is inconsistent with the existence of multiple open states with voltage-dependent transitions among them (Sigg and Bezanilla, 1997).
Our strategy for the modeling here will be to consider the different models in Fig. 2 systematically, starting with the most simple models and moving to more complicated models, as they are required by the data. The modeling will be divided into four stages, as summarized here.
Stage I.
In the first stage, we point out a number of observations that suggest that the correct activation model is more complicated than all but three of the classes of models shown in Fig. 2.
Stage II.
We formally model Scheme 2+2′, which is an example of the class of models Scheme 2+2. We first use the kinetic data at the voltage extremes outlined in the previous two papers to derive starting estimates for the rates in the model, and then model these same data. We find that Scheme 2+2′ accounts for the kinetic details quite well. Then, as an additional test, we model the equilibrium voltage dependence of channel opening and charge movement relations. We find that Scheme 2+2′ accounts poorly for some features of the equilibrium data. The deviations in the fits suggest that the correct model must have a larger total charge movement, which can be provided only by adding more transitions to the scheme.
Stage III.
We consider ways of adding more transitions to Scheme 2+2′. We consider two possibilities, one that adds a single concerted transition with a large charge (Scheme 2+3′), and another that adds an additional subunit transition (Scheme 3+2′). Predictions of these two models for V2's Q-V relation indicate that Scheme 3+2′ is a better solution. In this stage, we also refit all of the kinetic and equilibrium data considered in Stage II, to obtain a set of parameters for Scheme 3+2′.
Stage IV.
In the last stage of the modeling, we compare the behavior of Scheme 3+2′ with other types of macroscopic current measurements, including kinetic measurements at intermediate voltages. These experiments act as independent tests for the robustness of Scheme 3+2′.
In each of the stages of the modeling that will be described, we consider the data obtained from the V2 mutant channel simultaneously with WT data. This allows us to characterize more precisely the functional effect of the V2 mutation. Further, it turns out that some of V2's data are uniquely useful for constraining features of the model.
Stage I: Evidence Against Simple Models
Several lines of evidence suggest that models that are more simple than Scheme 2+2 in Fig. 2 are inadequate.
Schemes 1+0, 1+1, and 1+2.
Zagotta et al. (1994 a) used the magnitude of the delay in the activation time course to derive a minimum estimate of the total number of gating transitions. By fitting the current to a sequential model with equal forward rates, these authors estimated that the Shaker channel undergoes a minimum of five transitions. We performed a similar analysis on Shaker's ionic current time courses, but with currents measured across a broader test voltage range (between −13 and +147 mV) and, also while using a more negative holding potential (−133 mV). More negative holding potentials load channels into the earliest closed states, and thus provide a more reliable estimate of the total number of transitions. Fits of the currents at +27 mV to a sequential model with equal forward rates yielded an average minimum estimate of seven transitions (the values in three patches were six, seven, and eight). Seven transitions were also required to account for the ionic currents at +67 and +147 mV (one patch each). This lower bound of seven transitions rules out all models in the classes of Schemes 1+0, 1+1, and 1+2, which have no more than six transitions.
Scheme 2+0.
This model has an activating channel undergo eight transitions. However, evidence against Scheme 2+0 is provided by the estimates of the voltage dependences of different rates (Schoppa and Sigworth, 1998a ), which indicate that there are at least three types of transitions that can be differentiated by the magnitudes of their associated charges. Scheme 2+0, however, has only two types of transitions. An assumption in this argument is that all four of a given type of subunit transition (for example, S1 → S2 in Scheme 2+0) have equivalent charge movements. While we cannot rule out models that invoke “symmetry breaking” in the movement of charge, we prefer models that do not require this added complexity.
Scheme 3+0.
Evidence against Scheme 3+0 is provided by three observations made in the first paper (Schoppa and Sigworth, 1998a ) that suggest that the final gating transition is qualitatively different from earlier transitions, including the second to last transition.
(a) The final transition has a forward rate (αN(0) = 7,000 s−1) that is much more rapid than the forward rates of the transitions that precede it; this transition contributes to a distinctly fast component in WT's reactivation time course at depolarized voltages. For independently acting subunits, the final S2 → S3 transition in Scheme 3+0 would have a forward rate similar to three other transitions S2 → S3. They would differ by statistical factors, but these would make the final transition the slowest of the four S2 → S3 transitions.
(b) For independently acting subunits, Scheme 3+0 requires that the backward rate of the last transition βN be 33% larger than βN-1 (reflecting the statistical factors). However, our estimate of βN(0) = 240 s−1 is considerably smaller than the estimate of βN-1(0) = 340 s−1.
(c) For independently or nonindependently acting subunits, Scheme 3+0 requires that the partial charges associated with the backward rates of the last two transitions be equivalent. However, the estimates of q βN and q βN-1 are different by a factor of two (q βN-1 = −0.30 e0 and q βN = −0.52 e0). Assuming again that there cannot be symmetry breaking in the partial charge estimates, these transitions cannot arise from equivalent conformational changes, as would be required in the movement of S2 ← S3 in Scheme 3+0.
A unique final transition is the most easily accounted for by making the final transition be concerted, rather than have it reflect the action of a single subunit. This argument against Scheme 3+0 also applies to Schemes 1+0 and 2+0.
Schemes 2+1 and 3+1.
Finally, there is one argument against the models Schemes 2+1 and 3+1, which each have a single concerted transition. WT's “off” gating currents after large depolarizations show a rising phase and a slow decay (Bezanilla et al., 1991; Zagotta et al., 1994 a). These features imply that the final two transitions that determine the deactivation kinetics (Schoppa and Sigworth, 1998a ) have slower reverse rates than earlier transitions. Because the magnitudes of these rates differ from those of earlier transitions, we suggest that the final two transitions represent qualitatively different transitions. The simplest model producing this variety of transition types has the last two transitions be concerted ones. Models with only one concerted transition would require that the movement of one of the four subunits (S1 ← S2 in Scheme 2+1, for example) be much slower than the others. The model of Zagotta et al. (1994 b) includes this sort of symmetry breaking to describe the slow reverse rate of the final transition in their model, which is otherwise like Scheme 2+0. However, in the absence of data that indicate that there is symmetry breaking in the rates of the final two transitions, we favor a more simple interpretation of these slow reverse rates.
This analysis leads us to first consider models of the class Scheme 2+2. If we, additionally, include transitions to states that are outside of the activation path (Hoshi et al., 1994; Schoppa and Sigworth, 1998a
), the following scheme is obtained: 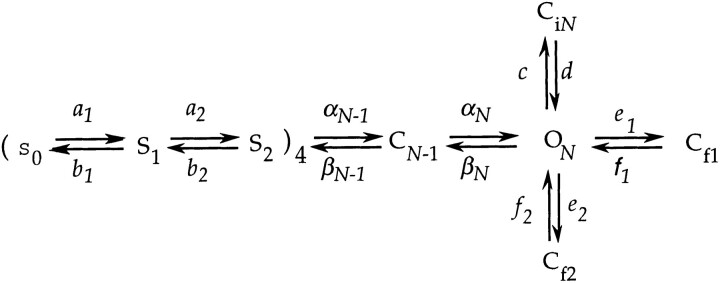 (scheme 2+2′)
as a starting hypothesis for a gating model.
Absent in Scheme 2+2′ are the transitions from closed states in the activation path into Ci states (Schoppa and Sigworth, 1998a ). We have chosen to ignore these transitions for much of our analysis because the rates of the transitions to these states (and between these states) are very poorly constrained, in contrast to the other transitions in our model. We do, however, show below that we can account for channel activation time courses with one plausible model for these additional states. Activation time courses display a prominent slow component associated with these additional transitions into Ci states.
Stage II. Modeling Scheme 2+2′
Scheme 2+2′ has quite a large number of different parameters that must be constrained (16 for the transitions in the activation path, 28 in total). To expedite the modeling, we consider separately data that reflect different subsets of transitions, following an approach similar to that of Vandenburg and Bezanilla (1991) in modeling activation gating for the squid sodium channel. In A, we model data that reflect transitions near the open state. In B, we model data that reflect earlier transitions, while fixing the parameter estimates of the transitions near the open state to those obtained in A.
(A) Modeling kinetic data that reflect transitions near the open state.
We first consider a simplified model (Scheme 0+2′) 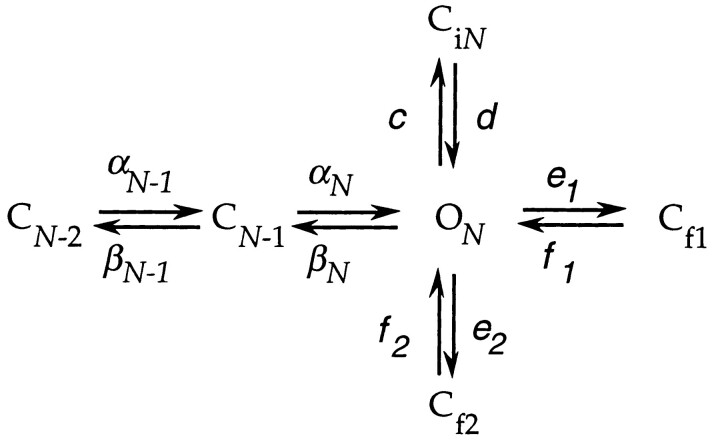 (scheme 0+2′)
that includes the final two transitions in the activation path and transitions to three additional states Cf1, Cf2, and CiN. We consider Scheme 0+2′ in the context of the following data, which reflect the final transitions in the activation path: (a) selected measurements of WT's and V2's macroscopic ionic currents; (b) open and closed dwell-time histograms derived from WT's and V2's equilibrium single channel activity at depolarized voltages (V ≥ −13 mV); and (c) WT's and V2's voltage dependence of equilibrium P o at depolarized voltages.
The starting estimates for most of the rates in Scheme 0+2′ are those obtained in the previous two papers assuming a simple sequential model. These are listed in Table I. No data exist that directly constrain the forward rate αN-1 of the second to last transition CN-1 → CN, and we assume, for simplicity, that this rate is the same as αN at V = 0 mV. However, an estimate for the partial charge q αN-1 is provided by the difference between the estimated total charge for the final two transitions (2.2 e0) obtained from V2's Q-V relation (Schoppa and Sigworth, 1998b ), and the sum of the charges q βN-1, q αN, and q βN. This gives q αN-1 = 1.1 e0 as a starting estimate.
Table I.
Parameter Estimates for Scheme 0+2′
| Partial Charge | WT's rate at 0 mV | V2's rate at 0 mV | ||
|---|---|---|---|---|
| e0 | s−1 | s−1 | ||
| Starting estimates | ||||
| q αN-1 = 1.1 | αN-1(0) = ?? | αN-1(0) ≥ 1900 | ||
| q βN-1 = −0.30 | βN-1(0) = 320 | βN-1(0) ≥ 3800 | ||
| q αN = 0.18 | αN(0) = 7000 | αN(0) ≥ 1900 | ||
| q βN = −0.57 | βN(0) = 150 | βN(0) = 580 | ||
| qc = 0.09 | c(0) = 5 | c(0) = 15 | ||
| qd = 0.07 | d(0) = 300 | d(0) = 300 | ||
| qe 1 = 0.0 | e 1(0) = 200 | e 1(0) = 600 | ||
| qf 1 = 0.20 | f 1(0) = 1600 | f 1(0) = 1600 | ||
| qe 2 − q f 2 = 0.0 | e 2(0) ≈ 103 | e 2(0) ≈ 103 | ||
| f 2(0) ≈ 104 | f 2(0) ≈ 104 | |||
| Final estimates | ||||
| q αN-1 = 1.1 | αN-1(0) = 7000 | αN-1(0) = 2200 | ||
| q βN-1 = −0.30 | βN-1(0) = 340 | βN-1(0) = 16000 | ||
| q αN = 0.18 | αN(0) = 7000 | αN(0) = 2200 | ||
| q βN = −0.52 | βN(0) = 240 | βN(0) = 650 | ||
| qc = 0.2 | c(0) = 7 | c(0) = 17 | ||
| qd = 0.0 | d(0) = 600 | d(0) = 600 | ||
| qe 1 = 0.0 | e 1(0) = 230 | e 1(0) = 400 | ||
| qf 1 = 0.20 | f 1(0) = 3500 | f 1(0) = 3500 | ||
| qe 2 = 0.0 | e 2(0) = 600 | e 2(0) = 600 | ||
| qf 2 = 0.0 | f 2(0) = 7000 | f 2(0) = 7000 |
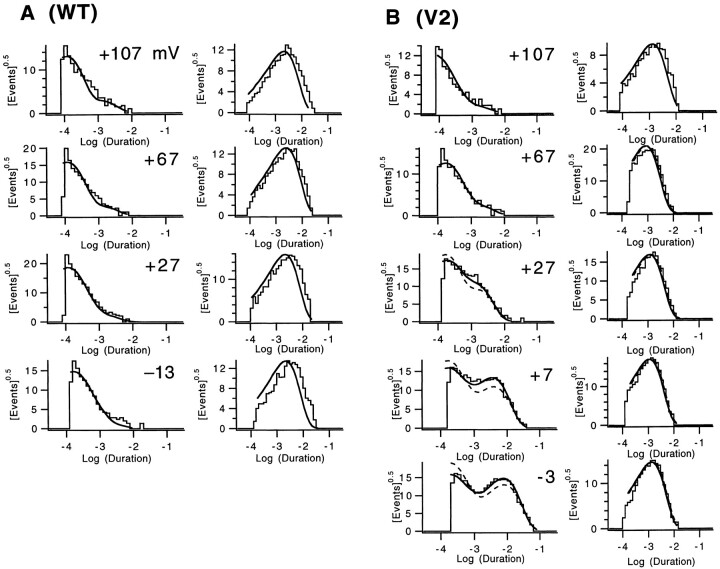
In the modeling, the final values for the three rates βN-1, αN, and βN for WT (and their associated partial charges) are constrained by the decay kinetics of WT's tail currents (Fig. 3 A), and also by estimates of the occupancies in the last closed state CN-1 during measurements of channel reactivation (Fig. 3 B). These two sets of time courses depend on the rate of channel closure βN, and the rate of reopening from the last closed state, which is determined by the ratio αN/βN-1. It turns out that the value of αN is most constrained by the time course of the fast component in WT's reactivating current. (WT's reactivation time courses were not modeled in this section, as this would require information about early gating transitions.) The value of q αN-1 is most constrained by the voltage dependence of the slowest component of V2's closed dwell-time distributions at its activation voltages (Fig. 4 B), as well as the steepness of V2's P o -V relation (Fig. 5 B), which reflects the total charge for the final two transitions.
Figure 4.
Fits of Scheme 0+2′ to the single-channel closed and open dwell-time histograms at depolarized voltages for WT (A) and V2 (B). For each channel, the closed time histograms are shown on the left, and open times on the right. Solid curves reflect the predictions of Scheme 0+2′ with the values in Table I. The dashed curves on V2's histograms were computed with parameters that are modified from those in Table I in the following way: βN-1(0) was set to 4,400 s−1 and the value αN-1(0) = 300 s−1 was chosen to best fit the closed time histograms. The solid and dashed curves are not always distinguishable. All data are from the same two patches (w265 and v433), except at +107 mV (w266 and v344).
For V2, the four rates αN-1, βN-1, αN, and βN are constrained in the following ways: (a) βN is constrained by V2's tail currents (Fig. 3 C) and open times (Fig. 4 B); (b) αN and αN-1 are constrained from the kinetics of channel opening at large test pulses (V ≥ +87 mV) after depolarizing prepulses to +7 mV (Fig. 3 D); (c) the three rates αN-1, αN, and βN-1 are constrained by the kinetics of channel opening at V2's activation voltages after large prepulses (Fig. 3 D), and also the duration of the long closures in V2's single channel closed dwell-time histograms at these voltages (Fig. 4 B); and (d) all four rates αN-1, βN-1, αN, and βN are constrained by the position of V2's P o -V relation on the voltage axis (Fig. 5 B).
The rates for the transitions to states that are not in the activation path for WT and V2 are constrained primarily by the closed and open single channel dwell-time histograms (Fig. 4). The rates for ON ↔ CiN are constrained by the ∼2-ms duration exponential component in WT and V2's closed time histograms at depolarized voltages (V ≥ −13 mV for WT and V ≥ +67 mV for V2), and the rates for ON ↔ Cf1 and ON ↔ Cf2 are constrained by the two briefer closed-time components. Additional constraints are provided by WT and V2's P o -V relations at large depolarizations (Fig. 5, A and B). The P o -V plot displays a gradual rise at V ≥ −13 mV for WT and at V ≥ +67 mV for V2, which gives a total charge (0.3 e0) for ON ↔ Cf1, and saturates at a value near 0.9, making ON ↔ Cf2 voltage independent and giving e 2/f 2 ≅ 0.1.
Table I shows that the final parameter estimates for Scheme 0+2′ are similar to the starting estimates. The most notable difference is for V2's βN-1, where the final value is approximately four times larger. The starting estimate is a lower bound, which was derived from V2's single channel burst duration (Fig. 11 in Schoppa and Sigworth, 1998b ), but the need for a significantly larger value for βN-1 is illustrated in the fits of V2's single channel dwell-time histograms in Fig. 4 B. There, in addition to curves that correspond to the final estimate, we have superimposed dashed curves on the histograms that reflect βN-1(0) = 4,400 s−1, a value near the starting lower-bound estimate. This smaller estimate for βN-1 yields a short-duration closed time component with an amplitude that is too large. The amplitude of this component is, in part, a function of the frequency of reopenings from the last closed state CN-1, and the discrepancies in these fits arise since βN-1(0) = 4,400 s−1 yields a reopening frequency that is too large. The final value for βN-1(0) (16,000 s−1) is most strongly constrained by the position of V2's P o -V relation on the voltage axis (Fig. 5 B), which is a function of the ratio of the rates of the last two transitions.
(B) Modeling kinetic data that reflect S0 ↔ S1 and S1 ↔ S2.
We next model kinetic data that reflect the subunit transitions S0 ↔ S1 and S1 ↔ S2 in Scheme 2+2′. We make use of the complete model while initially constraining the values of the rates of the final transitions to be the same as those just assigned above. In these simulations, the forward and backward rates of each subunit undergoing one of the two subunit transitions are each scaled by a statistical factor that reflects the number of available subunits. For example, for the very first subunit undergoing S0 ↔ S1, the forward rate is a 1 multiplied by four, and the backward rate is just b 1. Thus, our initial assumption in the modeling is that the four Shaker subunits gate independently of each other, since this is the simplest model. Subunit–subunit interactions are included later as required by the data.
The parameter estimates for S0 ↔ S1 and S1 ↔ S2 are constrained by (a) WT's and V2's macroscopic ionic and gating currents at depolarized voltages; (b) WT's and V2's gating currents at hyperpolarized voltages; and (c) WT's and V2's reactivation time courses. The starting and final estimates for the parameters are given in Table II.
Table II.
Parameter Estimates* for S0↔ S1 and S1↔ S2 in Scheme 2+2′
| Partial charge | WT's rate at 0 mV | V2's rate at 0 mV | ||
|---|---|---|---|---|
| e0 | s−1 | s−1 | ||
| Starting estimates | ||||
| qa 1 = 0.36 | a 1(0) = 1200 | a 1(0) = 1270 | ||
| qb 1 = −0.53 | b 1(0) = 150 | b 1(0) = 260 | ||
| qa 2 = 0.17 | a 2(0) = 2100 | a 2(0) = 1400 | ||
| qb 2 = −0.24 | b 2(0) = 540 | b 2(0) = 540 | ||
| Final estimates | ||||
| qa 1 = 0.40 | a 1(0) = 1600 (c = 1.3)‡ | a 1(0) = 1300 (c) | ||
| qb 1 = −0.40 | b 1(0) = 650 (c −1) | b 1(0) = 650 (c −1) | ||
| qa 2 = 0.09 | a 2(0) = 4400 | a 2(0) = 3500 | ||
| qb 2 = −0.33 | b 2(0) = 1000 | b 2(0) = 1000 |
For the final transitions in Scheme 2+2′, all parameters are equal to the final estimates given in Table I for Scheme 0+2′ except for the partial charge q αN-1 = 0.75 and V2's rates αN-1(0) = 3800, βN-1(0) = 19000, and αN(0) = 3800.
The parameter c reflects a small amount of cooperative interaction, which has been introduced into S0↔ S1, as shown in Scheme I.
Derivation of starting estimates of the rates for S0 ↔ S1 and S1 ↔ S2
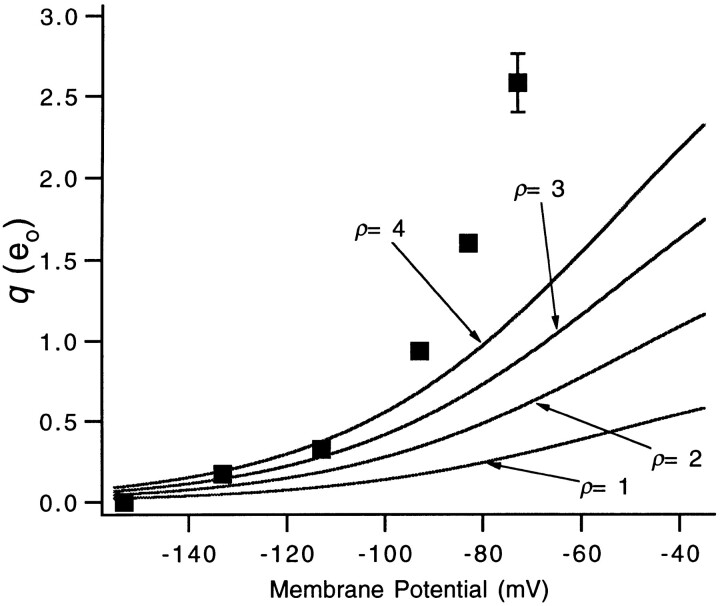
We use as starting estimates for the rates a 1 and b 1 of the first subunit transition S0 ↔ S1 the assigned values α1 and β1 for the very first transition in a sequential model, as derived in the previous two papers; that is, we make the very first transition be the first of four S0 ↔ S1 transitions. This formulation is the simplest, but it is also favored by an apparent paradox that arises when one compares the kinetic description of the first transition with equilibrium data that correspond to the earliest transitions. The α1 and β1 estimates derived from ionic and gating current time courses give a charge estimate of z 1 = 0.9 e0, and a midpoint voltage (V1/2) for the first transition of −53 mV. However, from the equilibrium q-V relation for WT (Fig. 6), the first 0.9 e0 of charge that moves in activation occurs at much more negative voltages, below −80 mV. A general way that a transition with a given midpoint voltage can contribute to charge movement at more negative voltages is if the first transition is one of several like transitions with similar midpoint voltages; the charge movement at the most negative voltages would then reflect the sum of the charge associated with several transitions. Fig. 6 illustrates simulations in which we assume that the first transition is one of four S0 ↔ S1 transitions, and have fixed the charge and the midpoint voltage of S0 ↔ S1 to that derived from the kinetics. The curve for four transitions (p = 4) accounts quite well for the magnitude of the charge movement at voltages below −90 mV. Models with fewer than four subunits yield charge magnitudes that are too small.
Figure 6.
The magnitude of the average, absolute charge movement per channel at negative voltages was used to test the “n
4” scheme as a model of the first gating transitions. The solid curves were computed from a model assuming a number p of equivalently acting subunits, for which the charge movement q is given by For each curve the charge z
1 and midpoint voltage V
1 for the transition were fixed to 0.89 and −53 mV, which are the charge and midpoint voltage values of the very first gating transition derived from the kinetic estimates of α1 and β1. The displayed charge values reflect the same data as in Fig. 1 in Schoppa and Sigworth (1998a), except scaled by the estimate of the single channel charge movement q = 12.3 e0 reported in Schoppa et al. (1992). The error bars are smaller than the symbols for most of the values.
Our starting estimate of the forward rate a 2 for the second subunit transition S1 ↔ S2 is the forward rate αp, derived in the context of a sequential model (Schoppa and Sigworth, 1998a ). This is a reasonable guess because it is the only forward rate estimate available for an intermediate transition, but evidence in favor of this assignment also comes from a comparison of the plots of the voltage dependences of the activation time constant τa and activation delay δa (See Fig. 4 B in Schoppa and Sigworth, 1998a ). This shows that the two parameters have nearly the same voltage sensitivities across the entire voltage range between −13 and +147 mV, with both parameters displaying shallower voltage dependences at high voltages. This behavior would be expected if the channel opening time course is determined by the movement of S0 → S1 and S1 → S2. The more voltage-dependent transition with a forward rate equivalent to α1 would determine the kinetics of the final approach and the delay in the ionic current at low depolarized voltages (V < +67 mV), while the less voltage-dependent transition with a forward rate αp would determine the current time course at high voltages (V > +67 mV).
We have assigned the starting estimate of the backward rate b 2 for S1 ← S2 to be βd, which reflects our estimate of the “average” backward rate for many intermediate transitions. βd is the only rate estimate that is available for S1 ← S2, but an argument can be made that it is not unreasonable. The voltage dependence of the delay in the reactivation time course requires that there be a large number of transitions with backward rates with very shallow voltage dependences, and having four S1 ← S2 transitions with partial charges q βd = −0.24 e0 helps satisfy this requirement.
Derivation of final estimates for the forward rates a1 and a2.
For WT, a 1 is the slowest forward rate at voltages near 0 mV, and is therefore constrained by the rise of the ionic current at these voltages (Fig. 7, A and B) and by the decay of the on gating currents (Fig. 7 C). For V2, a 1 is also the slowest forward rate at these voltages and is constrained by the decay of the on gating currents. In contrast to WT, the rise of V2's ionic current at these voltages does not directly reflect a 1.
For both WT and V2, a 2 is the slowest forward rate at very large depolarizations (V ≥ +67 mV), and is, therefore, constrained by the rising kinetics of the ionic current time courses at these voltages (Fig. 7 A). The value for a 2 is also constrained by the shape of the peak of the on gating currents at voltages near 0 mV (Fig. 7 C); the peak of the gating current reflects the rates of all of transitions that follow the first slowest transition, including a 2. Finally, both a 1 and a 2 are constrained by the delay in the ionic current time courses at V ≥ −13 mV, since the delay reflects the sum of all of the forward rates (Schoppa and Sigworth, 1998a ).
Most of the small differences in the starting and final estimates of a 1 and a 2 can be understood from the approximations we used in deriving the starting estimates. For example, the relatively small starting estimate for a 1 was obtained assuming that backward rates are negligible at voltages near 0 mV; this is seen from the values in Table II to be clearly wrong. The difference between the starting and final estimates of a 2(0) and q a2 can be explained by the following line of reasoning: in the modeling, values for a 2(0) that are larger than the starting estimates are required to yield the correct delay in the ionic current at voltages near 0 mV; a smaller value yields a delay that is too long. A smaller value for the charge q a2, then, is required to prevent the model from predicting a too-rapid channel opening time course at large depolarizations such as +147 mV.
Subunit–subunit interactions in S0 → S1
While our initial assumption in the modeling is that the different gating subunits act independently, we find that the addition of a small degree of cooperative interaction between subunits for the first forward subunit transition S0 → S1 causes modest improvements in some of the fits. In particular, the interaction helps provide a sufficiently broad plateau phase in WT's and V2's on gating current time course at voltages near 0 mV. While the fact that a
1 is smaller than a
2 contributes to a plateau phase in the predicted current (Fig. 7
C), the measured on current is broader than can be accounted for by Scheme 2+2′ in the absence of these interactions. We introduced interaction in S0 → S1 by multiplying each of the forward rates by a factor c raised to a power that reflects the number of subunits that have undergone this transition. This can be depicted in the expanded form of as: (scheme I)
Positively cooperative interaction is introduced for c > 1.
Good fits of Scheme 2+2′ are achieved with the relatively small value c = 1.3. Indeed, our simulations of Scheme 2+2′ (Fig. 7 D) show that adding more cooperative interaction into S0 → S1 yields worse fits of WT's on gating currents. For various values of c, good fits of WT's channel opening time course across a broad voltage range can be obtained by adjusting the values for a 1(0). However, values of c ≥ 1.5 predict on gating currents that have a peak that is too broad.
An explicit model of Ci states.
Scheme 2+2′ accounts for most of the features of the ionic current time courses, but is unable to account in detail for the kinetics of the final approach of WT's and V2's channel opening time course at voltages ≥+67 mV (Fig. 7 A). This discrepancy reflects the absence in Scheme 2+2′ of transitions to Ci states from closed states in the activation path, which account for the slow upward creep in the channel opening time course at high voltages (Schoppa and Sigworth, 1998a ). The discrepancy is larger for V2 because these channels enter Ci states from closed states more frequently than WT (Schoppa and Sigworth, 1998b ). Nevertheless, good agreement is obtained between the τa values derived from the simulated currents and those derived from fits of WT and V2's measured currents to the sum of two exponentials (Fig. 7 B). The value of τa derived in this way reflects the kinetics of the main activation path.
One plausible way of incorporating transitions into Ci from closed states is illustrated in Fig. 8. Here we simulate activation time courses for a model that is equivalent to Scheme 2+2′, except that we now allow the channel to enter Ci states from the last closed state, as well as the open state. This simple model accounts quite well for the slow component in the activation time course, including the much larger Ci component in V2's activation time course. Good fits of this modified Scheme 2+2′ are obtained while the rates of the transitions in the basic Scheme 2+2′ have the values indicated in Table II. It must be emphasized that we lack data that directly constrain transitions to Ci from closed states; we show these simulations of the modified Scheme 2+2′ mainly to emphasize the ability of Scheme 2+2′ to account correctly for the kinetics of the main activation path.
Figure 8.
A modified version of Scheme 2+2′ accounts for a slow component in the activation time course. In this model, the channel can enter the state CiN-1 from the last closed state CN-1. 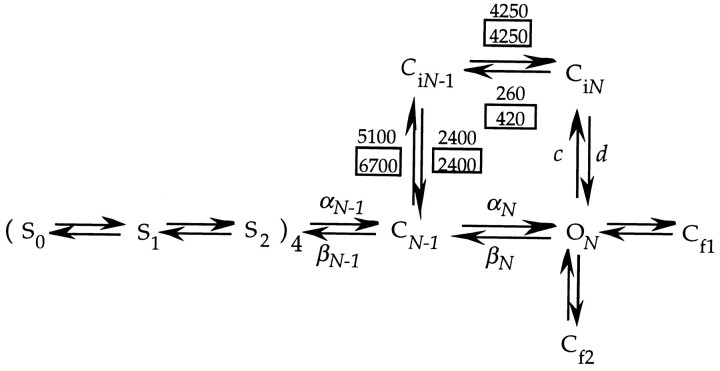 A transition between CiN-1 and CiN is also allowed. The indicated rates of the added transitions are for +147 mV, where the slow component is prominent in the ionic current. The partial charges associated with these transitions were set to be identical to those associated with the parallel transitions; e.g., the charges for CN-1 ↔ CiN-1 are the same as for ON ↔ CiN. The rates for the other transitions in the model are nearly identical to the rates for Scheme 2+2′, given in Tables I and II. Rates for V2 are boxed. The one exception is that the rate d for WT had to be increased slightly (from 600 to 1,000 s−1) to account for WT's kinetics in this patch; being the slowest “forward” rate in the alternate path (at +147 mV), the rate d sets the time course of the slow component. The amplitude of the slow component is largely set by the rate of CN-1 → CiN-1, as well as the occupancy in CN-1. Interestingly, the model accounts for the fourfold larger amplitude of the slow component for V2 without a substantial change in CN-1 → CiN-1, suggesting that the difference in WT's and V2's ionic current arises from differential occupancy in CN-1. For reference, the values of the other relevant rate constants at +147 mV are (s−1), for WT: αN-1 = 540,000, βN-1 = 60, αN = 19,000, βN = 12, c = 22, d = 1,000; for V2: αN-1 = 290,000, βN-1 = 3,300, αN = 10,200, βN = 32, c = 54, d = 600.
Derivation of final estimates for the backward rates b1 and b2.
For estimating the backward rates for the subunit transitions, we assume for simplicity that the first backward transition S0 ← S1 is affected by the same degree of cooperative interaction as the forward transition S0 → S1, as depicted in Scheme I.
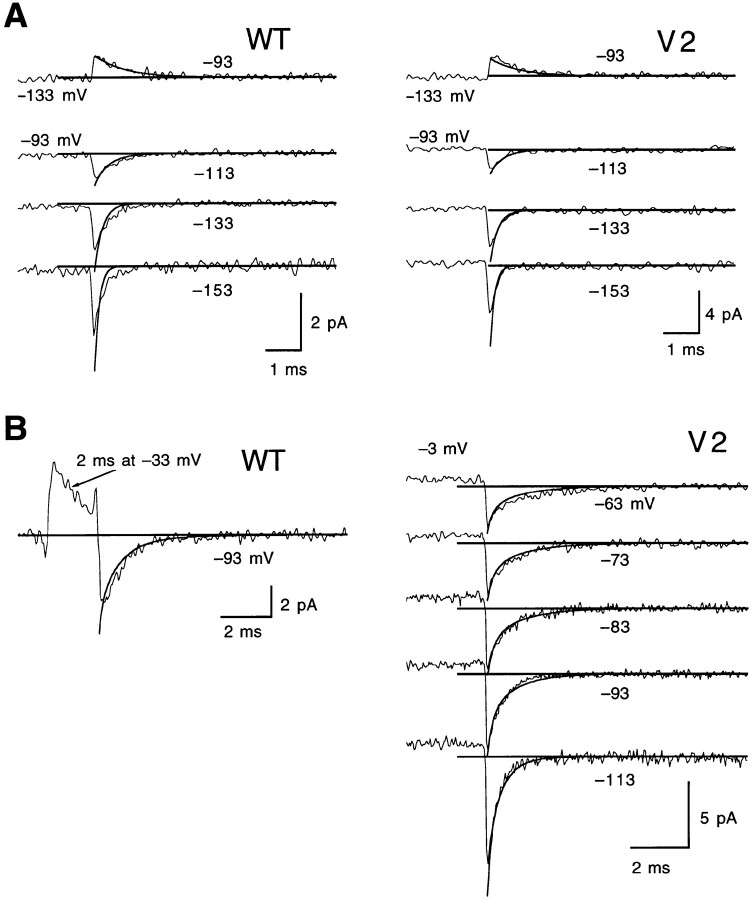
The backward rates b 1 and b 2 for WT and V2 are constrained by the kinetics of off gating currents at hyperpolarized voltages (Fig. 9). The value of b 1 is constrained by off currents induced by voltage steps between different hyperpolarized voltages (Fig. 9 A), and both b 1 and b 2 are constrained by off gating currents measured after intermediate depolarizations (Fig. 9 B). These intermediate depolarizations preload channels into intermediate closed states, so that the subsequent off currents reflect the channel moving backward through intermediate and early states.
Figure 9.
Scheme 2+2′ accounts for WT's and V2's gating currents at hyperpolarized voltages. Simulations are shown for (A) currents induced by voltage steps between −93 mV and more negative voltages (patches w249 and v240) and (B) currents induced by step hyperpolarizations from intermediate prepulse voltages (patches w217 and v417). In B, the duration of the prepulse was 2 and 20 ms for WT and V2, respectively. A short prepulse was used for WT to minimize the contribution of channels in the open state to the gating current time course.
At some of the test voltages (e.g., at −63 mV), V2's gating currents display a fast component superimposed on a slow component. The fast and slow components provide a relatively direct way to constrain b 1 and b 2, and account for the disparate values for V2's b 1 and b 2 in Table II. (The difference between b 1 and b 2 is actually larger than is reflected by the values in the table, due to the cooperativity factor in S0 ← S1.)
The values of b 1 and b 2 are also constrained by WT's and V2's reactivation time courses (Fig. 10, A and B). The time course of reactivation depends on the duration t h of the deactivating hyperpolarization. This dependence reflects the rates b 1 and b 2 at which the channel moves back through intermediate and early states at the hyperpolarizing potential V h. These reactivation experiments are particularly important for constraining the partial charges q b1 and q b2. To illustrate the requirement for small charge values, we show additional simulations of WT's reactivation time courses in Fig. 10 C, in which we have assigned q b1 and q b2 to be two or three times the values listed in Table II. At the given values of q b1 and q b2, the values for b 1(0) and b 2(0) were first adjusted to yield the best fits of the reactivation time courses after hyperpolarizations to V h = −113 mV. The predictions at Vh = −193 mV are then compared with experimental data. As can be seen in Fig. 10, C and D, larger values for q b1 and q b2 clearly make the model perform poorly; the reactivation delay accumulates too rapidly as t h increases. The large partial charge values yield backward rates at hyperpolarized voltages that are too large, causing the channel to move backward too quickly through intermediate and early states.
Small adjustments in the parameter estimates for the final transitions in Scheme 2+2′.
Our strategy for constraining the parameters in Scheme 2+2′ has been first to model the transitions near the open state (Scheme 0+2′) and subsequently to add earlier transitions while fixing the parameters of the final transitions to be the same as those derived in the context of Scheme 0+2′. Returning to the data in Figs. 3–5 that reflect the final transitions, we obtained slightly better fits in making some minor adjustments in the parameters of the final transitions (described in Table II). All of the illustrated fits in Figs. 7–10 actually reflect the adjusted parameters for the final transitions.
(C) Modeling WT's and V2's Po-V and Q-V relations with Scheme 2+2′
As shown by the previous simulations, Scheme 2+2′ accounts very well for kinetic data obtained at voltage extremes. In the final part of Stage II, we consider WT's and V2's voltage dependences of channel opening (P o -V) and charge movement (Q-V).
The simulations of these equilibrium data (Fig. 11) indicate that, without changing the values for the parameters from those listed in Table II, Scheme 2+2′ accounts for many of the features of WT's and V2's P o -V and Q-V relations. The model predicts WT's characteristic steep voltage dependence of channel opening, as well as the steep component of charge in WT's Q-V relation that has been described by Bezanilla et al. (1994).
Scheme 2+2′, however, accounts poorly for some of the other features of the equilibrium data. For example, the model significantly underestimates the steepness of V2's Q-V relation (Fig. 11 A). It is difficult to interpret this discrepancy, but one explanation is that the total gating charge in the model is too small. More direct evidence that more charge is required in the model is obtained from the predictions of the model to the log-transformed equilibrium data (Fig. 11 B). It is clearly apparent that Scheme 2+2′ underestimates the steepness of WT's P o curve, which reflects the total charge. Indeed, Scheme 2+2′ contains a total charge of only 7 e0, much less than the model-independent estimate of 13 e0 that has been obtained from measurements of gating currents (Schoppa et al., 1992; Aggarwal and MacKinnon, 1996).
A different test of Scheme 2+2′ is provided by evaluating the charge movement at negative voltages (Fig. 11 B). At asymptotically negative voltages, the steepness of the Q-V relation reflects the amount of charge associated with the first transition in the activation path; in Scheme 2+2′, this is the first of four subunits undergoing S0 → S1. Scheme 2+2′ underestimates the steepness of the Q-V relations at negative voltages, which could imply that our total charge estimate of 0.8 e0 for S0 ↔ S1 is too small. Alternatively, if the charge movement at the lowest voltages where we could measure currents (between −113 and −83 mV) reflects more than the very first transition, the discrepancy is more difficult to interpret (see below).
Stage III: Adding Four more Transitions, Yielding Scheme 3+2′
The difference between the charge in Scheme 2+2′ (7 e0) and the model-independent estimate of 13 e0 obtained from gating currents suggests that additional charge must be added to the model. In this stage we will address ways to increase the total charge.
As a starting point, consider the following two observations from the modeling that has been performed thus far. The first is that the voltage dependences of the forward and backward rates in Scheme 2+2′ are very tightly constrained by the kinetics at depolarized and hyperpolarized voltages; simulations like those shown in Fig. 10 C indicate that increasing the charges will yield poor fits of the data. Thus, the additional 6 e0 of charge must be introduced by adding more transitions instead of by changing the charges on the transitions in Scheme 2+2′. The second observation is that, in Scheme 2+2′, the first and final transitions are more tightly constrained than intermediate transitions. Data can be identified that reflect only the very first transition (gating currents at hyperpolarized voltages) or only the last transitions (tail currents and reactivation time courses), but the intermediate transitions are constrained only by kinetic data that reflect the composite properties of many transitions. Thus, we favor adding new transitions at intermediate positions in the model.
Distinguishing between Scheme 2+3′ and Scheme 3+2′.
We are unable to choose among all of the large number of possible ways of adding more intermediate transitions to the model, but here we will consider two of the most simple solutions. One of these models adds more charge by adding a single concerted transition that carries a large charge; this is Scheme 2+3 in Fig. 2, or Scheme 2+3′ when the transitions to states outside of the activation path are added. The large-valenced transition would be the third to last transition that the channel undergoes before it opens. The other solution adds an additional subunit transition (Scheme 3+2′).
We can choose between these two possibilities on the basis of the shape of V2's Q-V relation. In the fits of Scheme 2+2′ to V2's Q-V relation in Fig. 11 A, the discrepancies in the predicted steepness are seen to occur at all voltages; the predicted curve is too shallow at negative voltages as well as at intermediate voltages. Thus, the additional charge must be introduced in a way that would steepen the Q-V relation across a broad voltage range.
Fig. 12 A shows simulations of Scheme 2+3′ in which the added transition has a valence of 3.5, the same large valence that Bezanilla et al. (1994) assigned to the pentultimate step in their model. The result is little steepening of the Q-V relation at hyperpolarized voltages, but excessive steepening of V2's Q-V relation at intermediate voltages. It appears that the additional concerted transition in Scheme 2+3′ has too much charge. Fig. 12 B shows that Scheme 3+2′, with the same amount of added charge, qualitatively performs better. Having the charge distributed between four S2 ↔ S3 transitions, each with less charge, more effectively steepens V2's Q-V relation at both low and high voltages, while not introducing a component of charge that is too steep.
Figure 12.
Constraints on how to add more transitions to Scheme 2+2′ were provided by the shape of V2's Q-V relation. (A) V2's mean Q-V relation has been superimposed (solid curve) with predictions of Scheme 2+3′, with the concerted transition in the third to last position having a valence of 3.5. This model steepens the Q-V relation compared with the predictions of Scheme 2+2′ (dashed curve). However, it yields a Q-V relation that is too steep at voltages near −40 mV, while remaining too shallow at hyperpolarized voltages (near −80 mV). For the simulations, the parameter estimates for all but the large valenced transition were fixed to be the same as in Scheme 2+2′; the midpoint voltage of the new transition was varied to best account for V2's Q-V relation. (B) Scheme 3+2′ performs better at steepening V2's Q-V relation across the entire voltage range. For these simulations, the parameter values for S0 ↔ S1 and S1 ↔ S2 were those given for the same transitions in Scheme 2+2′ in Table II. For S2 ↔ S3, we assigned a charge (0.88 e0) that is one-fourth of the charge (3.5 e0) assigned to the concerted transition in Scheme 2+3′ in A. Its midpoint voltage was varied to yield the best fits of the data. (C) V2's Q-V relation was also used to obtain a rough estimate of the equilibrium constant for S2 ↔ S3. Three different simulations of Scheme 3+2′ are shown for different values of a factor R (R = 3, 1, and 0.33) that reflect the ratio of the equilibrium of S2 ↔ S3 versus that of S1 ↔ S2. In these simulations, the charge associated with S2 ↔ S3 was assigned to be the same as that associated with S1 ↔ S2, given in Table II.
Scheme 3+2′ with a minimal number of unconstrained parameters.
We next assign rates for the new, larger model Scheme 3+2′, which in its complete form can be depicted as 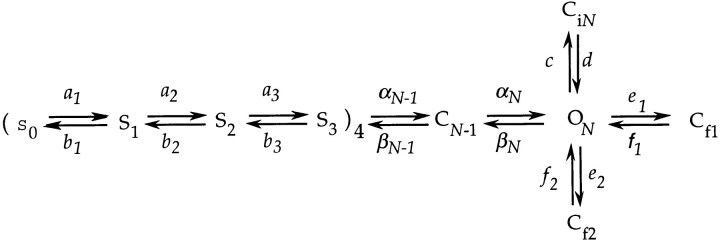 (scheme 3+2′)
The final parameter values for Scheme 3+2′ are listed in Table III.
Table III.
Parameter Estimates for Scheme 3+2′
| Partial charge | WT's rate at 0 mV | V2's rate at 0 mV | ||
|---|---|---|---|---|
| e0 | s−1 | s−1 | ||
| For S0↔ S1, S1↔ S2, and S2↔ S3 | ||||
| qa 1 = 0.47 | a 1(0) = 1650 (c = 1.3) | a 1(0) = 1450 (c) | ||
| qb 1 = −0.52 | b 1(0) = 450 (1/c) | b 1(0) = 450 (1/c) | ||
| qa 2 = 0.08 | a 2(0) = 4900 | a 2(0) = 4270 | ||
| qb 2 = −0.52 | b 2(0) = 960 | b 2(0) = 960 | ||
| qa 3 = 0.08 | a 3(0) = 7920 | a 3(0) = 6980 | ||
| qb 3 = −0.52 | b 3(0) = 1560 | b 3(0) = 1560 | ||
| For the transitions near the open state | ||||
| q αN-1 = 0.75 | αN-1(0) = 7000 | αN-1(0) = 3800 | ||
| q βN-1 = −0.30 | βN-1(0) = 340 | βN-1(0) = 19000 | ||
| q αN = 0.18 | αN(0) = 7000 | αN(0) = 3800 | ||
| q βN = −0.52 | βN(0) = 240 | βN(0) = 650 | ||
| qc = 0.2 | c(0) = 7 | c(0) = 17 | ||
| qd = 0.0 | d(0) = 600 | d(0) = 600 | ||
| qe 1 = 0.0 | e 1(0) = 230 | e 1(0) = 400 | ||
| qf 1 = 0.20 | f 1(0) = 3500 | f 1(0) = 3500 | ||
| qe 2 = 0.0 | e 2(0) = 600 | e 2(0) = 600 | ||
| qf 2 = 0.0 | f 2(0) = 7000 | f 2(0) = 7000 |
The parameter c reflects a small amount of cooperative interaction, which has been introduced into S0↔ S1, as shown in Scheme I.
Here we outline a simple strategy that accommodates the added S2 ↔ S3 transition in Scheme 3+2′. Because there are no data that directly constrain this new transition, the solution that we adopt is an approximate one that has the same number of free parameters as in Scheme 2+2′.
Assigning a3 and b3
For S2 ↔ S3, we choose to fix the partial charges q a3 and q b3 to be the same as q a2 and q b2, respectively, and let a 3 = ma 2 and b 3 = mb 2. Making the ratio a 3/b 3 to be equal to a 2/b 2 is a simplification that is not unreasonable. Consider again the shape of V2's Q-V relation (Fig. 11 A). While Scheme 2+2′ underestimates the steepness of V2's Q-V relation, it is able to account for the correct position of the Q-V relation on the voltage axis. This would suggest that the equilibrium of S2 ↔ S3 in Scheme 3+2′ must be such as not to change the position of V2's Q-V relation on the voltage axis. Fig. 12 C illustrates simulations in which we have assigned three different values for the ratio a 3(0)/ b 3(0). For a ratio that is similar to a 2(0)/b 2(0), Scheme 3+2′ predicts a Q-V relation that maintains the correct position on the voltage axis, but values for a 3(0)/b 3(0) that are larger or smaller by a factor of three yield predictions that are displaced to the right or the left of the measured Q-V relation.
A large value for m is suggested by the fact that the simpler Scheme 2+2′ is able to account very well for the kinetics of channel opening (Figs. 7 A and 8). In principle, then, we should be able to obtain good fits to Scheme 3+2′ by making the rate a 3 fast, while leaving the rates of the other transitions intact. The assigned values for a 3 and b 3 in Table III correspond to the value m = 1.62. It should be noted that the behavior of the model is very similar if the order of transitions is reversed, such that S1 ↔ S2 is made the faster one, and S2 ↔ S3 the slower. The time course of the on gating currents, however, is sensitive to the order of the transitions. If the order is reversed, the predicted time course at voltages just below 0 mV decays too rapidly (data not shown).
Adjustments in the final charge estimates for Scheme 3+2′.
Next, we adjust all the parameters in the model to take into account the addition of S2 ↔ S3. As it turns out, the addition of this single set of rapid transitions actually makes little difference in most of the kinetic predictions, so that little change in the parameters is required. The largest difference between Schemes 3+2′ and 2+2′ is in the estimates of the partial charges of the backward rates for the subunit transitions. In the modeling, we first set the charges for S0 ↔ S1 and S1 ↔ S2 in Scheme 3+2′ to be the same as those of the corresponding transitions in Scheme 2+2′ (and then made q a3 and q b3 equal to q a2 = 0.09 e0 and q b2 = −0.33 e0, respectively). However, the total gating charge for this version of Scheme 3+2′ would be 8.7 e0, still substantially smaller than the measured total charge of 13 e0. Indeed, Scheme 3+2′ with these parameters underestimates the voltage dependence of WT's P o and underestimates the steepness of V2's Q-V relation (Fig. 12 C). To account for the charge discrepancy, we add more total charge by introducing an increase, ∼20%, in the charge associated with each of the three subunit transitions. Arbitrarily, we choose to add most of this charge to the partial charges of the backward rates. To further reduce the number of free parameters, we constrained q b1, q b2 , and q b3 to have the same values, −0.52 e0. The final Scheme 3+2′ has a total charge of 10.8 e0.
Fits of Scheme 3+2′ to kinetics at voltage extremes and to equilibrium data.
Because the rate constants of the final transitions are unchanged, the predictions of Scheme 3+2′ for the kinetic data that reflect the final two transitions (illustrated in Figs. 3–5) are essentially identical and are not shown.
Figs. 13–16 show that Scheme 3+2′ also performs reasonably well at accounting for the kinetic measurements that reflect the subunit transitions. Adding one new subunit transition with a fast forward rate a 3 has little effect on the predicted time courses of the ionic and on gating currents at depolarized voltages (Figs. 13 A and 14). The effect of an added rapid transition on the predictions of the off gating currents after intermediate amplitude prepulses is also apparently quite small (Fig. 15 B).
Figure 13.
Scheme 3+2′ accounts for WT's and V2's macroscopic ionic current time courses across a wide voltage range. Simulations are shown for currents measured at depolarized voltages (A) and at intermediate voltages (B). The holding potential was −93 mV. To allow comparison of Scheme 3+2′ with Scheme 2+2′, the simulations of activation time courses here were made while incorporating changes to Scheme 3+2′ identical to those made for Scheme 2+2′ in Fig. 8; we have added a transition from the last closed state to the state CiN-1 (and also the transition CiN-1 ↔ CiN). The rates for these additional transitions are those given in the legend to Fig. 8. All current traces for WT and V2 come from the same two WT and V2 patches (w312 and v096). (C) The good fits of the ionic currents are also reflected in a comparison of the τa and δa parameters (symbols, lines) derived from the measured/simulated currents. The τa values at high depolarized voltages (V ≥ +67 mV) reflect the fast time constant in fits of the measured and simulated currents to the sum of two exponentials.
Figure 14.
Scheme 3+2′ accounts for WT's and V2's on gating currents across a wide voltage range, between −73 and +47 mV. All current traces come from the same two WT and V2 patches (w212 and v219). Notably, at −33 mV, the model accounts for a slow component that is present in WT's current, but absent in V2's current. The holding potential was −93 mV in these recordings.
Figure 15.
Scheme 3+2′ accounts for WT and V2's gating currents at most hyperpolarized voltages. Simulations are shown for (A) currents induced by voltage steps between −93 mV and more negative voltages, and (B) currents induced by step hyperpolarizations from intermediate prepulse voltages. Data are identical to the traces in Fig. 9. For the most negative test voltage in A (−153 mV), Scheme 3+2′ predicts a current that decays too rapidly, by roughly a factor of 2. This discrepancy reflects the 20% increase in q b1 that was introduced to help achieve a sufficiently large total gating charge (see text).
The most substantial differences in the predictions of Schemes 2+2′ and 3+2′ are for the kinetic measurements at very hyperpolarized voltages. Modest discrepancies are observed for the fits of Scheme 3+2′ to the gating currents induced by voltage steps between different hyperpolarized voltages (Fig. 15 A), but the discrepancies are the largest for the reactivation time courses (Fig. 16). For very negative hyperpolarizations (V h = −193 mV), Scheme 3+2′ predicts a reactivation delay that is too long (Fig. 16 A), and, similarly, overestimates the rate at which the delay in the reactivation time course accumulates with longer hyperpolarizations by roughly a factor of four (Fig. 16 B). These discrepancies at the most hyperpolarized V h reflect the assigned 20% increases in q b1 and q b2, which, given Eq. 1, yield backward rates that are too large at hyperpolarized voltages.
For the equilibrium data (Fig. 17), Scheme 3+2′ performs considerably better than Scheme 2+2′ in predicting V2's Q-V relation (Fig. 17 A) and the steepness of WT's activation curve at low P o (Fig. 17 B). The improvements can be attributed to the increase in total gating charge in Scheme 3+2′. Improvements are also seen in fits of the Q-V relation at the most hyperpolarized voltages (Fig. 17 B), which reflects the small increase in the total charge for S0 ↔ S1. Scheme 3+2′ also maintains the ability to account for WT's characteristic steep P o-V and Q-V relations across the activation voltage ranges (Fig. 17 A).
Figure 17.
Scheme 3+2′ performs much better than Scheme 2+2′ at predicting certain features of WT's and V2's equilibrium voltage dependence of channel opening and charge movement, including the steepness of V2's Q-V relation and the voltage sensitivity of WT's P o at low P o. As in Fig. 11, plots are shown with ordinates that are linear (A) or log transformed (B).
In summary, two of the features of the fits of Scheme 3+2′ emphasize that this model is an approximate solution with parameters that reflect a balance between two competing types of data. A small remaining discrepancy in the fits of WT's equilibrium P o -V relation in Fig. 17 B implies that the correct model will require more charge than in Scheme 3+2′, but the discrepancies in the kinetic fits at the most hyperpolarized voltages (Figs. 15 and 16) imply that some of the partial charges in the model are already too large. Nevertheless, the relatively good fits of the data imply that Scheme 3+2′, with the assigned parameter values, is a reasonable approximate solution.
IV. Additional Tests of Scheme 3+2′
In the fourth and final stage of the modeling, we consider the ability of Scheme 3+2′ to account for several additional types of kinetic data. In most of the experiments described here, we make use of test pulses or prepulses to intermediate voltages (between −73 and −23 mV). The fact that both forward and backward rates are nonnegligible at intermediate voltages complicates the interpretation of many of these data, but each of the experiments functions as an independent test of the robustness of Scheme 3+2′.
(A) WT's and V2's macroscopic ionic and gating currents at intermediate test voltages.
Fig. 13 shows that Scheme 3+2′ accounts for WT's ionic currents at intermediate test voltages quite well, and, in particular, accounts for WT's characteristic slow and nonsigmoidal channel opening time course at small depolarizations (Zagotta et al., 1994 a). Scheme 3+2′ also accounts for the time course of the on gating currents at all intermediate test voltages (Fig. 14). At −33 mV, for example, the model predicts a plateau phase of WT and V2 currents and also predicts a slow component in the decay of WT current (Bezanilla et al., 1994) that is absent in the case of V2 (Schoppa and Sigworth, 1998b ). The slow component is associated with WT's channel opening; V2 lacks this component because V2 fails to open at these voltages.
(B) WT's and V2's channel opening time courses after various prepulses.
Test currents measured after prepulses that preload channels into different distributions of states emphasize the kinetics associated with various subsets of transitions. We performed simulations of Scheme 3+2′ for an experiment in which we fixed the test pulse voltage and varied the amplitude of the prepulse (Fig. 18). This is an experiment like that performed by Cole and Moore (1960), who showed that changes in the prepulse altered the delay of the squid potassium current. Fig. 18 A shows that the model accounts quite well for the kinetics of the rising phase of the Shaker currents, as well as the delay for each of the different prepulses. The good fits of the current rising phase (Fig. 18, A and B) implies that the model correctly predicts the kinetics of the rate-limiting step for different starting conditions. The good fits of the delay for the different prepulses (Fig. 18, A and C) indicate that the model correctly predicts the equilibria of the transitions that contribute to the delay at the test-pulse voltage.
Scheme 3+2′ also accounted very well for a different experiment, in which we measured ionic currents at a fixed test pulse voltage and varied the duration of a prepulse (to −33 mV). These simulations are not shown. These good fits indicate that the model accounts for the time-dependent state occupancy changes during the prepulse.
(C) WT and V2 off gating currents after prepulses.
The ef- fects of prepulses on gating currents are illustrated in Fig. 19. In these experiments, we used a hyperpolarized test voltage (−93 mV), so that the observed currents reflect the backward kinetics from the set of states that are occupied during each of the prepulses. Both the amplitude of the prepulse (Fig. 19 A for WT and V2) and the duration of the prepulse (Fig. 19 B for WT) were varied. These data are complementary to the gating current experiments illustrated in Fig. 15, in which we used a range of test voltages, but prepulses to only two voltages.
Figure 19.
Fits of Scheme 3+2′ to WT's and V2's off gating currents after a range of prepulses of different amplitude V p (A) and different duration t p (B). In B, WT's currents were measured after different prepulses to −33 mV that ranged in duration from 30 to 2 ms (bottom to top). The test voltage for all recordings was −93 mV. For WT's currents, the model accounts for the development of a slowly decaying off current with an increase in the amplitude or duration of the prepulse. The model also accounts for V2's faster off current decay kinetics. The arrow on V2's off current after a prepulse to +27 mV in A marks a small inflection in the simulated current that corresponds to a plateau phase. Data from patches w212 and v219 in A, and patch w217 in B.
WT's off gating currents after large and long prepulses that open most channels are characterized by a rising phase and slow decay kinetics, which reflects the kinetics of channel closing (Bezanilla et al., 1994; Zagotta et al., 1994 a). The good fits to the decay of these currents (Fig. 19, A and B) thus corroborate the fits of the tail currents in Fig. 3 A. The good fit to the rising phase indicates that the model correctly accounts for the backward kinetics of the transitions that precede the final two transitions.
After smaller and shorter depolarizations (e.g., after a depolarization to −53 mV), WT's off gating currents are characterized by a mixture of a slowly decaying component that reflects channels in the open state and a rapidly decaying component that reflects channels in earlier states. The model correctly predicts the size of the slow component, thus corroborating the fits of the voltage dependence and kinetics of channel opening in Figs. 17 A and 13 B. The good fits of the fast decaying component provide additional evidence that the model correctly accounts for the backward kinetics of early transitions.
Scheme 3+2′ also performs well at accounting for the kinetics of V2's off gating currents after prepulses (Fig. 19 A). The good fits of V2's off currents after voltage steps that are below V2's activation voltages (V < +7 mV) indicate that Scheme 3+2′ accounts for the backward kinetics away from a broad range of starting states before the open state. The good fits of V2's off currents after large depolarizations that open V2 channels (e.g., +27 mV) provide further evidence that Scheme 3+2′ accounts for the kinetics of V2's transitions nearest the open state.
discussion
In this paper we have developed an activation gating model for Shaker potassium channels that can describe a wide range of data obtained from the WT and V2 Shaker channels. In our model (for Scheme 3+2′), each of Shaker's four subunits undergo three transitions in sequence; the channel opens after two additional transitions that presumably reflect the concerted action of Shaker's four subunits: 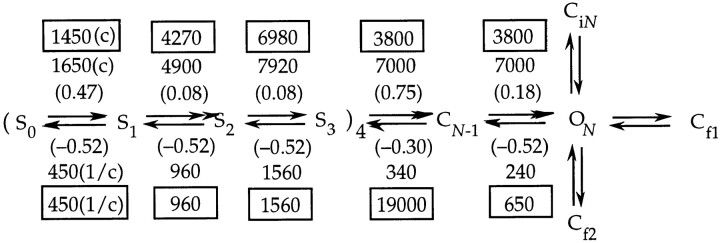 (model 3+2′)
Rate constants (at 0 mV) are indicated for both WT and V2 channels; the rates for V2 are delineated by rectangles. The partial charges associated with each of the forward and backward rates are in parentheses.
Scheme 3+2′ is a very well-constrained model. The data we have modeled included measurements made with voltage protocols that employ prepulses that preload channels into various distributions of states, which give test current time courses that reflect different subsets of transitions. We have also included data obtained for the mutant V2 channel, which uniquely constrain certain features of the model, such as the amount of charge associated with the final two transitions. Starting estimates of parameters, obtained by fitting exponentials to selected current time courses, were available for all of the transitions in Scheme 3+2′ except S2 ↔ S3. The similarity in the estimates subsequently obtained by fitting the entire model to the data supports the idea that particular types of current measurements can constrain each of the parameters describing individual gating transitions. Scheme 3+2′ is also a robust model. The simulations show that Scheme 3+2′ is able to account qualitatively for all of the features of the data that were modeled, with only minor discrepancies (see below). Finally, Scheme 3+2′ is a relatively unique model. After the general strategy employed by Zagotta et al. (1994 b), we systematically considered models of increasing complexity, in the process ruling out certain classes of models, including all of the schemes shown in Fig. 2 except Scheme 3+2. Our final model, Scheme 3+2′, is certainly not the only model that can account for all of the data, but it is better than these other models. With a reliable functional kinetic model in hand, we can begin to ask detailed questions about the physical basis of gating in Shaker channels.
Properties of Scheme 3+2′
In the following, we point out a number of properties of Scheme 3+2′, briefly citing the data that are the most important for constraining them.
(A) The sum of the charges for each of the transitions in Scheme 3+2′ yields a total gating charge q = 10.8 e0. This value for q is required to account for WT's voltage dependence of P o at low P o (Fig. 17 B). This estimate of q is somewhat smaller than the model-independent estimate of q ≈ 13 e0 that has been obtained from measurements of the absolute charge movement per channel (Schoppa et al., 1992; Aggarwal and MacKinnon, 1996; Seoh et al., 1996) and from the voltage dependence of channel open probability (Zagotta et al., 1994 a; Seoh et al., 1996). Evidence from our modeling also suggests that the total charge is likely to be larger than 10.8 e0. Scheme 3+2′ slightly underestimates the steepness of WT's voltage dependence of P o at low P o (Fig. 11 B), which could be accounted for by adding more charge to the model.
(B) A count of the number of transitions in Scheme 3+2′ indicates that a channel that begins in the first closed state undergoes 14 transitions to the open state, and each of the transitions is associated with the movement of a small amount of charge (0.6–1 e0). Small partial charges are required to account for the shallow voltage dependences of kinetic features at extreme voltages (Figs. 13–16). Given the small partial charges, a large number of transitions is required to achieve a sufficiently large total gating charge.
(C) An activating channel in Scheme 3+2′ undergoes two fundamentally different types of transitions before it opens. The first 12 transitions in Scheme 3+2′ correspond to transitions occurring in each of Shaker's four subunits, while the last two transitions are distinct and are taken to reflect the concerted movement of the four subunits. The presence of the subunit transitions with equivalent rates allows the required large number of transitions while greatly reducing the number of parameters that need to be constrained in the modeling; the last two transitions have kinetic properties that suggest that they are fundamentally different from the subunit transitions. Further tests of whether the different transitions reflect subunit transitions or concerted transitions could use different types of mutant channels. Preliminary data from tandem concatemeric constructs of WT and A2 channels (having the L382A mutation) are consistent with the final steps being concerted ones (Lin et al., 1994).
(D) The rates of the second and third subunit transitions (the intermediate transitions) are several times faster than the rates for the first subunit transition, except at very large depolarizations (V > +80 mV). Faster forward rates for intermediate transitions help account for the rising phase in the on gating current time course (Fig. 14). The most direct evidence for fast intermediate backward rates comes from V2's off gating currents, which, after intermediate depolarizations, display a fast component at some test voltages (Fig. 15 B).
(E) A small cooperative interaction between subunits (corresponding to c = 1.3 in Scheme I) has been included in S0 ↔ S1 to help account for the rising phase in the on gating currents (Fig. 7). This amount of interaction reflects a small deviation from independence, especially when compared with the large interactions (c = 6) in the model of Tytgat and Hess (1992) proposed for the mammalian Shaker (rKv1.1) channel. It should be kept in mind that we started from the assumption that subunit transitions occur independently. In the detailed modeling, we found no compelling reason to include more than a small interaction; indeed, the inclusion of larger interactions of the form depicted in Scheme I yielded poor fits of gating current time courses (Fig. 7 D).
(F) The final two transitions are associated with a charge movement of 1.8 e0. This value is constrained by data from the V2 channel: its P o -V relation (Fig. 5 B) has a steepness that corresponds to ∼2 e0 and its q-V relation displays a distinct component 2 e0 in magnitude at depolarized voltages.
(G) The final transitions confer functional cooperativity. In Scheme 3+2′, the final two transitions have backward rates (βN-1 and βN) that are much slower than those of the preceding transitions. The specific values for the rates are constrained by tail currents at very hyperpolarized voltages and by reactivation time courses (Fig. 3). Small backward rates for the last two transitions also account for the presence of a rising phase and the slow decay of off gating currents after large, long depolarizations (Fig. 19).
The most interesting implication of slow final backward rates occurs at intermediate voltages. Small backward rates give the last two transitions (and especially the final transition) values for their equilibrium constants at these voltages that are substantially larger than for earlier transitions. At WT's midpoint activation voltage (−48 mV), the equilibrium for CN-1 ↔ ON is 7.8, which compares to values of 1, 1.6, 1.6, and 2.8 for S0 ↔ S1, S1 ↔ S2, S2 ↔ S3, and CN-2 ↔ CN-1, respectively. The final two favorable transitions drive channel opening to occur with a steep voltage dependence (Fig. 17 A), in effect inducing cooperativity in the subunit charge movements. The same process results in WT's slow and nonsigmoidal kinetics of activation at intermediate voltages (Fig. 13).
(H) Scheme 3+2′ also includes transitions to three states (Cf1, Cf2, and CiN) that are not in the activation path. These transitions account for additional closed-time components in Shaker's single channel behavior at large depolarizations (Fig. 4) and account for the shape of WT and V2's P o -V relation at depolarized voltages (Fig. 5).
Discrepancies in the Predictions of Scheme 3+2′
There are several discrepancies in the fits of Scheme 3+2′, which suggest strategies for future improvements in the modeling.
The most important discrepancy occurs in the fits of the kinetic data at hyperpolarized voltages, in particular the reactivation time courses as shown in Fig. 16. For the most negative hyperpolarizing prepulses, the model predicts a delay in the subsequent reactivation time course that is too long. This discrepancy indicates that the backward rates of the early and intermediate transitions are too large at very negative voltages; that is, backward rates are too voltage dependent. This arises from a compromise in the modeling. As a way to constrain the ambiguously defined third subunit transition S2 ↔ S3, we assigned S2 ↔ S3 to have the same charges as S1 ↔ S2, and then introduced a small increase in the charges for each of the subunit transitions. A better model might make the charge for S2 ↔ S3 larger than that for S1 ↔ S2. Alternatively, there could be even more transitions than in Scheme 3+2′.
A second discrepancy is in the fits of the Q-V relation at hyperpolarized voltages. The simulations in Fig. 17 B indicate that Scheme 3+2′ is able to account for these data quite well, but these good fits reflect the assigned small increase in the charge for S0 ↔ S1, which, as just described, has detrimental effects on the fits of the kinetics. One solution that could simultaneously account for the Q-V relation and kinetics would be to increase the magnitude of cooperative interactions in this first subunit transition. The time course of the on gating currents restricts the amount of interaction that can be conferred on the forward rate constant, but there is more freedom for interactions that affect the reverse rate constant.
Two further discrepancies concern our characterization of the transitions to states that are not in the activation path. Scheme 3+2′ fails to predict two discernible rapid components that are present in the closed dwell-time distributions at depolarized voltages (Fig. 4). These components might be better accounted for if the rates f 1 and f 2 were more disparate than the values assigned. The basic version of Scheme 3+2′, which lacks transitions to Ci states from closed states, also fails to account for a slow component in the activation time course at large depolarized voltages (the simulations of activation time courses of this version of Scheme 3+2′ superimpose with the simulations of Scheme 2+2′ in Fig. 7 A). In this paper, we have demonstrated one plausible way of incorporating these additional transitions into the scheme (Figs. 8 and 13); in the modified model, an additional state CiN-1 can be entered from the last closed state. However, a proper characterization of the transitions into Ci states will require additional experimental constraints.
Generally, to obtain a better kinetic model that can account for these discrepancies in a well-constrained way, it would be useful to model other types of data. These would include measurements of gating current fluctuations (Crouzy and Sigworth, 1993; Sigg et al., 1994), and the analysis of rapid gating events, for example by the use of hidden Markov techniques (Venkataramanan, L., R. Kuc, and F.J. Sigworth, manuscript submitted for publication). Also, in the same way that we have used V2 here, current measurements from other mutant Shaker channels (Lopez et al., 1991; McCormack et al., 1991; Papazian et al., 1991; Perozo et al., 1994) may be used to help constrain the properties of particular transitions in the model.
Functional Effects of the V2 Mutation
On the basis of the assumption that the V2 mutation changes activation energies but not charge movements in the various transitions (Schoppa and Sigworth, 1998b ), we have incorporated data from the V2 channel to better constrain features of the model. The model accounts well for V2 channel behavior and provides insight into the functional effects of the mutation.
A comparison of WT and V2 parameters for Scheme 3+2′ shows that V2 has virtually no effect on the rates of the subunit transitions. Similar forward rates account for V2's similar channel opening time courses (at V ≥ +67 mV) and on gating currents (Figs. 13 and 14). Similar reverse rates account for V2's similar off gating currents at hyperpolarized voltages after small or intermediate amplitude depolarizations (Fig. 15). Similar equilibria for the subunit transitions account for the fact that V2 causes little voltage shift in most of the charge in the Q-V relation (Fig. 17 A) and little voltage shift in the relationship between prepulse voltage and the delay in channel opening (Fig. 18 C). For the subunit transitions, V2's forward rates are 15% smaller than WT's, which accounts for V2's slightly slower channel opening time course (reflected in the τa and δa values in Fig. 13 C).
In contrast to its small effects on the subunit transitions, V2 has substantial effects on the rates of the final concerted transitions. In V2 channels, the rates αN-1, αN, and βN, are changed 2–3-fold, while the backward rate βN-1 of the pentultimate transition is increased 56-fold. The large increase in βN-1 accounts for nearly all of the qualitative differences between WT's and V2's behavior, which we will outline here.
As outlined in the previous paper (Schoppa and Sigworth, 1998b ), two of V2's main kinetic effects are to accelerate the tail current and off gating current decay (Figs. 3 and 19), and to slow the channel opening time course (Fig. 7 B). An increase in βN-1 accelerates the deactivation time course by decreasing the channel reopening rate. The increase in βN-1 slows V2's channel opening time course by a similar mechanism: a large βN-1 decreases the rate at which an opening channel in the last closed state precedes into the open state. One other kinetic effect of V2 is to change the channel opening time course at the activation voltages from nonsigmoidal to sigmoidal. This can be understood from the fact that the V2 mutation disrupts the functionally cooperative mechanism of channel opening that is present for the normally activating Shaker channel, as described below.
The shift in the voltage dependence of V2's equilibrium P o and a component of charge in its Q-V relation (Fig. 17 A) both directly result from the 150-fold reduction in the equilibrium of the second to last transition. The reduction in the voltage sensitivity of charge movement (Fig. 13 A) can be explained by considering the equilibrium constants of V2's transitions at −48 mV (WT's activation midpoint voltage). The equilibrium constants for the transitions S0 ↔ S1, S1 ↔ S2, S2 ↔ S3, CN-2 ↔ CN-1, and CN-1 ↔ ON are 0.9, 1.4, 1.4, 0.03, and 1.6, respectively. The very small equilibrium of the second to last transition blocks the cooperative effect that steepens WT's Q-V relation, causing V2's charge movement to occur across a broader voltage range. Similarly, the reduction in the voltage sensitivity in P o can be explained by considering the equilibrium constants at V2's activation midpoint voltage (+15 mV), which are 10, 6, 6, 0.4, and 9. At this voltage, the early transitions are already favorable for V2; they contribute little to the voltage dependence of P o since they do not move in a functionally cooperative fashion as they do for WT.
The ability of Scheme 3+2′ to account for all V2's data with effects that are essentially limited to the final two transitions has one important mechanistic implication. It supports the idea that the last two transitions are in some way distinct from the earlier transitions (Schoppa and Sigworth, 1998a ) and arise from different structural changes.
Comparison of Scheme 3+2′ to Other Activation Gating Models for Shaker Channels
We next compare Scheme 3+2′ to other published models that have been proposed for Shaker or Shaker-like channels. Most of the published models fall into the classes of models depicted in Fig. 2. These include (a) models like Scheme 1+0 (Koren et al., 1990; Zagotta et al., 1990; Tytgat and Hess, 1992); (b) models like Scheme 1+1 (Schoppa et al., 1992; McCormack et al., 1994); and (c) a model like Scheme 2+0 (Zagotta et al., 1994 b). One additional model not depicted in Fig. 2 has the opening channel undergo seven sequential transitions (Bezanilla et al., 1994). Most of the models that have been proposed can be ruled out by the criteria that were outlined in Stage I of the modeling in this paper. With the exception of the model of Bezanilla et al. (1994), all of the proposed models have either an inadequate number of transitions (fewer than seven) or an inadequate number of types of transitions that are distinguished by their partial charges (fewer than three).
The most fundamental difference between Scheme 3+2′ and the other published models is its smaller partial charges. The voltage sensitivities of the kinetic data at voltage extremes constrain the charge movements accompanying transitions in Scheme 3+2′ to the range 0.6–1.05 e0. The charge values assigned to transitions in the other models are generally larger, ranging from 1.2 to 2.3 e0. Simulations such as those illustrated in Fig. 10 C show that such models with larger charges cannot account for kinetic data at voltage extremes. Also, because of its smaller individual transition charges, Scheme 3+2′ is required to have many more gating transitions than other models to account for the steep voltage sensitivity of gating at intermediate voltages. Stripped of the various closed states not in the activation pathway, the resulting Scheme 3+2 has a total of 37 states. However, because of the high degree of symmetry and some simplifying assumptions about relationships between rate constants, the rate constants and partial charges in the scheme are determined by only 16 free parameters.
In the next two sections, we compare Scheme 3+2′ to two of the most detailed models that have been proposed for Shaker activation gating. These models were shown to account for activation, deactivation, and gating current time courses at many voltages.
Comparison of Scheme 3+2′ with the ZHA Model
The first model to be compared with Scheme 3+2′ is one proposed by Zagotta et al. (1994
b): 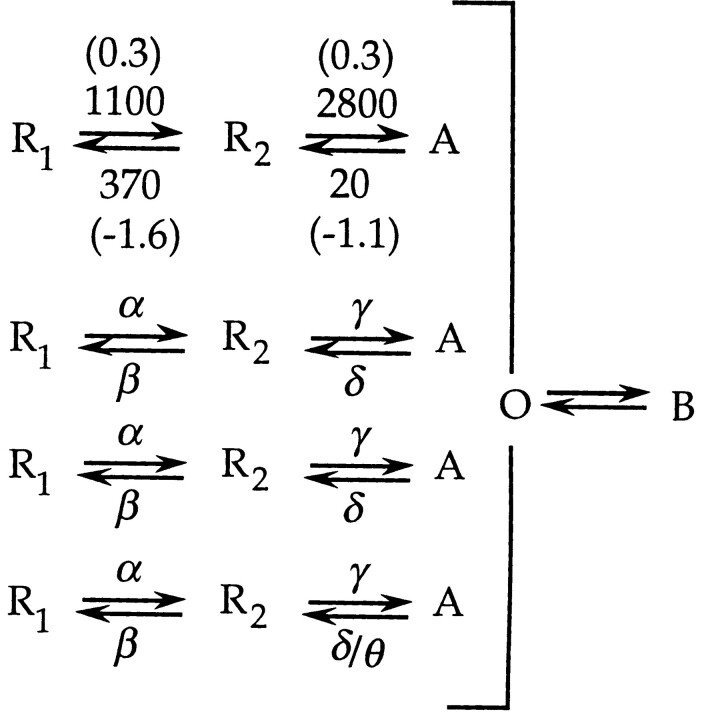 (model zha)
Strictly speaking, this model belongs to the Scheme 2+0 class, where the configuration of all four subunits being in the active (A)-state corresponds to the channel-open state. It has one important modification: for a deactivating channel, the rate at which the first subunit moves from the A to the R2 state is slowed by a factor Θ = 10 compared with the rates δ of the other subunits. This property for the final transition makes Model ZHA behave functionally more like a model of the class of Scheme 2+1, with subunit independence and a forward-biased final concerted step, than a Scheme 2+0 model with subunit independence. The values for the rates at 0 mV (in s−1) and partial charges (in parentheses, units of e0) are indicated. For the activation pathway (i.e., excluding the closed state B), this model has nine free parameters.
General architecture.
The development of Model ZHA was based on the same presuppositions as ours, invoking a fourfold kinetic symmetry to explain the existence of a large number of transitions having similar rates and voltage dependences, while minimizing the number of free parameters. It differs from Scheme 3+2′ in that it has only two subunit transitions and lacks the two final concerted transitions.
Subunit transitions.
For the forward rates, the largest difference is in the partial charges of the intermediate transitions; the charges q a2 and q a3 = 0.09 e0 in Scheme 3+2′ are one-third the size of q γ = 0.3 e0 in ZHA. In Scheme 3+2′, small values for q a2 and q a3 are required to account for the very shallow voltage sensitivity of channel opening at very large depolarizations, up to +147 mV. Zagotta et al. (1994 b) modeled activation time courses only up to +50 mV.
For the backward rates of subunit transitions, the rates assigned to intermediate transitions differ by a factor of ∼50 (the rates b 2(0) = 960 s−1 and b 3(0) = 1,560 s−1 in Scheme 3+2′, compare with δ(0) = 20 s−1 in Model ZHA). Our rationale for making the backward rates rapid includes the presence of a rapid component in V2's off gating current. Large differences also exist in the partial charges of the backward rates. The ZHA values (q β = −1.6 e0, q γ = −1.1 e0) are two to three times larger than those in Scheme 3+2′ (q b1, q b2, q b3 = −0.52 e0). Small partial charges in Scheme 3+2′ are required to account for the kinetics of the gating currents and reactivation time courses measured employing extremely hyperpolarized voltages, down to −193 mV; Zagotta et al. (1994 b) considered data that reflect the subunit transitions only down to −100 mV. Simulations of Model ZHA with a deactivating pulse voltage V h = −193 mV show a time course for the accumulation of the reactivation delay that is 25-fold faster than observed. It should be pointed out that Scheme 3+2′ still seems to have partial charges that are too large, predicting a time course that is too rapid by a factor of four at this voltage.
Scheme 3+2′ includes a small positively cooperative interaction for the first subunit transition to help account for the on gating currents. On the other hand, Zagotta et al. (1994 b) found that a negative interaction among subunits helps to describe the shallow voltage dependence in the relationship between different prepulse voltages and the activation delay. Scheme 3+2′ accounts for this voltage dependence (Fig. 18 C) through smaller charge movements.
Transitions near the open state.
Scheme 3+2′ and ZHA are similar in that they both assign reverse rates for the final transition(s) that are slower than those in preceding transitions. Slow reverse rates account for the slow channel deactivation. ZHA accounts for the slow deactivation by making the explicit channel closing rate very slow (the rate at which the first subunit undergoes R2 ← A). Scheme 3+2′ makes channel deactivation slow by the combined action of the final two transitions, due to a moderately slow explicit channel closing rate βN, and a very high reopening frequency from CN-1. Evidence that favors our two-transition explanation for the slow channel deactivation includes the non–single-exponential tail current decay time course (Schoppa and Sigworth, 1998a ), and also channel reactivation time courses, which constrain αN to be large and βN-1 to be small. Zagotta et al. (1994 b) model both reactivation and tail current time courses, but not those measured at the very extreme voltages (down to −203 mV), which are the most important in constraining these transitions.
The different kinetic explanations for the slow channel closing could have important physical implications. Zagotta and co-workers (1994a, 1994b) speculate that the rate for the first closing subunit may be slowed compared with other subunits due to the special properties of the channel open state. For example, permeating ions bound to a site in the permeation path in the open channel could slow channel closing (Swenson and Armstrong, 1981; Sala and Matteson, 1991; Shapiro and DeCoursey, 1991; Zagotta et al., 1994 a). On the other hand, our explanation that a high reopening rate is largely responsible for slow deactivation implies that it is not the open channel per se that is special. Slow deactivation may, instead, reflect the special properties of the last closed state.
Transitions to states that are not in the activation path.
Both Scheme 3+2′ and Model ZHA include at least one transition to a closed state outside the activation path. The transition to B in ZHA corresponds to Cf1 in our model. We find that transitions to a second closed state Cf2 accounts for a brief component in the closed dwell-time histograms at depolarized voltages, and also for the fact that P o saturates at a value of 0.9 rather than 1(Fig. 5 A). After Zagotta et al., we invoke a class of intermediate closed states Ci to account for another closed-time component.
In conclusion, it should be kept in mind that all kinetic modeling is by nature approximate. Model ZHA is a simpler model with fewer parameters that could be viewed as an approximation to our more detailed Scheme 3+2′. It leads to different conclusions about the number and sizes of gating charge movements, but well describes Shaker channel behavior over the physiological voltage range.
Comparison of Scheme 3+2′ to Model BPSS
The second model that we consider in some detail is the model proposed by Bezanilla et al. (1994): (model bpss)
In this model, the channel opens after undergoing seven sequential transitions, with the indicated forward and backward rates and partial charges. The rate constants and partial charges represent a total of 20 free parameters. In the discussion of the model, the authors speculate that the first four transitions could reflect transitions occurring in each of Shaker's four subunits, while the last three would be concerted transitions. We will assume this description here.
General architecture.
Scheme 3+2′ has three subunit transitions, but Model BPSS has only one such transition. The larger number of subunit transitions in Scheme 3+2′ arose as a consequence of the smaller transition charges, which, again, are constrained by the kinetics at extreme voltages. Model BPSS includes a number of concerted transitions, like Scheme 3+2′, but their properties are quite different.
Subunit transitions.
The two models have similar forward rates for the very first transition (C0 → C1 in Model BPSS and the first subunit undergoing S0 → S1 in Scheme 3+2′), but otherwise there are few similarities in the parameter estimates for the presumed subunit transitions. The most striking difference is in the estimates for the partial charges for the forward rates: except for the very first subunit transition, BPSS incorporates much larger partial charge values (1.0 e0 in Model BPSS vs. q a1 = 0.47 e0 and q a2, q a3 = 0.08 e0 in Scheme 3+2′). As discussed above, small partial charges for forward rates are required to account for the macroscopic ionic current time courses at depolarized voltages. Bezanilla et al. (1994) do not model the ionic current time courses, but, in our simulations, Model BPSS predicts time courses that deviate markedly from what is observed. For example, at +147 mV, BPSS predicts an activation time course with a very short delay (δa = 40 μs) compared with the observed value δa = 250 μs.
In Model BPSS, the assigned values of the forward rates for the first four transitions imply that there are positively cooperative interactions in the subunit transitions; with no cooperativity, the forward rates of these transitions in their sequential representation would become progressively smaller, due to statistical factors. For the type of interaction depicted in Scheme I, the assigned forward rates in BPSS correspond to an average value c = 2.6. Scheme 3+2′ also includes a positive interaction in S0 → S1, but its magnitude is smaller, as required by the kinetics of the gating currents in our measurements (Fig. 7 D).
Transitions near the open state.
BPSS includes a concerted transition in the second to last position in the activation path that has a large valence. As evidence for a large charge movement, Bezanilla et al. (1994) cite the steep component in Shaker's Q-V curve, and the large gating current fluctuations that are observed at intermediate voltages. In contrast, we favor a model that does not incorporate a transition with a large charge movement, on two grounds. The first is that a large valence transition is not required to account for the two properties that Bezanilla et al. (1994) cite. We and Zagotta et al. (1994 b) have shown that models lacking a large- valence transition can account for the steep component of charge in the Q-V relation (Fig. 17 A), if there exists functional cooperativity in the sequence of transitions. Further, it turns out that the large “Stage II” gating-current variance observed by Sigg et al. (1994) at small depolarizations can be explained by rapidly reversible transitions carrying small charge movements. A direct comparison of gating-current fluctuations with the predictions of Scheme 3+2′, however, awaits a later study.
Secondly, we have provided some evidence against a large-valence transition. V2's Q-V relation (Fig. 17 A) lacks the steeply voltage-dependent charge component that is present in WT's Q-V relation. In simulations, we find that a model with a large-valence transition predicts a steeper component of charge than that which is present in V2's Q-V relation (Fig. 12 A). Since V2 does not reduce the total gating charge (Schoppa et al., 1992), we can reasonably assume that V2 does not reduce the charge associated with any single transition. Instead, we believe that V2 reduces the steepness of the Q-V relation by altering the equilibria of the final transitions.
Our detailed analysis of the two transitions that precede channel opening also argues against their containing a large charge movement. From V2's behavior, we conclude that there exists a subset of final gating transitions associated with a combined charge of 2 e0. Given the estimate of ∼0.7 e0 associated with the last transition, the pentultimate transition can be associated with no more than 1.3 e0 of charge.
Transitions to states that are outside of the activation path.
Model BPSS includes no transitions to states outside of the activation path. In Scheme 3+2′, these transitions account for Shaker's single channel data at depolarized voltages, which were not modeled by Bezanilla et al. (1994).
Structural Correlates to Scheme 3+2′
While our data provide no direct structural information, they provide grounds for speculation about the structural changes underlying the various transitions. Given the recent evidence implicating the S4 transmembrane region as the major voltage sensor in activation gating (Yang and Horn, 1995; Yang et al., 1996; Mannuzzu et al., 1996; Larsson et al., 1996), a reasonable hypothesis is that the subunit transitions in Scheme 3+2′ correspond to the movement of S4 in each of Shaker's four subunits. The three subunit transitions in Scheme 3+2′ involve charge movements of 0.99, 0.6, and 0.6 e0, respectively; the main charge movement in activation gating can therefore be pictured as occurring in small steps, involving the transport of one or less than one elementary charge at a time. In view of the triplet repeat motif in S4, one imagines that this region undergoes displacements of three residues at a time to produce pseudoequivalent structures while causing the individual charge movements. These displacements could arise as a stepwise secondary structure change, for example.
The final transitions in Scheme 3+2′ couple the movement of the main voltage sensors to channel opening. The assigned slow backward rates for the final two transitions imply that the last two conformational states CN-1 and ON are uniquely stable. From the effects of agents such as D2O, hyperosmotic solutions, and hydrostatic pressure, previous experimenters have speculated that the final transitions in activation gating correspond to large structural changes in the channel protein that are associated with an increase in the number of bound water molecules (Conti et al., 1984; Alicata et al., 1990; Schauf and Bullock, 1979; Schauf and Chuman, 1986; Zimmerberg et al., 1990; but see Starkus et al., 1995). One stabilizing factor for the last two states could, then, be water-protein interactions, if these are favorable.
The functional effects of the V2 mutation reported here imply that the mutated leucine (L382 in the ShB sequence) is involved in stabilizing the final two states, especially the last closed state CN-1. In a previous study from our laboratory (McCormack et al., 1993), this residue was mutated to a series of different amino acids. The rank order of the effects of the substitutions suggested that the final states are stabilized by specific hydrophobic interactions with the side chain of this residue.
Abbreviation used in this paper
- WT
wild type
references
- Aggarwal SK, MacKinnon R. Contribution of the S4 segment to gating charge in the Shaker K+channel. Neuron. 1996;16:1169–1177. doi: 10.1016/s0896-6273(00)80143-9. [DOI] [PubMed] [Google Scholar]
- Alicata DA, Rayner MD, Starkus JG. Sodium channel activation mechanisms: insights from deuterium oxide substitution. Biophys J. 1990;57:745–758. doi: 10.1016/S0006-3495(90)82595-9. [DOI] [PMC free article] [PubMed] [Google Scholar]
- Bezanilla F, Perozo E, Stefani E. Gating of Shaker K+channels. II. The components of gating currents and a model of channel activation. Biophys J. 1994;66:1011–1021. doi: 10.1016/S0006-3495(94)80882-3. [DOI] [PMC free article] [PubMed] [Google Scholar]
- Cole KS, Moore JW. Potassium ion current in the squid giant axon: dynamic characteristic. Biophys J. 1960;1:1–14. doi: 10.1016/s0006-3495(60)86871-3. [DOI] [PMC free article] [PubMed] [Google Scholar]
- Colquhoun D, Hawkes AG. On the stochastic properties of single ion channels. Proc R Soc Lond B Biol Sci. 1981;211:205–235. doi: 10.1098/rspb.1981.0003. [DOI] [PubMed] [Google Scholar]
- Colquhoun, D., and A.G. Hawkes. 1995. A Q-matrix cookbook: how to write only one program to calculate the single-channel and macroscopic predictions for any kinetic mechanism. In Single-Channel Recording. 2nd ed. B. Sakmann and E. Neher, editors. Plenum Publishing Corp., New York. 589–633.
- Conti F, Inoue I, Kukita F, Stuhmer W. Pressure dependence of sodium gating currents in the squid giant axon. Eur Biophys J. 1984;11:137–147. doi: 10.1007/BF00276629. [DOI] [PubMed] [Google Scholar]
- Crouzy SC, Sigworth FJ. Yet another approach to the dwell-time omission problem of single-channel analysis. Biophys J. 1990;58:731–743. doi: 10.1016/S0006-3495(90)82416-4. [DOI] [PMC free article] [PubMed] [Google Scholar]
- Crouzy SC, Sigworth FJ. Fluctuations in ion channel gating currents. Analysis of nonstationary shot noise. Biophys J. 1993;64:68–76. doi: 10.1016/S0006-3495(93)81341-9. [DOI] [PMC free article] [PubMed] [Google Scholar]
- Hoshi T, Zagotta WN, Aldrich RW. Shakerpotassium channel gating. I. Transitions near the open state. J Gen Physiol. 1994;103:249–278. doi: 10.1085/jgp.103.2.249. [DOI] [PMC free article] [PubMed] [Google Scholar]
- Iverson LE, Rudy B. The role of divergent amino and carboxyl domains on the inactivation properties of potassium channels derived from the Shaker gene of Drosophila. . J Neurosci. 1990;10:2903–2916. doi: 10.1523/JNEUROSCI.10-09-02903.1990. [DOI] [PMC free article] [PubMed] [Google Scholar]
- Kavanaugh MP, Hurst RS, Yakel J, Varnum MD, Adelman JP, North RA. Multiple subunits of a voltage-dependent potassium channel contribute to the binding site for tetraethylammonium. Neuron. 1992;8:493–497. doi: 10.1016/0896-6273(92)90277-k. [DOI] [PubMed] [Google Scholar]
- Koren G, Liman ER, Lohothetis DE, Nadal GB, Hess P. Gating mechanism of a cloned potassium channel expressed in frog oocytes and mammalian cells. Neuron. 1990;4:39–51. doi: 10.1016/0896-6273(90)90442-i. [DOI] [PubMed] [Google Scholar]
- Larsson HP, Baker OS, Dhillon DS, Isacoff EY. Transmembrane movement of the Shaker K+channel S4. Neuron. 1996;16:387–397. doi: 10.1016/s0896-6273(00)80056-2. [DOI] [PubMed] [Google Scholar]
- Li M, Unwin N, Stauffer KA, Jan YN, Jan LY. Images of purified Shakerpotassium channels. Curr Biol. 1994;4:110–115. doi: 10.1016/s0960-9822(94)00026-6. [DOI] [PubMed] [Google Scholar]
- Lin L, McCormack K, Sigworth FJ. Subunit interactions in Shaker K+channel gating. Biophys J. 1994;66:A106. [Google Scholar]
- Lopez GA, Jan YN, Jan LY. Hydrophobic substitution mutations in the S4 sequence alter voltage-dependent gating in Shaker K+channels. Neuron. 1991;7:327–336. doi: 10.1016/0896-6273(91)90271-z. [DOI] [PubMed] [Google Scholar]
- MacKinnon R. Determination of the subunit stoichiometry of a voltage-activated potassium channel. Nature. 1991;350:232–235. doi: 10.1038/350232a0. [DOI] [PubMed] [Google Scholar]
- Mannuzzu LM, Moronne MM, Isacoff EY. Direct physical measure of conformational rearrangement underlying potassium channel gating. Science. 1996;271:213–216. doi: 10.1126/science.271.5246.213. [DOI] [PubMed] [Google Scholar]
- McCormack K, Joiner WJ, Heinemann SH. A characterization of the activating structural rearrangements in voltage-dependent Shaker K+channels. Neuron. 1994;12:301–315. doi: 10.1016/0896-6273(94)90273-9. [DOI] [PubMed] [Google Scholar]
- McCormack K, Lin L, Sigworth FJ. Substitution of a hydrophobic residue alters the conformational stability of Shaker K+channels during gating and assembly. Biophys J. 1993;65:1740–1748. doi: 10.1016/S0006-3495(93)81202-5. [DOI] [PMC free article] [PubMed] [Google Scholar]
- McCormack K, Tanouye MA, Iverson LE, Lin JW, Ramaswami M, McCormack T, Campanelli JT, Mathew MK, Rudy B. A role for hydrophobic residues in the voltage- dependent gating of Shaker K+channels. Proc Natl Acad Sci USA. 1991;88:2931–2935. doi: 10.1073/pnas.88.7.2931. [DOI] [PMC free article] [PubMed] [Google Scholar]
- McManus OB, Magleby KL. Kinetic states and modes of single large-conductance calcium-activated potassium channels in cultured rat skeletal muscle. J Physiol (Camb) 1988;402:79–120. doi: 10.1113/jphysiol.1988.sp017195. [DOI] [PMC free article] [PubMed] [Google Scholar]
- Nelder JA, Mead R. A simplex method for function minimization. Comput J. 1965;7:308–313. [Google Scholar]
- Papazian DM, Timpe LC, Jan YN, Jan LY. Alteration of voltage-dependence of Shakerpotassium channels by mutations in the S4 sequence. Nature. 1991;349:305–310. doi: 10.1038/349305a0. [DOI] [PubMed] [Google Scholar]
- Perozo E, Papazian DM, Weiss RE, Toro L, Stefani E, Bezanilla F. S4 mutations alter gating currents of ShakerK+ channels. Biophys J. 1994;66:345–354. doi: 10.1016/s0006-3495(94)80783-0. [DOI] [PMC free article] [PubMed] [Google Scholar]
- Press, W.H., S.A. Teukolsky, W.T. Vetterling, and B.P. Flannery. 1992. Numerical Recipes, 2nd ed. Cambridge University Press, Cambridge, UK.
- Sala S, Matteson DR. Voltage-dependent slowing of K channel closing kinetics by Rb+ . J Gen Physiol. 1991;98:535–554. doi: 10.1085/jgp.98.3.535. [DOI] [PMC free article] [PubMed] [Google Scholar]
- Schauf CF, Bullock JO. Modifications of sodium channel gating in Myxicolagiant axons by deuterium oxide, temperature, and internal cations. Biophys J. 1979;27:193–208. doi: 10.1016/S0006-3495(79)85211-X. [DOI] [PMC free article] [PubMed] [Google Scholar]
- Schauf, C.F., and M.A. Chuman. 1986. Mechanisms of sodium channel gating revealed by solvent substitution. In Ion Channels in Neural Membranes. M. Ritchie, D.R. Keynes, and L. Bolis, editors. A.R. Liss, New York. 3–23.
- Schoppa NE, McCormack K, Tanuoye MA, Sigworth FJ. Estimate of the total gating charge in Shakerpotassium channels. Science. 1992;255:1712–1715. doi: 10.1126/science.1553560. [DOI] [PubMed] [Google Scholar]
- Schoppa NE, Sigworth FJ. Activation of Shakerpotassium channels. I. Characterization of voltage-dependent transitions. J Gen Physiol. 1998a;111:271–294. doi: 10.1085/jgp.111.2.271. [DOI] [PMC free article] [PubMed] [Google Scholar]
- Schoppa NE, Sigworth FJ. Activation of Shakerpotassium channels. II. Kinetics of the V2 mutant channel. J Gen Physiol. 1998b;111:295–311. doi: 10.1085/jgp.111.2.295. [DOI] [PMC free article] [PubMed] [Google Scholar]
- Seoh S-A, Sigg D, Papazian DM, Bezanilla F. Voltage sensing residues in the S2 and S4 segments of the ShakerK+ Channel. Neuron. 1996;16:1–20. doi: 10.1016/s0896-6273(00)80142-7. [DOI] [PubMed] [Google Scholar]
- Shapiro MS, Decoursey TE. Permeant ion effects on the gating kinetics of the type Lpotassium channel in mouse lymphocytes. J Gen Physiol. 1991;97:1251–1278. doi: 10.1085/jgp.97.6.1251. [DOI] [PMC free article] [PubMed] [Google Scholar]
- Sigg D, Bezanilla F. Total charge movement per channel. The relation between gating charge displacement and the voltage sensitivity of activation. J Gen Physiol. 1997;109:27–39. doi: 10.1085/jgp.109.1.27. [DOI] [PMC free article] [PubMed] [Google Scholar]
- Sigg D, Stefani E, Bezanilla F. Gating current noise produced by elementary transitions in Shakerpotassium channels. Science. 1994;264:578–582. doi: 10.1126/science.8160016. [DOI] [PubMed] [Google Scholar]
- Starkus JG, Schlief T, Rayner MD, Heinemann SH. Unilateral exposure of ShakerB potassium channels to hyperosmolar solutions. Biophys J. 1995;69:860–872. doi: 10.1016/S0006-3495(95)79960-X. [DOI] [PMC free article] [PubMed] [Google Scholar]
- Swenson RP, Jr, Armstrong CM. K+ channels close more slowly in the presence of external K+ and Rb+ . Nature. 1981;291:427–429. doi: 10.1038/291427a0. [DOI] [PubMed] [Google Scholar]
- Tanabe T, Adams BA, Numa S, Beam KG. Repeat I of the dihydropyridine receptor is critical in determining calcium channel activation kinetics. Nature. 1991;352:800–803. doi: 10.1038/352800a0. [DOI] [PubMed] [Google Scholar]
- Tytgat J, Hess P. Evidence for cooperative interactions in potassium channel gating. Nature. 1992;359:420–423. doi: 10.1038/359420a0. [DOI] [PubMed] [Google Scholar]
- Vandenburg CA, Bezanilla F. A sodium channel gating model based on single channel, macroscopic ionic, and gating currents in the squid giant axon. Biophys J. 1991;60:1511–1533. doi: 10.1016/S0006-3495(91)82186-5. [DOI] [PMC free article] [PubMed] [Google Scholar]
- Yang N, George ALJ, Horn R. Molecular basis of charge movement in voltage-gated sodium channels. Neuron. 1996;16:113–122. doi: 10.1016/s0896-6273(00)80028-8. [DOI] [PubMed] [Google Scholar]
- Yang N, Horn R. Evidence for voltage-dependent S4 movement in sodium channels. Neuron. 1995;15:213–218. doi: 10.1016/0896-6273(95)90078-0. [DOI] [PubMed] [Google Scholar]
- Zagotta WN, Aldrich RW. Voltage-dependent gating of Shaker A-type potassium channels in Drosophilamuscle. J Gen Physiol. 1990;95:29–60. doi: 10.1085/jgp.95.1.29. [DOI] [PMC free article] [PubMed] [Google Scholar]
- Zagotta WN, Hoshi T, Aldrich RW. b. Shakerpotassium channel gating. III. Evaluation of kinetic models for activation. J Gen Physiol. 1994;103:321–362. doi: 10.1085/jgp.103.2.321. [DOI] [PMC free article] [PubMed] [Google Scholar]
- Zagotta WN, Hoshi T, Dittman J, Aldrich RW. a. Shakerpotassium channel gating. II. Transitions in the activation pathway. J Gen Physiol. 1994;103:279–319. doi: 10.1085/jgp.103.2.279. [DOI] [PMC free article] [PubMed] [Google Scholar]
- Zimmerberg J, Bezanilla F, Parsegian VA. Solute inaccessible aqueous volume changes during opening of the potassium channel of the squid giant axon. Biophys J. 1990;57:1049–1064. doi: 10.1016/S0006-3495(90)82623-0. [DOI] [PMC free article] [PubMed] [Google Scholar]


