Abstract
The modulation by internal free [Mg2+] of spontaneous calcium release events (Ca2+ “sparks”) from the sarcoplasmic reticulum (SR) was studied in depolarized notched frog skeletal muscle fibers using a laser scanning confocal microscope in line-scan mode (x vs. t). Over the range of [Mg2+] from 0.13 to 1.86 mM, decreasing the [Mg2+] induced an increase in the frequency of calcium release events in proportion to [Mg2+]−1.6. The change of event frequency was not due to changes in [Mg-ATP] or [ATP]. Analysis of individual SR calcium release event properties showed that the variation in event frequency induced by the change of [Mg2+] was not accompanied by any changes in the spatiotemporal spread (i.e., spatial half width or temporal half duration) of Ca2+ sparks. The increase in event frequency also had no effect on the distribution of event amplitudes. Finally, the rise time of calcium sparks was independent of the [Mg2+], indicating that the open time of the SR channel or channels underlying spontaneous calcium release events was not altered by [Mg2+] over the range tested. These results suggest that in resting skeletal fibers, [Mg2+] modulates the SR calcium release channel opening frequency by modifying the average closed time of the channel without altering the open time. A kinetic reaction scheme consistent with our results and those of bilayer and SR vesicle experiments indicates that physiological levels of resting Mg2+ may inhibit channel opening by occupying the site for calcium activation of the SR calcium release channel.
Keywords: excitation–contraction coupling, Ca sparks, ryanodine receptor, magnesium, confocal microscopy
introduction
During excitation–contraction coupling of skeletal muscle, depolarization of the transverse tubule membrane results in the activation of the dihydropyridine receptor voltage sensors, which cause the opening of the ryanodine receptor (RyR)1 calcium channels, located in the sarcoplasmic reticulum (SR) (see Schneider, 1994, for references). The subsequent elevation of intracellular calcium arises from the summation of localized discrete SR calcium release events, or calcium sparks (Tsugorka et al., 1995; Klein et al., 1996; Schneider and Klein, 1996). In a recent study, we showed that the average properties of individual SR calcium release events are independent of membrane potential (Lacampagne et al., 1996), suggesting that the global calcium transient and the rate of release is modulated by a change in the frequency of SR calcium release event occurrence (Klein et al., 1997). As in cardiac cells (Cheng et al., 1993), “spontaneous” SR calcium release events also have been described to occur in skeletal muscle at a very low frequency independently of activation of the voltage sensor (Klein et al., 1996). From that study, it was proposed that spontaneous events presumably result from the activation of SR calcium release channels by calcium-induced calcium release (Klein et al., 1996).
Mg2+ ions have been shown to suppress SR calcium release in a variety of skeletal muscle preparations. In mechanically skinned frog or toad skeletal fibers, spontaneous contractions produced by reducing [Mg2+] in the bathing solution have been described (Herrmann-Frank, 1989; Lamb and Stephenson, 1991). In these preparations, much of the release of calcium from the SR may have been due to activation of voltage sensors due to the polarization of sealed transverse tubules (TT). From their experiments, Lamb and Stephenson (1991) suggested that magnesium, in the physiological range, inhibits the SR calcium channel and that activation of the voltage sensor by TT membrane depolarization can reduce the affinity of the channel for Mg2+. Lamb and Stephenson (1994) found a comparable modulatory effect of magnesium ions on mammalian and frog skeletal fibers. In frog skeletal muscle fibers, Jacquemond and Schneider (1992b) showed that lowering the concentration of internal Mg2+ potentiated calcium release from the SR during depolarization of voltage-clamped frog fibers. Contraction of the fiber was also observed just after reducing the [Mg2+] in the end pool solution (Jacquemond and Schneider 1992a ), reflecting a spontaneous release of calcium.
Single channel studies of the cardiac or skeletal SR calcium channels incorporated in bilayers have clearly demonstrated modulation of channel activity by magnesium ions (Meissner, 1986; Smith et al., 1986; Rousseau et al., 1992; Xu et al., 1996; Herrmann-Frank et al., 1996; Laver et al., 1997). From these studies, it has been proposed that Mg2+ can inhibit SR calcium release channels by at least three different mechanisms: (a) inhibition of calcium-induced calcium release by competition with Ca2+ for the calcium activation site, (b) binding to a low affinity inhibitory site responsible for inactivation of the channel, and (c) direct blockade of channel conduction (see Meissner, 1994, for review). Laver and Curtis (1996) found that magnesium changed the open probability of SR calcium channels in bilayers rather than the number of available channels or their conductance. More recently, Laver et al. (1997) found that Mg2+ inhibits SR calcium channels incorporated in bilayers by two different and independent mechanisms, either by binding to a higher affinity site (type I), at which Ca2+ binding activates the channel and Mg2+ binding prevents such Ca2+ binding and channel activation, and a lower affinity site (type II), which can bind Mg2+ or Ca2+ with equal affinity and at which either ion inactivates the channels.
In the present study, we have investigated the effect of changes in the concentration of intracellular free [Mg2+] on spontaneous SR calcium release events in depolarized, notched frog skeletal muscle fibers using laser scanning confocal microscopy. We found that a decrease in [Mg2+] results in an increase in the frequency of spontaneous SR calcium release events, without effect on the individual event properties, suggesting that magnesium ions affect the SR calcium channel by modulating the closed time of the channel.
methods
Preparation of Skeletal Muscle Fibers
Frogs (Rana pipiens) were killed by decapitation and spinal cord destruction. The ileofibularis muscle was removed and pinned in a dissecting chamber containing Ringer's solution. The Ringer's solution was changed to a relaxing solution containing (mM): 120 K-glutamate, 2 MgCl2, 0.1 EGTA, 5 Na-tris-maleate, pH 7.00, and single fibers were manually dissected. Small fiber segments (3–5 mm) were cut and transferred to an experimental chamber (see Fig. 1 A) designed for an inverted microscope and containing the same relaxing solution. The fibers were stretched (3.5 ± 0.1 μm per sarcomere) and pushed down against the coverslip floor of the chamber at both ends using two small metal clamps, coated with a silicone sealant, as shown in Fig. 1, A and C. The relaxing solution in the chamber was then changed to an internal solution containing (mM): 80 Cs-glutamate, 20 creatine phosphate, 4.5 Na-tris-maleate, 13.2 Cs-tris-maleate, 5 glucose, 0.1 EGTA, 1 DTT, 0.05 fluo-3 (pentapotassium salt), and various amounts of Na2-ATP and MgCl2, pH 7.00. The concentrations of MgCl2 and Na2-ATP are given in Table I. ATP and Mg2+ were added to the solution last, and then the pH was adjusted to 7.00. The concentrations of free Mg2+ and ATP in each solution were calculated (see Table I) assuming that ATP and phosphocreatine were the major buffers of Mg2+ in our solutions, with K ds of 0.1 and 25 mM, respectively (O'Sullivan and Perrin, 1964). The calculated solution [Mg2+] was confirmed in vitro with a spectrofluorometer (Aminco-Bowman, Rochester, NY) using 5 μM mag-fura-2 (Molecular Probes, Inc., Eugene, OR) as indicator and the ratio of fluorescence emission (at 500 nm) for excitation at 380 ([Mg2+]-sensitive wavelength) and 350 ([Mg2+]-insensitive wavelength) nm. The affinity of Mg2+ for mag-fura-2 was first calibrated in an ATP and phosphocreatine-free solution, giving a K d of 4.1 mM. For each experimental solution (Table I), the measured [Mg2+] was similar to the value determined from a calibration curve. Also, the three solutions containing various total [ATP] exhibited virtually identical free [Mg2+] (0.25 mM), as expected from the calculation (see Table I).
Figure 1.
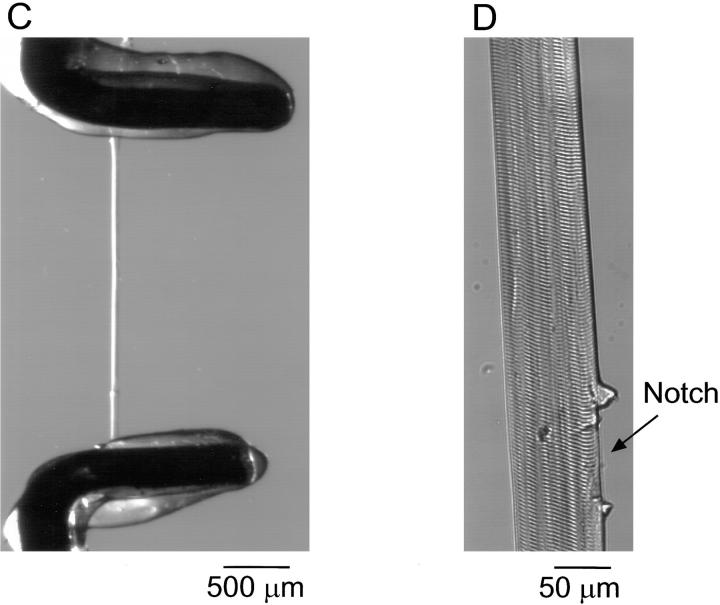
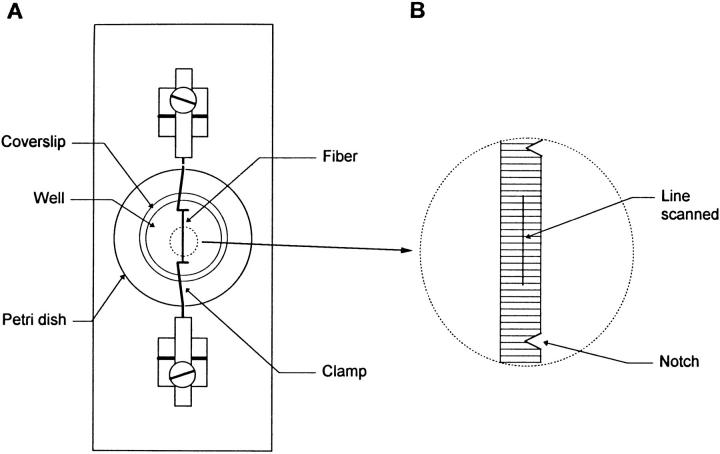
(A) Schematic diagram of the experimental chamber. A plexiglas plate was drilled to support a plastic Petri dish. A coverslip was glued across the bottom of the drilled Petri dish. A segment of skeletal muscle fiber was pressed against this coverslip at both ends by clamps present in the chamber. (B) Expanded schematic diagram of the fiber stretched and clamped to the coverslip. To allow diffusion of the solution from the external medium to the fiber interior, the membrane was notched at several locations with a needle. The distance between two notches was ∼1–1.5 mm and the fluorescence line-scan measurement was performed between notches as indicated by the straight line on the fiber. (C) Bright-field image, at low magnification, of the fiber in the chamber. The two metal clamps used to press the fiber against the coverslip are coated with a silicone sealant. (D) The fiber image at higher magnification showing the notch in the membrane allowing the diffusion of solution into the fiber and the maintained structure of the fiber region adjacent to the notch from which measurements were made.
Table I.
Calculated Concentrations of Mg2+, ATP, and Mg-ATP
| Concentration | ||||||||
|---|---|---|---|---|---|---|---|---|
| Mg2+ tot | ATPtot | Mg2+ free | ATPfree | Mg-ATP | ||||
| mM | mM | mM | mM | mM | ||||
| 3.00 | 5.00 | 0.13 | 2.23 | 2.77 | ||||
| 3.50 | 5.00 | 0.18 | 1.82 | 3.18 | ||||
| 4.79 | 5.00 | 0.42 | 0.96 | 4.34 | ||||
| 5.50 | 5.00 | 0.65 | 0.66 | 4.34 | ||||
| 6.73 | 5.00 | 1.20 | 0.38 | 4.62 | ||||
| 8.00 | 5.00 | 1.87 | 0.25 | 4.75 | ||||
| 2.23 | 2.50 | 0.25 | 0.71 | 1.79 | ||||
| 4.00 | 5.00 | 0.25 | 1.44 | 3.56 | ||||
| 7.60 | 10.00 | 0.25 | 2.85 | 7.15 | ||||
Estimation of [Mg2+], [ATP], and [Mg-ATP] in our solutions (pH 7.00), from the total added Mg2+ and ATP, assuming a binding of magnesium to ATP with a KdMg-ATP = 0.1 mM and binding of Mg2+ to Phosphocreatine with a KdMgPCr = 25 mM. (top) The total [Mg2+] was changed with the total [ATP] constant. (bottom) The total [ATP] was changed with a constant [Mg2+] of 0.25 mM.
The fibers were notched (see Fig. 1, B and D) with a hypodermic needle (30G1/2; Becton Dickinson & Co., Mountain View, CA) to allow entry of solution into the fiber by diffusion. Fig. 1 D shows that damage to the fiber membrane caused by the notch was quite localized. Line-scan recordings were made from regions of the fiber adjacent to a notch where the fiber structure appeared to be regular. The distance between the clamps was ∼5 mm, and the fibers were usually notched at three different points, giving a distance between two notches of ∼1–1.5 mm. Experiments were performed at room temperature (∼23°C) and were started ∼30 min after notching the fiber and exposure to dye-containing solution to allow equilibration of the fiber with the bathing solution. The total volume of solution in the chamber was ∼125 μl. All chemicals were from Sigma Chemical Co. (St. Louis, MO) except for glutamic acid (Aldrich Chemical Co., Milwaukee, WI) and fluo-3 (Molecular Probes, Inc.).
Fluorescence Measurements
Fiber fluorescence was measured by a laser scanning confocal microscope (MRC 600; Bio-Rad Laboratories, Hercules, CA) set-up on an inverted microscope (IX-70, with a 60×, 1.4 NA oil immersion objective; Olympus Corp., Lake Success, NY). The confocal system was operated in line-scan mode (x vs. t), giving an image dimension of 138 μm for x and 1 s for t (with a sampling rate of 2 ms per line). The confocal aperture was set to 25% of the maximal value; the resolution was estimated as 0.4 μm in the x and y dimensions, and 0.8 μm in the z dimension. To improve the resolution of the system, images were acquired very close to the bottom surface of the fiber. Each run corresponded to five images acquired at the same location (i.e., a total of 5 s of acquisition). To avoid photo-dynamic damage of the fiber, the laser intensity was always set at the minimal power giving a reasonable fluorescence intensity, and acquisition during successive runs was performed by moving the scanned line position by 0.9 μm perpendicular to the fiber axis between runs. Occasionally, the microscope stage was moved parallel to the fiber axis to record from a region of the fiber adjacent to a different notch. Finally, to decrease the exposure of the fiber to the laser light, in all the experiments except Fig. 2, the fiber was incubated without recording for 10 min after each solution change before the start of the acquisition of images.
Figure 2.
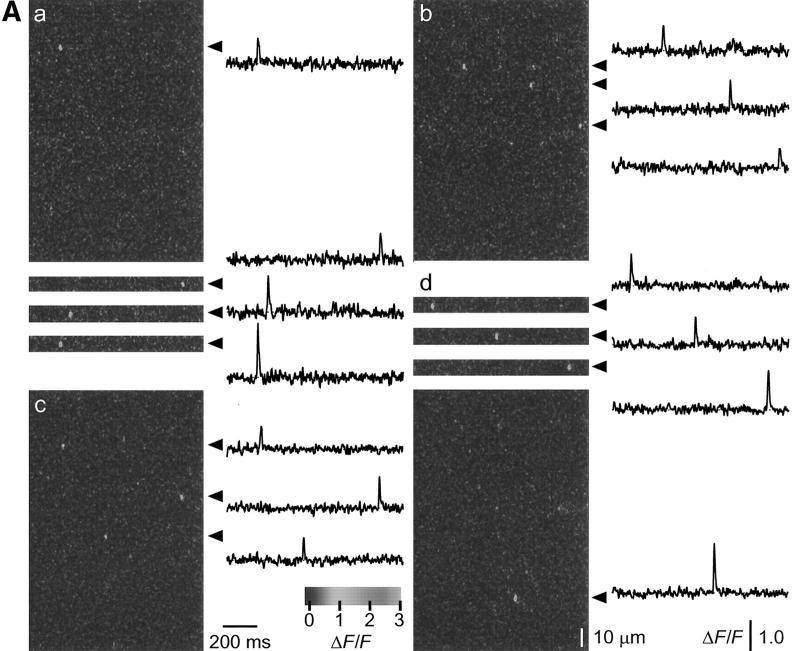
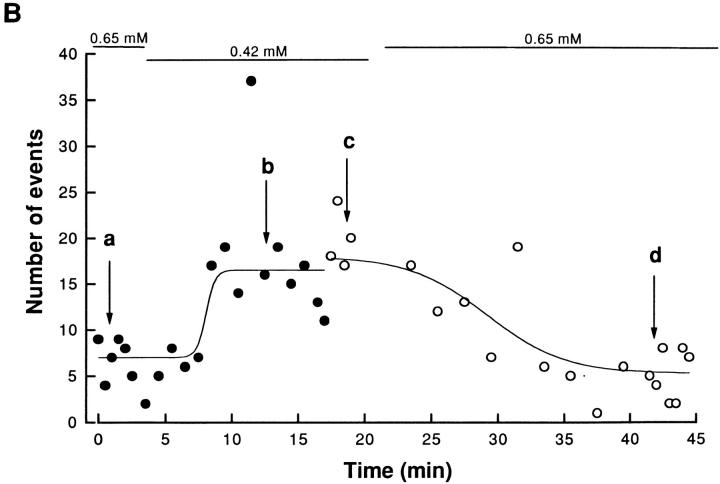
Time course of the effect of a change in [Mg2+] on event frequency. (A, previous page) Fluorescence line-scan images (left) and time courses of ΔF/F at the indicated individual triads in a fiber at two different [Mg2+], 0.65 (a and d) and 0.42 mM (b and c) at different times and two different locations along the fiber. The individual triad ΔF/F time courses correspond to the average of seven pixels in x at the location (arrowheads) of identified triads. For a and d, the frequency of events at [Mg2+] = 0.65 mM is low so that three other events from different images of the series are shown as 50-pixel (or 9-μm) image strips and single triad time courses. (B) Time course of the number of SR calcium release events as a function of time during the experiment. The acquisition was started during exposure of the fiber to a solution containing a [Mg2+] of 0.65 mM, which was then reduced to 0.42 mM. Each circle represents the number of events counted in five successive images of the run (i.e., during 5 s of acquisition). The changes of magnesium concentration are indicated by the horizontal bars (top). In the control condition ([Mg2+] = 0.65 mM), the mean number of Ca2+ release events was 7.0. After changing the solution to 0.42 mM [Mg2+], the number of calcium release events increased progressively to a steady value of 16.5 after ∼5 min. At 17.5 min after the start of the experiment, the fiber was moved and the acquisition was carried out at a new location along the fiber, as indicated by the change from • to ○ (solid lines drawn by eye). The solution was then changed back to the control ([Mg2+] = 0.65 mM) and the number of events then decreased to the initial value (5.3 events) in ∼10 min. Arrows and letters (a–d) indicate the time where images in Fig. 2 A were taken. (Fiber 041497b, sarcomere length = 3.6 μm.)
Analysis of Line-scan Images
Fluorescence line-scan images were converted to ΔF by subtraction of the resting fluorescence pattern along the fiber, averaged in time over the entire duration of the five images recorded at a particular location. ΔF images were then divided pixel by pixel by this averaged line to give the ΔF/F images. The averaged line fluorescence was also averaged in x (dimension of the line scanned along the fiber) to estimate the total average fluorescence of the fiber, corresponding to the overall (event and nonevent) fluorescence.
The procedure for selection of events was as described previously (Lacampagne et al., 1996; Klein et al., 1997). In brief, a rectangle (3.3 μm × 20 ms) was superimposed on ΔF/F pseudo-colored video-displayed images at locations where calcium release events were visually identified. The time course and spatial width of the fluorescence within the rectangle were simultaneously displayed graphically on the video monitor. For each selected event, the amplitude, the temporal half-duration, and spatial half-width were measured. Selected events were accepted or rejected according to the following criteria: a change of ΔF/F ≥ 0.4, half-duration ≥6 ms, and half-width ≥1 μm. The rise time of each event was taken as the time from 10 to 90% of the maximal amplitude. The mean frequency of events per sarcomere was calculated from the number of sparks per image by dividing by the number of sarcomeres along the line and by the image duration (1 s).
Values of parameters (e.g., half width, half duration, amplitude, rise time) of individual events in each fiber were averaged for each experimental condition and the values obtained for different fibers were then averaged. Results are expressed as the mean ± SEM.
results
Time Course of the Effect of Changing [Mg2+] on the Event Frequency
To investigate the effect of cytosolic free [Mg2+], the fibers were incubated in solutions containing various concentrations of Mg2+. Several successive runs of images were recorded at each [Mg2+]. Since magnesium is not membrane permeable, the change of [Mg2+] in the cytoplasm occurred only by diffusion through the notches (see Fig. 1).
Fig. 2 presents data from an experiment in which free [Mg2+] was changed from 0.65 to 0.42 mM. Fig. 2 A shows representative ΔF/F images and time courses of ΔF/F at the individual triads (marked by arrowheads at the right of the images), obtained in the control condition (a) (i.e., [Mg2+] = 0.65 mM), after changing the [Mg2+] to 0.42 mM (b and c) and after returning to the control solution (d). Because the line scan images in 0.65 mM [Mg2+] (Fig. 2 A, a and d) exhibited only a single event, strips of two other images in the same runs showing individual events are included for a and d. Each image was obtained at a slightly different lateral position (see methods). Fig. 2 A, a –b and c –d were obtained at different locations along the fiber. The time during the experiment at which each image was recorded was 1 (a), 12 (b), 19 (c), and 42 (d) min, as indicated in Fig. 2 B. Each image exhibits a few brief and localized increases in fluorescence, corresponding to a local elevation of [Ca2+] resulting from discrete calcium release events from the sarcoplasmic reticulum (Cheng et al., 1993; Klein et al., 1996). The time course and amplitude of the individual events shown by the time courses of ΔF/F at the indicated individual triads were similar at each [Mg2+].
Fig. 2 B illustrates the time course of the effect of changing [Mg2+] on the event frequency in this experiment. The number of SR calcium release events counted during the five images of each run in the experiment is expressed as a function of time. Each data point represents the number of events observed during 5 s of acquisition (i.e., during the five 1-s images of each run). During the two periods of exposure of the fiber to 0.65 mM [Mg2+], the average number of events was approximately seven events per run, or approximately one event per image as shown in Fig 2 A, a and d. After the first series of runs in 0.65 mM [Mg2+], the [Mg2+] was reduced to 0.42 mM. After a short latency, the number of calcium release events increased in <5 min to an average steady value of 16.5 events per run, or an average of approximately three events per image (Fig. 2 A, b and c).
Although most sarcomeres in which events occurred in an image exhibited only a single event or occasionally two events (Fig. 2 A), in one run in 0.42 mM [Mg2+] one sarcomere exhibited 6 events in one image and 10 in the following image, resulting in a total of 37 events at all triads in that run, giving the high point in 0.42 mM [Mg2+] in Fig. 2 B (at t = 11 min). Omitting these two values, the number of events for this time point would be reduced to 21, which is close to the observed average during this part of the experiment. Although such repetitive events at the same sarcomere were rare, they were observed occasionally. If these repeated events at the same sarcomere represent repeated openings of the same channel or channels, they may indicate an alternative gating behavior of the SR channels.
The location along the fiber where images were recorded was changed after 17.5 min, as indicated by the change from filled to open symbols in Fig. 2 B. At this new location, the average number of events in five images ([Mg2+] = 0.42 mM) was slightly larger (18 events) than at the original location (16.5 events). The [Mg2+] was then returned to the initial value (0.65 mM) and after ∼10 min of incubation, the average number of SR calcium release events decreased to 5.3 events per run. The time course in Fig. 2 B shows that decreasing free [Mg2+] increased the frequency of SR calcium release events in a reversible manner. It also shows that from line to line or from one location along the fiber to another, there was little variability in the frequency of SR calcium release events. The difference in the apparent time course during the changes of solution could be due to differences in the distance between the two notches or in the location of the scanned line relative to the notch locations.
[Mg2+] Dependence of SR Calcium Release Event Frequency
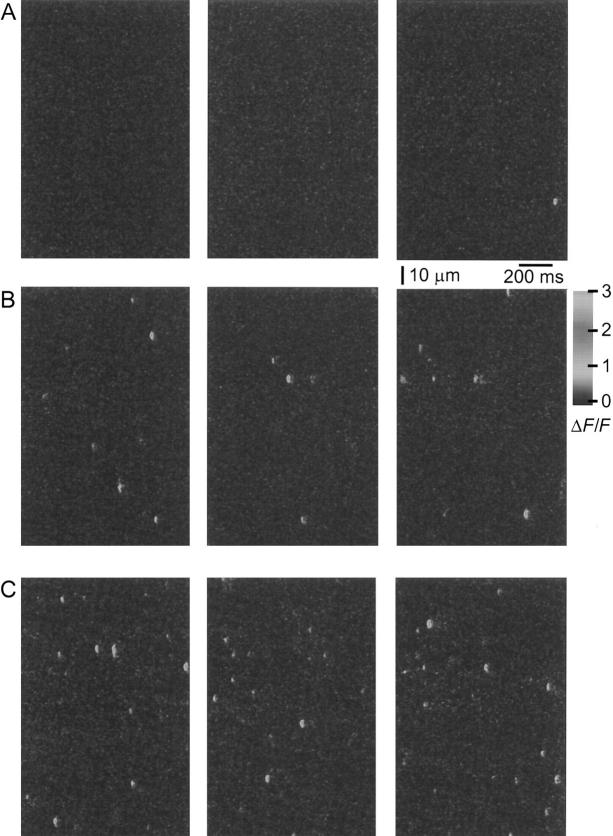
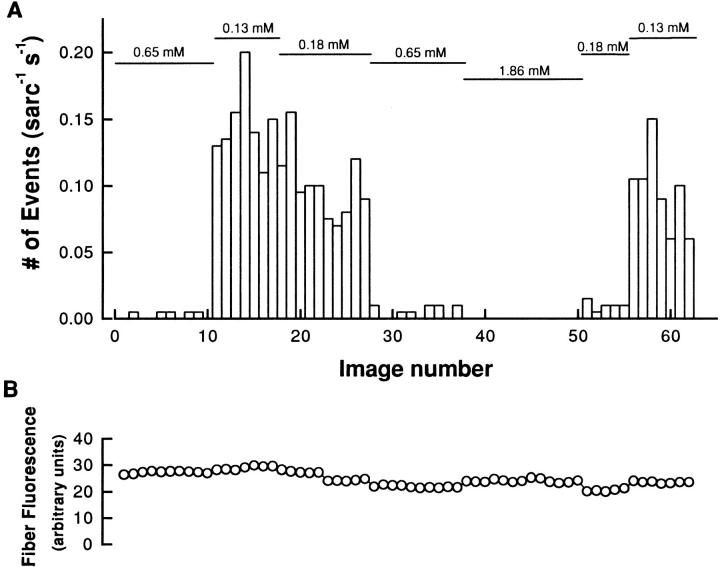
Fig. 3 presents sets of ΔF/F images giving SR calcium release events obtained at three different [Mg2+], 0.65 (A), 0.18 (B), and 0.13 (C) mM, in the same fiber. These images clearly show that the number of events increased as [Mg2+] decreased. Fig. 4 A presents the steady state frequency of events as a function of image number during one experiment. The experiment started with our reference [Mg2+] of 0.65 mM, which gave a very low rate of events (0.003 sarc−1 s−1). During this part of the experiment, several sets of images exhibited no calcium release events, as indicated by the absence of a bar. The solution was then changed to a free [Mg2+] of 0.13 mM, which induced a 49-fold increase in the event frequency (0.146 sarc−1 s−1). This activity was reduced by subsequently increasing the [Mg2+] to 0.18 mM (0.1 sarc−1 s−1) and returned to the initial value by exposure to 0.65 mM Mg2+ (0.005 sarc−1 s−1). Application of 1.86 mM Mg2+ then induced a complete inhibition of SR calcium release events. This inhibition was subsequently reversed by decreasing the [Mg2+] to 0.18 (0.01 sarc−1 s−1) and 0.13 mM (0.096 sarc−1 s−1). However, the frequency of events obtained during the last two applications of solution was significantly lower than at the beginning of the experiment with the same solution. This change could be due to a run-down of the fiber as observed at the end of such a very long experiment (∼120 min). Fig. 4 B presents the averaged fluorescence of the fiber during this experiment. Each point represents the average pixel value (average in t and x) for the five images of each run as described in methods. This graph clearly indicates that the change in SR calcium release event frequency was not accompanied by a significant change in the overall fiber fluorescence. The changes in event frequency were thus not due to changes in myoplasmic [Ca2+].
Figure 3.
Effect of [Mg2+] on SR calcium release event frequency. ΔF/F line scan images obtained on the same fiber at different [Mg2+]. (A) [Mg2+] = 0.65 mM, only one image out of three (right) exhibited an event. (B and C) Images obtained at 0.18 and 0.13 mM Mg2+, respectively. No events were observed during 13 runs (not shown) in which the fiber was exposed to 1.8 mM Mg2+ (see Fig. 4). (Fiber 120396a, sarcomere length = 3.2 μm.)
Figure 4.
(A) Effect of [Mg2+] on the calcium release event frequency. Same fiber as in Fig. 3. Changes of [Mg2+] are indicated by the horizontal bars (top). The fiber was equilibrated for 10 min in each solution before start of image acquisition. Each bar on the plot represents the number of events obtained in five images at a given line position. (B) The time course of average fiber fluorescence during the same experiments as in A. The total fluorescence of the images (i.e., events and nonevent fluorescence) was averaged in t and in x for each file as described in methods.
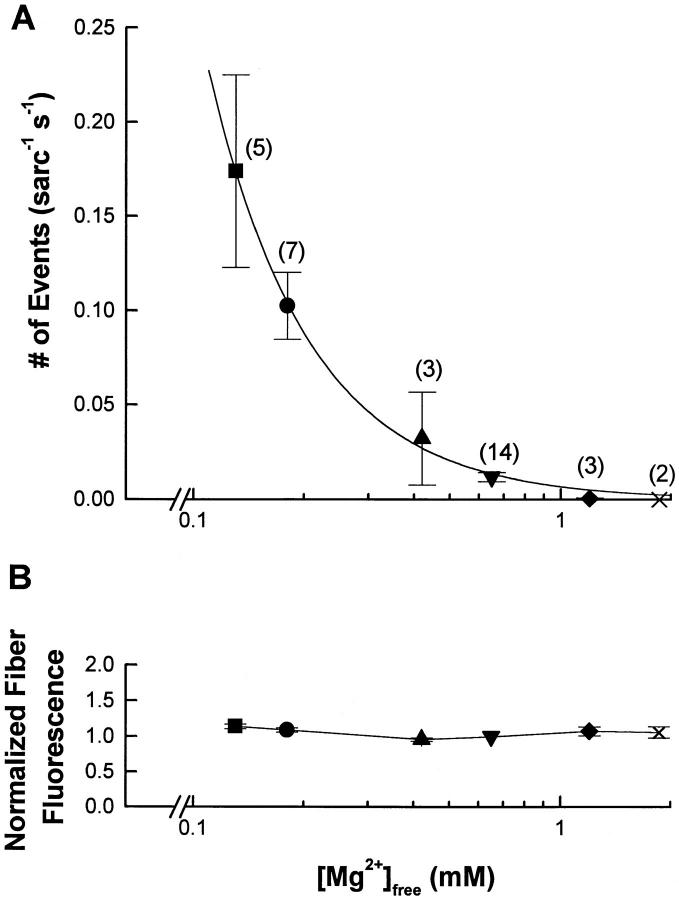
Fig. 5 A summarizes the effect of [Mg2+] on the SR calcium release event frequency in several fibers. This graph indicates a relatively low rate of events in the fiber in the physiological range of [Mg2+]. For our standard solution ([Mg2+] = 0.65 mM), the mean event frequency was 0.012 ± 0.01 sarc−1 s−1. The spontaneous activity was completely inhibited by 1.86 mM magnesium. However, decreasing the [Mg2+] to below 0.65 mM resulted in a steep increase in SR calcium release event frequency. The event rate of 0.174 sarc−1 s−1 obtained at a [Mg2+] of 0.13 mM was the highest rate for which we could reliably determine individual event properties. For that reason, no results corresponding to lower [Mg2+] have been presented in this graph.
Figure 5.
(A) [Mg2+] dependence of SR calcium release event frequency. The points represent the mean ± SEM, with the number in parentheses giving the number of experiments performed for each [Mg2+]. All the experiments were performed with 0.65 mM [Mg2+] used as a bracketing reference for at least one other concentration tested. Each [Mg2+] is represented with a different symbol; the corresponding symbols were used in the following graphs for the same concentrations of magnesium. Data have been fitted by f = K/[Mg2+]n with K = 0.007 and n = 1.6 (see text for additional details). (B) Fluorescence of the fiber as a function of the [Mg2+]. The fluorescence value represents the total fluorescence (i.e., event and nonevent fluorescence) averaged in t and x for each run, for all the fibers presented in A. The data were normalized to the fiber fluorescence value measured at 0.65 mM [Mg2+]. The symbols and the number of experiment for each [Mg2+] are the same as for A. Note the logarithmic abscissa.
The binding of magnesium to SR Ca2+ release channels, and the consequent inhibition of the rate of Ca2+ release events, can be described by the equation
 |
1 |
where f is the observed event frequency, f max the maximal event frequency, K d corresponds to the [Mg2+] giving a half-maximal frequency, and n the number of interaction sites. The steep increase in event frequency with decreasing [Mg2+] prevented us from determining the value of f max and K d, but suggests that the range of [Mg2+] tested here was high compared with K d and that the highest measured frequency was low compared with f max. By assuming K d << [Mg2+] and setting f max K d nequal to a constant (K), Eq. 1 can be approximated as
 |
2 |
Using this equation, the results in Fig. 5 A have been fitted as indicated by the line on the graph. The result of the fit gave a value for n equal to 1.6. Thus, at least two magnesium ions must bind to the SR calcium channel to exert their inhibitory effect.
Several experiments were performed in the presence of 1 μM nifedipine (data not shown), a pharmacological agent known to maintain the voltage sensor in the inactivated state (see Rios and Pizzaro, 1992, for references). There was no effect of nifedipine on the event frequency as a function of [Mg2+], suggesting that the magnesium effects observed here occurred in the presence of inactivated voltage sensors.
Fig. 5 B shows the average fluorescence of line-scan images as an estimation of the fiber resting [Ca2+] for the same fibers and range of [Mg2+] as tested in Fig. 5 A. This figure shows a relatively constant average fluorescence, suggesting that there was no significant elevation of resting [Ca2+] that could have given rise to the observed increase in event frequency; for example, by calcium-induced calcium release (Ford and Podolsky, 1970; Endo et al., 1970).
Effect of [Mg2+] on Individual SR Calcium Release Event Properties
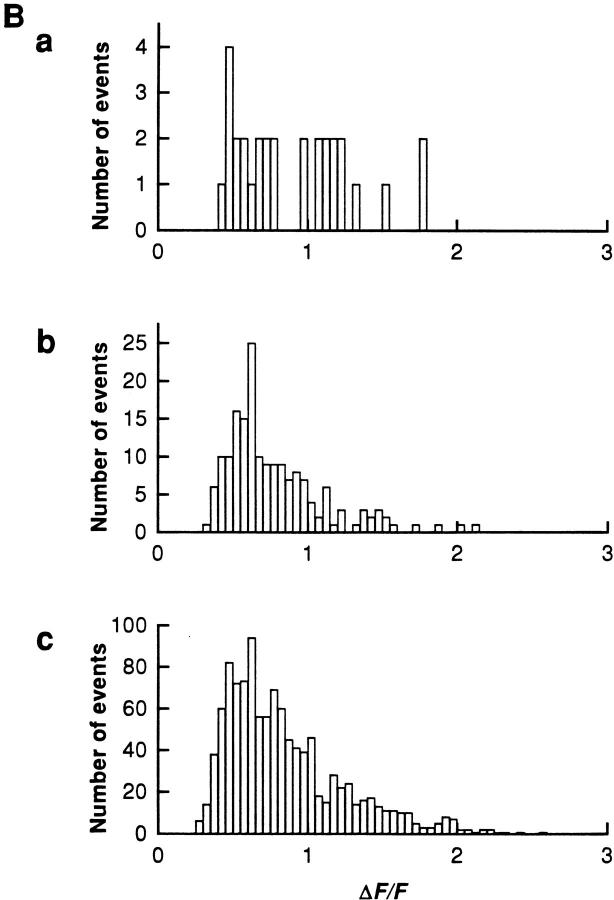
Intracellular magnesium appears to be a major modulator of SR calcium release event occurence demonstrated by the large increase in event frequency when [Mg2+] was reduced. We next analyzed parameters of individual events to determine if the change in frequency induced by a change in [Mg2+] was accompanied by a change in properties of individual identified events. Fig. 6 A presents surface plots of SR calcium release events averaged (Lacampagne et al., 1996) from individual events obtained in the same fiber at three different concentrations of Mg2+, 0.65 (a), 0.18 (b), and 0.13 (c) mM. The averaged events were essentially the same at each [Mg2+] studied. Fig. 6 B shows the amplitude distribution of the individual events averaged to give Fig. 6 A. Although the number of events counted in these three different experimental conditions was different due to the effect of magnesium on event frequency, these histograms indicate that the distributions of event amplitudes were comparable at different [Mg2+].
Figure 6.
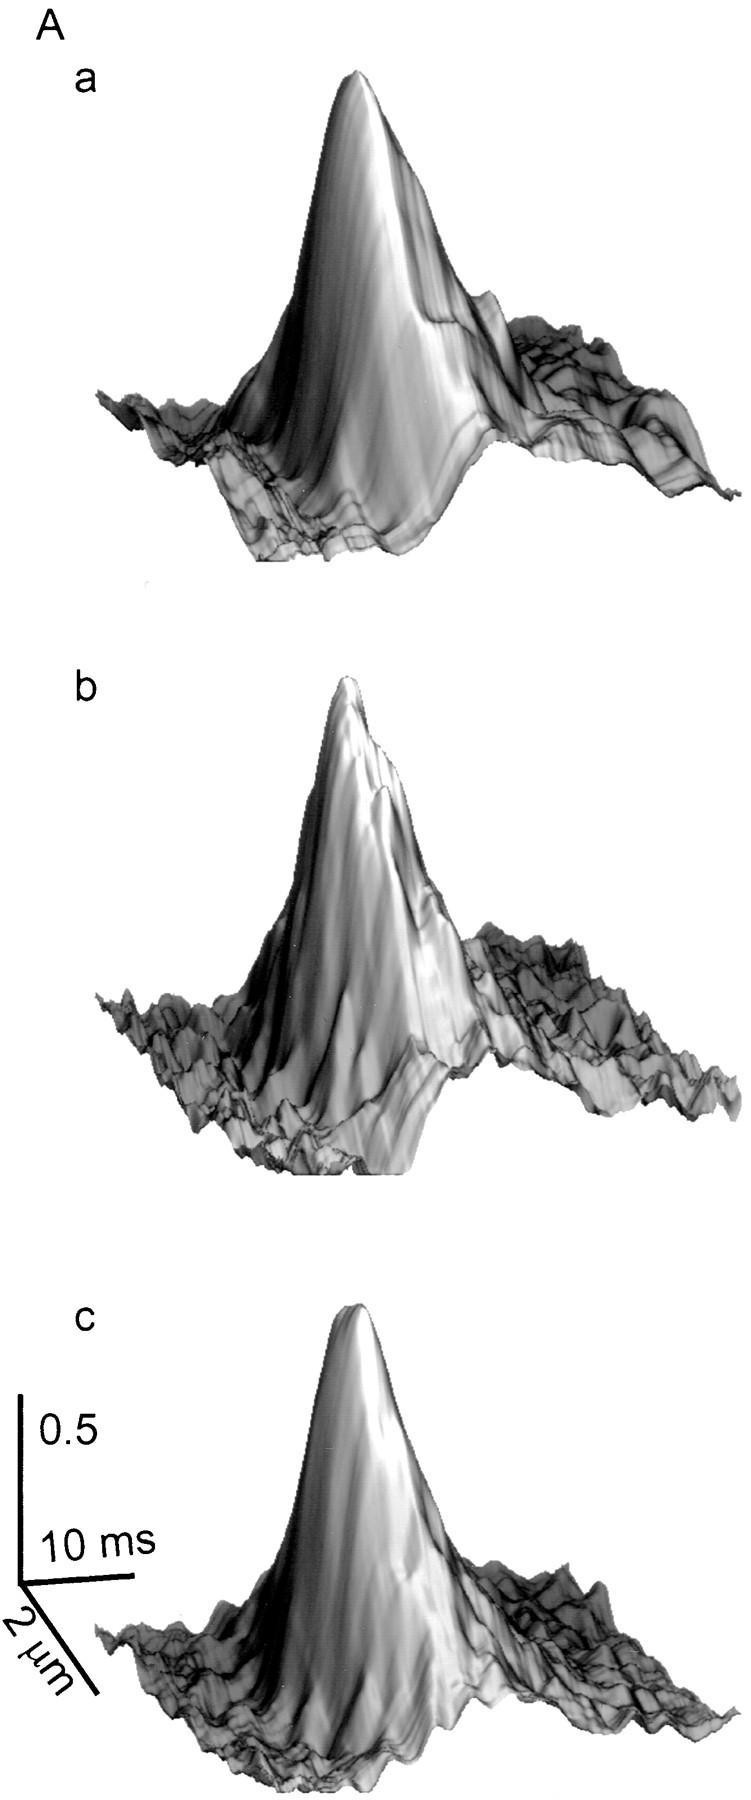
Effect of Mg2+ on individual event properties. (A) Surface plots of averaged events at [Mg2+] of 0.65 (a, 20 events), 0.18 (b, 138 events), and 0.13 (c, 247 events) mM. For each [Mg2+], the averaged event was obtained using all events within the event selection criteria. (B) Effect of [Mg2+] on the amplitude distribution of SR calcium release events at [Mg2+] of 0.65 (a), 0.18 (b), and 0.13 (c) mM. (Fiber 100996b, sarcomere length = 3.6 μm.)
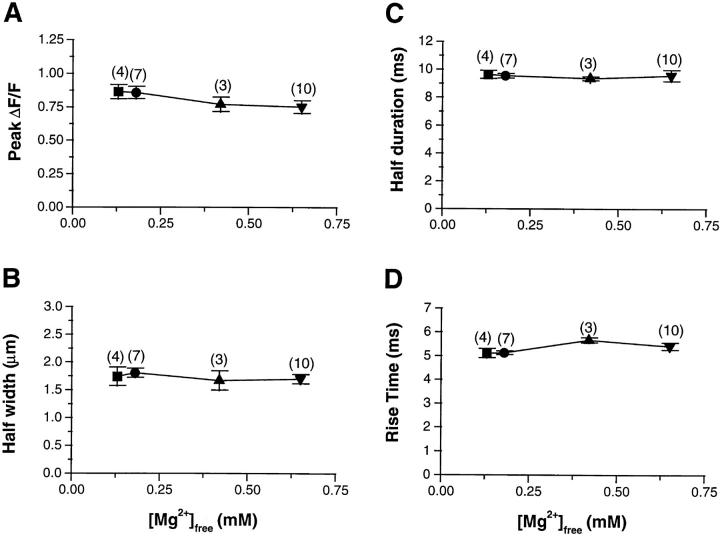
Using each individual identified event, we measured the amplitude, the half width, half duration (width and duration of event at 50% of the maximal amplitude), and the rise time (measured as the time to go from 10 to 90% of the maximal fluorescence amplitude). For the averaged events from the fiber of Fig. 6 A, the mean values of these four parameters did not differ significantly with changes in [Mg2+]. Fig. 7 summarizes the average properties of SR calcium release events in all the fibers examined in this study at four different [Mg2+]. For all experiments in this study, a [Mg2+] of 0.65 mM was used as the control. Fig. 7 A examines the amplitude (ΔF/F) as a function of the free [Mg2+]. This graph indicates a constant amplitude over the entire range of [Mg2+] examined. The same conclusion is reached for the spatial spread of events, measured as the spatial half width of events (Fig. 7 B). The last two graphs examine the time course of calcium release events. Fig. 7 C shows that the half duration of SR calcium release events was not significantly affected by a change in the [Mg2+]. The last parameter examined was the rising phase of the SR calcium release events (Fig. 7 D). This parameter can be used as an estimation of the open time of the channel or group of channels involved in a calcium event (Klein et al., 1997; see discussion, below). This rise time also appeared to be independent of the change in free [Mg2+].
Figure 7.
Average values of individual SR calcium release event properties as a function of [Mg2+]i. Each panel represents the effect of magnesium on SR calcium release event amplitude (A), spatial half width (B), half duration (C), and rise time (D). Each parameter was measured in 432 events at 0.13 mM [Mg2+], 542 events at 0.18 mM, 122 events at 0.42 mM [Mg2+], and 300 events at 0.65 mM [Mg2+]. The data points represent the average value for all the fibers studied at each [Mg2+] as indicated by the number in parentheses (symbols as in Fig. 5).
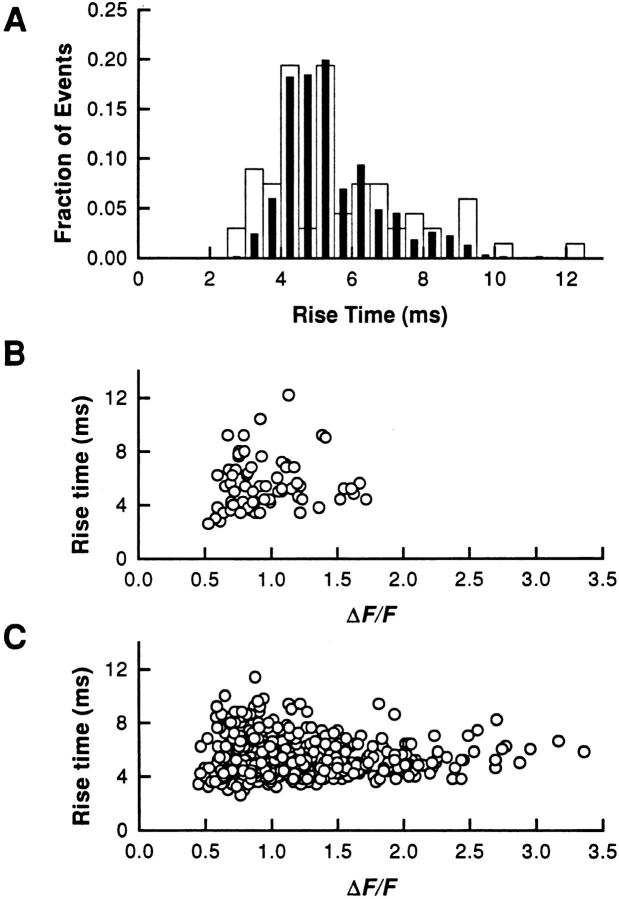
Fig. 8 investigates the distribution of event rise times and the relation between rise time and amplitude of individual SR calcium release events occurring at different frequencies (i.e., at different [Mg2+]). SR calcium release events were measured at 0.86 and 0.25 mM [Mg2+]. This change in [Mg2+] resulted in a fivefold change in frequency without any significant change in the amplitude distribution of events as described above (Fig. 6). Fig. 8 A presents superimposed histograms of the rise times of events at 0.86 and 0.25 mM [Mg2+]. These distributions were not significantly affected by the change in [Mg2+] concentration and event frequency. The mean values of the rise time were 5.5 ± 0.2 ms in 0.86 mM [Mg2+] (n = 67 events) and 5.4 ± 0.1 ms in 0.25 mM [Mg2+] (n = 531 events). Fig. 8, B and C present the distribution of rise times of events as a function of their amplitude at the two [Mg2+], 0.86 (B) and 0.25 (C) mM. These graphs show no evidence of a correlation between these two parameters, indicating that bigger events do not result from longer opening of the channel or group of channels involved. In Fig. 8, B and C, the smaller events give a larger dispersion of rise times. This arises from uncertainty in the estimation of the rise time for these smaller events due to contamination by noise. Similar results have been obtained on three different fibers exhibiting at least a threefold increase in event frequency and a sufficient number of events at high [Mg2+] for comparison (number of events >50).
Figure 8.
Relation between amplitude and rise time of SR calcium release events at different [Mg2+]. Events were obtained on the same fiber at two different [Mg2+], 0.86 and 0.25 mM, giving an event frequency of 0.031 and 0.155 sarc−1 s−1, respectively. (A) Superimposed distributions of the rise time of SR calcium release events in the two experimental conditions (open bars = 0.86 mM [Mg2+]; filled bars = 0.25 mM [Mg2+]). (B and C) Distribution of the rise time of events as a function of their amplitude, at 0.86 mM [Mg2+] (B) and 0.25 mM [Mg2+](C). The number of events was 67 at 0.86 mM [Mg2+] and 531 at 0.25 mM [Mg2+]. (Fiber 111296a, sarcomere length = 3.5 μm.)
Effects of Adenine Nucleotides on Event Frequency
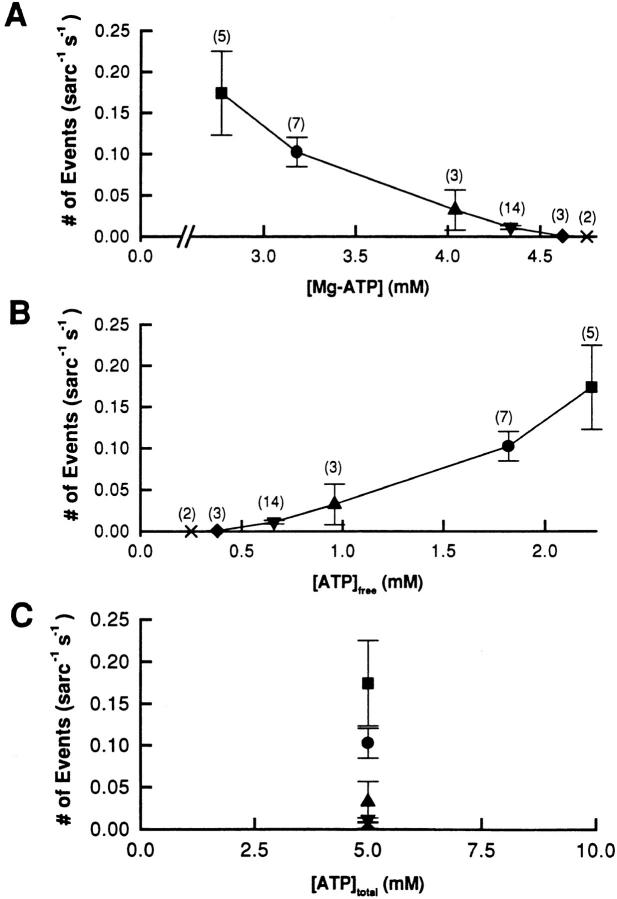
Adenine nucleotides have been described to be activators of RyR in various kinds of preparations (Meissner, 1984; Endo, 1985; Smith et al., 1985; Meissner et al., 1986). Since magnesium ions are mostly complexed with ATP under the conditions of our experiments (Table I), we considered the possibility that Mg-ATP or free ATP could contribute in the change of SR Ca2+ release event frequency. Fig. 9 A shows the measured event frequency of Fig. 5 A replotted as a function of the calculated Mg-ATP. The increase in event frequency we observed in Fig. 5 A was apparently correlated with a decrease in [Mg-ATP]. According to results reported by others (Meissner et al., 1986; Rousseau et al., 1992), this observation is contrary to the expected increase of frequency by Mg-ATP.
Figure 9.
Possible effect of [ATP] on event frequency. The data of Fig. 5 are replotted as a function of the calculated [Mg-ATP] (A) and free [ATP] (B), and the total [ATP] (C) (see Table I). The same symbols as in Fig. 4 were used in these graphs and the numbers in parentheses indicate the number of experiments performed in each condition. Results are expressed as the mean ± SEM.
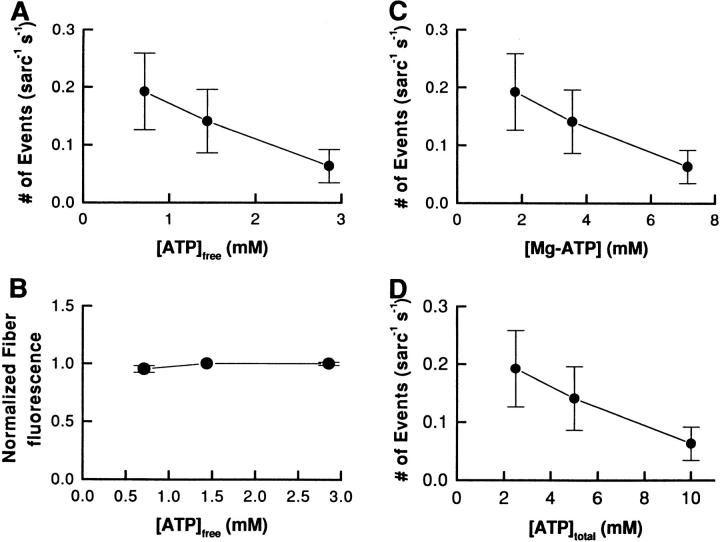
It has also been reported that free ATP is able to activate the SR calcium channel (Meissner et al., 1986). Indeed, when event frequency is plotted as a function of [ATP] (Fig. 9 B), the increase in event frequency observed in Fig. 5 is seen to be correlated with an increase in the free [ATP], while the total [ATP] is constant (Fig. 9 C). To determine whether the change in free [ATP] could be responsible for the increase in event frequency, we performed experiments in which the calculated free [Mg2+] was kept constant at 0.25 mM and total [ATP] was varied from 2.5 to 10 mM (see Table I). The results, presented in Fig. 10, indicate that increasing the total [ATP] (Fig. 10 D), which results in an increase in both free [ATP] (Fig. 10 A) and [Mg-ATP] (Fig. 10 C), decreased the frequency of events without any significant change in the fiber fluorescence (Fig. 10 B). These results confirm the fact that the increase in event frequency cannot be attributed to a change in free [ATP]. It is also important to note that the total [ATP] was not responsible for the change in event frequency since it was constant (see Table I) for the experiments of Figs. 5 and 9, and increased with the free [ATP] in Fig. 10 (see Table I, bottom). The results of Fig. 10 also suggest that the event frequency measured in Fig. 5 might even be underestimated due to a possible inhibitory effect of free [ATP] described here. From this series of experiments, we conclude that the change in SR Ca2+ event frequency induced by a change in [Mg2+] is attributable to a direct effect of [Mg2+]. If the modulatory effect of adenine nucleotides on the SR channel occur at micromolar concentration, as shown in bilayer experiments (Xu et al., 1996; Sonnleitner et al., 1997), the direct modulatory effect of [ATP] would have been constant in our experiments since the free [ATP] was never decreased to the range in which changes in free [ATP] could directly affect the behavior of the channel. It thus seems that the decrease in event frequency observed here at higher [ATP] may have to be attributed to another modulation pathway, perhaps involving a phosphorylation/dephosphorylation mechanism (Herrmann-Frank, 1993; Wang and Best, 1992; Hain et al., 1994).
Figure 10.
Effect of ATP on SR calcium release event frequency at a constant [Mg2+]. The effect of a change in total [ATP] concentration was investigated by keeping the calculated free [Mg2+] constant at a value of 0.25 mM while varying the total added ATP. As indicated in Table I, the change in total [ATP] was accompanied by a change of [ATP] and [Mg-ATP]. Frequency of SR calcium release events as a function of the [ATP] (A), [Mg-ATP] (C), and total [ATP] (D). (B) Averaged fiber fluorescence as a function of the [ATP]. The fluorescence value corresponds to the total fluorescence (i.e., event and nonevent fluorescence). The data were normalized to the fiber fluorescence value measured at 5 mM ATP (mean ± SEM of six fibers).
discussion
This article presents the first detailed characterization of ligand-modulated discrete Ca2+ release events in skeletal muscle fibers. By monitoring both the event frequencies and the spatiotemporal properties of the individual release events, we have obtained information concerning the effects of [Mg2+] on the opening and closing of the SR Ca2+ channel or channels underlying the Ca2+ sparks. It is important to note that the present information concerning channel gating was obtained with the channel in its native structural environment within the triad junction, with most or all of the accessory protein components that might influence physiological gating mechanisms likely preserved intact in their native configuration. As such, our results provide the first determination of the effects of [Mg2+] on the gating properties of the SR Ca2+ release channel in its native structural and molecular environment. Our results demonstrate that [Mg2+] modulates the frequency of the discrete release events but does not alter the properties of the individual events themselves, suggesting that [Mg2+] modulates the opening rate but not the closing rate of SR Ca2+ channels within a muscle fiber.
Previous studies have demonstrated effects of [Mg2+] on Ca2+ release in muscle fibers and on Ca2+ release channel function in a variety of fragmented membrane and channel preparations. Thus it should be anticipated that if Ca2+ sparks underlie the macroscopic Ca2+ release studied previously, then at least some aspects of Ca2+ sparks should be sensitive to [Mg2+]. The present studies demonstrate that the frequency of Ca2+ sparks is indeed modulated by [Mg2+], consistent with [Mg2+] modulation of macroscopic Ca2+ release and with Ca2+ sparks underlying the macroscopic release studied previously.
Effects of [Mg2+] on Ca2+ Release Event Frequency
The resting level of myoplasmic [Mg2+] in intact muscle fibers has been estimated to be ∼1 mM. The event frequency that we observed at this [Mg2+] level (Fig. 5) corresponds to an extremely low rate of SR calcium release events. At 0.65 mM [Mg2+], the observed rate of calcium release events was 0.012 ± 0.01 sarc−1 s−1, or approximately one event, on average, per sarcomere in 100 s. If we assume that the number of SR calcium channels within the confocal spot is ∼100 per triad (F. Protasi and C. Franzini-Armstrong, personal communication), that all channels are equivalent, and that the spontaneous opening of any one of these channels would trigger a detectable event at that triad, then, in our standard solution of [Mg2+] = 0.65 mM, the average spontaneous opening rate of any channel would be ∼1.2 × 10⁻⁴ channel openings per second, or 1 opening of each channel, on the average, every 140 min. Such low rates of opening would be impractical to study in single channel bilayer experiments, but can be examined with muscle fibers due to the large number of channels sampled within all the sarcomeres in the confocal volume along the scan line.
Our estimated low opening rate of individual channels may be consistent with the recently estimated low rate of calcium efflux from the SR in resting fibers, 0.0003–0.0006 mmol ms−1 l−1 (Jong et al., 1995). If we assume a single channel current of 1 pA, a mean channel open time of 6 ms (Fig. 7), a concentration of release channels of 0.27 μM (compare Pape et al., 1992), and that each event corresponds to the opening of a single channel, the estimated event rate of 1.2 × 10⁻⁴ channel−1 s−1 would correspond to an efflux of 0.0006 mmol ms−1 l−1. Thus the event rates measured here in 0.65 mM [Mg2+] may correspond to the physiological calcium efflux in resting muscle fibers.
When the [Mg2+] was decreased from 0.65 to 0.13 mM, the event frequency increased by a factor of 15, indicating a strong effect of Mg2+ to maintain the channel in a closed state. Over the range of [Mg2+] used for these studies, the resting fluo-3 fluorescence in the fiber was constant, indicating a constant level of resting [Ca2+] in the myoplasm. At [Mg2+] < ∼0.1 mM, the resting [Ca2+] increased due to higher frequency of release events. The effect of [Mg2+] on event frequency was not studied in this range due to probable effects of changes in both [Mg2+] and [Ca2+] (Klein et al., 1996) influencing the observed event frequency.
Lack of Effect of [Mg2+] on Event Rise Times, Amplitudes, and Spatiotemporal Spread
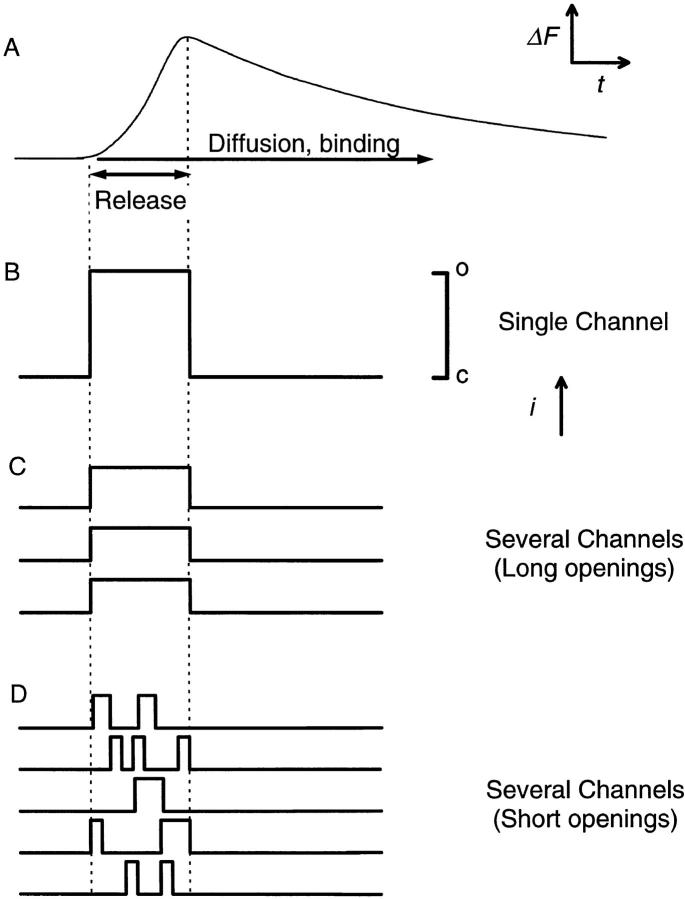
Our results demonstrate that the mean event rise times and amplitudes, as well as the distributions of event rise times and amplitudes, were virtually identical over a range of [Mg2+] that markedly altered the event frequency. To assess the implications of these results for the gating of the SR Ca2+ channel or channels underlying a spark, it is important to consider alternative possible channel activity patterns that could give rise to a given spark. Fig. 11 presents a diagrammatic representation of a Ca2+ spark (Fig. 11 A) with several alternative possible gating patterns of the channel or channels underlying the spark. The rising phase of the spark should correspond to the time during which Ca2+ ions are leaving the SR and entering the sarcomere. This Ca2+ efflux could conceivably be generated by the opening of a single SR Ca2+ release channel, which remains open for the duration of the spark rising phase (Fig. 11 B), by several channels open for the entire duration of the spark rising phase (Fig. 11 C), or by several channels opening and closing throughout the spark rising phase (Fig. 11 D). Regardless of which of these alternatives actually applies, in order to produce a spark of a given amplitude and duration, the total amount and total duration of Ca2+ release would be approximately the same. At present, we cannot distinguish between these alternative possibilities for the generation of a Ca2+ spark. Nevertheless, the simplest interpretation of the observed constancy of spark amplitude and duration despite large changes in spark frequency with variation of [Mg2+] is that the mean pattern and duration of opening(s) of the channel or channels underlying the sparks is not influenced by [Mg2+].
Figure 11.
Diagrammatic representation of the hypothetical SR Ca2+ release channel activity underlying a single Ca2+ spark. (A) Idealized waveform of the fluorescence change (ΔF) as a function of time (t) accompanying the measurement of a single Ca2+ spark. (B–D). Single channel Ca2+ currents that might give rise to the event shown in A if a Ca2+ spark is caused by the opening of a single SR Ca2+ release channel that remains open for the duration of the rise time (B), and multiple channels, each of which is open for the duration of the rise time (C) or that open and close repeatedly during the rise time (D). Channel openings (o) are indicated by upward deflections of the traces in B–D, in arbitrary units of ionic current (i).
The Ca2+ sparks recorded by laser scanning confocal microscopy are also influenced by the spatiotemporal distribution of the calcium-dye complex, as well as by the location of the origin of the event relative to the scan line (Pratusevich and Balke, 1996). Theoretical calculations using a model for Ca2+ diffusion and binding in a sarcomere together with simulation of the confocal recording indicate that the event rise time provides a reliable estimate of the time during which the channel or channels generating the spark are open, independent of the relative spatial locations of the scan line and the channel or channels giving rise to the spark (Pratusevich and Balke, 1996, for a single channel; Jiang et al., 1998 for simulations of single or multiple channels). If a single channel opening generated the events observed here, our observed mean value of ∼6 ms for the event rise time would correspond approximately to the mean channel open time, which is in the range of reported open-time values for single SR calcium channels in bilayers (Smith et al., 1986; Rousseau et al., 1988; Rousseau and Meissner, 1989; Xu et al., 1996). If several channels were open during a spark, the mean channel open time could be 6 ms (e.g., Fig. 11 C) or less (Fig. 11 D). Because of our event selection criteria and the limited time resolution imposed by the line-scan acquisition rate (2 ms per line), very short openings, which have been detected in bilayer experiments (Ma, 1993; Herrmann-Frank et al., 1996; Xu et al., 1996), would not have been detected in our experiments. Thus, our mean open time could be an overestimation of the true mean value. Nonetheless, it is clear that if the distribution of event rise times had shifted to longer openings with decreasing [Mg2+], this change would have been reflected by a shift of both the measured mean event rise time and the measured distribution of rise times to larger values. Since this was not observed, it appears that the channel open time underlying the observed events was not increased significantly by a decrease in [Mg2+], which increased the event frequency by more than an order of magnitude. Furthermore, the absence of a significant change in the mean half width and half duration of release events at different [Mg2+] (Fig. 7) suggests that the spatiotemporal extent of the fluorescence change in a Ca2+ spark is dominated by diffusional processes, and not by changes in the activity of the Ca2+ pump or of the concentration of free parvalbumin sites available to bind Ca2+, both of which might accompany changes in myoplasmic [Mg2+].
In contrast to the spark rise times, the spark amplitudes that we observed should in theory have depended strongly on the spatial distribution of event origins relative to the scan line (Pratusevich and Balke, 1996; Jiang et al., 1998) as well as on the criteria we used for event selection (see methods). However, since the event location relative to the scan line was random in all cases and the selection criteria were fixed, both of these factors should have been the same for all values of [Mg2+]. Thus, the observations that both the mean and the distribution of event amplitudes were independent of [Mg2+] indicates that both the actual event amplitudes and the amount of Ca2+ released in an event must have been independent of [Mg2+]. This would be consistent with both the open time of the channel or channels underlying the release events and the Ca2+ efflux rate through an open channel being independent of [Mg2+]. However, the rising phase of a spark might include the opening and closing of multiple channels (Fig. 11 D). In that particular case we cannot rule out the possibility that the total channel open times during an event were increased by lowering [Mg2+], but resulted in no change in the amount of Ca2+ released in an event because of the effect of increased channel open time being coincidentally just balanced by a decrease in the Ca2+ efflux rate through each open channel due to a possible decrease in the SR Ca2+ content.
A Minimal Model for Observed Effects of Magnesium on SR Calcium Release Event Frequency
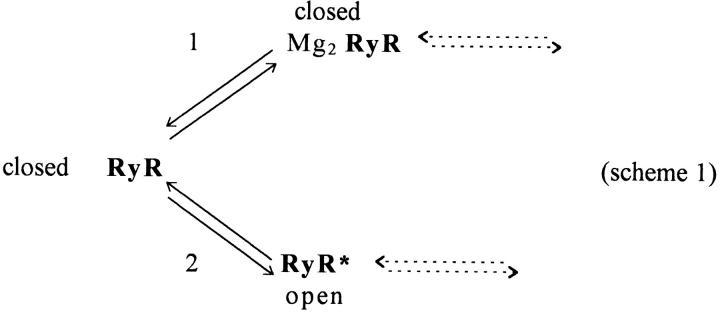
Our results indicate that a decrease in myoplasmic [Mg2+] steeply and reversibly increased the frequency of SR calcium release events. As [Mg2+] was lowered from the physiological level, the observed changes in SR calcium release event activity lead to three major conclusions concerning the generation of the release events by decreasing [Mg2+]. (a) The properties of the individual events that were observed at each [Mg2+], including the event rise times and event amplitudes, were independent of [Mg2+], indicating that the open time of the channel or channels giving rise to the observed events were independent of [Mg2+]. (b) The increase in event frequency as [Mg2+] is decreased indicates that the channel or channels responsible for generating a release event must exhibit a decreased closed time as [Mg2+] is decreased since the open times were constant. (c) The [Mg2+] dependence of the increase in event frequency with lowered [Mg2+] is consistent with more than one Mg2+ ion being involved in the Mg2+ inhibition of channel opening, and with a low millimolar value for the dissociation constant for Mg2+ binding at the inhibitory site for channel opening (Scheme S1).
Scheme 1.
A minimal kinetic reaction scheme that is consistent with our three major conclusions concerning the effects of Mg2+ ions on the gating of the SR calcium release channel is presented in Scheme S1. In this model, two Mg2+ ions must first dissociate (step 1) from the ryanodine receptor/calcium release channel (RyR) before the channel can be transformed (step 2) to the open state RyR*. Although our present observations do not indicate any specific mode of channel activation, the opening of the channel could occur by calcium-induced calcium release (Klein et al., 1996), produced by Ca2+ binding to the Mg2+-free RyR. Channel closing is Mg2+ independent, which could occur in Scheme S1 either by reversal of step 2 or by a subsequent transition after state RyR* (dashed arrows). It is important to note that our observation that the closed time is dependent on [Mg2+] but the open time is not necessitates the inclusion of at least three states in the minimal model (Scheme S1) for the effects of lowered [Mg2+] on event gating as observed here.
Scheme S1 embodies all of the major conclusions of this study and is thus a minimal model for SR channel gating in functioning fibers in so far as the gating model can be specified by the findings presented here. However, it is well established from bilayer studies that SR channel gating is modulated in at least two different ways by both Ca2+ and Mg2+ ions (see Meissner, 1994). Ca2+ binding at the activation site (Type I of Laver et al., 1997) of the otherwise divalent-free channel opens the channel by calcium-induced calcium release, and Mg2+ binding to the same site inhibits such activation. In contrast, binding of either Mg2+ or Ca2+ at the lower affinity inactivation site (Type II of Laver et al., 1997) prevents the channel from opening. Thus, the possibility that altering [Mg2+] may alter the frequency of release event occurrence by two different mechanisms must be considered.
A More Complete Model for the Effects of Calcium and Magnesium Ions on SR Calcium Release Events
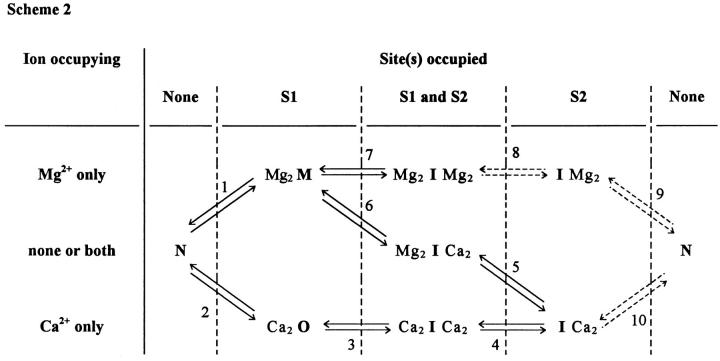
Based on the preceding considerations, it is clear that Scheme S1 represents only part of the more complex reaction scheme for SR channel modulation by Ca2+ and Mg2+ ions (Meissner et al., 1986). It is thus of interest to integrate our minimal model into a more complete model to serve as a working hypothesis for interpreting our own observations as well as those of others. This is attempted in Scheme 2 (Fig. 12), which includes two types of divalent cation binding sites, S1 and S2 (Laver et al., 1997), on the SR calcium release channel. As denoted by the columns and rows in Fig. 12, either two Ca2+ or two Mg2+ ions can bind to each type of site on the channel and modulate its function. The functional state of the channel under the various free or ligand-bound states is denoted by the letters M (Mg2+-inhibited state, due to Mg2+ binding at S1), N (Noninhibited, divalent cation-free state), O (Open, Ca2+-activated state), and I (Inactivated states, due to either Ca2+ or Mg2+ binding at S2). For each state, the ion occupying the Ca2+ activation/Mg2+ inhibition site (S1) is shown on the left, and the ion occupying the Ca2+ or Mg2+ inactivation site (S2) is shown on the right. Mg2+ must first dissociate from S1 (step 1) before Ca2+ can activate the channel, so Mg2+ binding at S1 inhibits channel activation by Ca2+. Ca2+ binding at S1 (step 2) of the ligand-free channel opens the channel. Note that steps 1 and 2 of Scheme 2 correspond exactly to steps 1 and 2 of our minimal scheme S1.
Figure 12.
Model of Ca2+ and Mg2+ binding on the RyR (Scheme 2). This functional scheme is based on two divalent ion binding sites, S1 and S2, according to the terminology of Laver et al. (1997). S1 is a higher affinity site responsible for calcium activation of the RyR. S2 is a lower affinity site involved in the inactivation of the channel. In this model, the RyR is represented by four different conformations. M is the state of the channel that corresponds to inhibition by Mg2+ binding at S1. N is an intermediate state where none of the sites are occupied. O is the open state of the channel when calcium is bound to S1. Finally, I represents the inactivated forms of the channel in which S2 is occupied either by Ca2+ or Mg2+. Dashed arrows are used to indicate unlikely transitions.
Steps 3–10 in Scheme 2 complete the steps implied by the dashed arrows in Scheme S1. Step 3 represents Ca2+-dependent inactivation of the open channel due to Ca2+ binding to S2 as a result of high local [Ca2+] in the immediate vicinity of the open channel. Since this high local [Ca2+] is produced as an obligatory result of channel opening (Simon and Llinas, 1985), it forces step 3 to go in the forward direction (to the right in Scheme 2) and drives the cycle (steps 1–6) in Scheme 2 in the forward (counterclockwise) direction. The high local [Ca2+] in the vicinity of Ca2O also effectively eliminates the likelihood of attaining the state Ca2OMg2, which is thus not included in Scheme 2. The remaining states and transitions in Scheme 2 basically correspond to the states evaluated recently by Laver et al. (1997) in terms of Mg2+ inhibition of Ca2+ activation of the channel by binding at site 1 and inactivation of the channel by the action of Mg2+ or Ca2+ binding at site 2, where both ions have the same effect. Steps 8 and 9 of Scheme 2 are represented by dashed arrows to indicate that Mg2+ occupancy of the lower affinity site (S2) without occupancy of the higher affinity site (S1) would be unlikely. Note that despite its apparent complexity, Scheme 2 is itself a simplified version of a possibly more complete scheme that might include single and mixed ion occupancy of each class of site as well as details of the kinetic rate constants between states and time courses of local changes in ion concentrations.
In resting intact muscle fibers, the myoplasmic free [Mg2+] is ∼1 mM and the myoplasmic [Ca2+] is ∼0.1 μM. Under these conditions, the lower affinity Ca2+ or Mg2+ binding sites (S2), which mediate Ca2+ or Mg2+ inactivation of the SR calcium release channel, and which have similar Ca2+ and Mg2+ dissociation constants in the millimolar range (Meissner, 1994), would be more than half free of divalent cations. Thus, an appreciable fraction of the SR calcium release channels would not be in the Ca2+ or Mg2+ inactivated state in a resting fiber. In contrast, the higher affinity sites (S1), which mediate Ca2+ activation of the channels by calcium-induced calcium release (CICR), and at which Mg2+ inhibits this activation, would be largely occupied by Mg2+ and thereby inhibited from binding Ca2+ and opening the channel. Such Mg2+ inhibition in a resting fiber would be consistent with the low frequency of spontaneous events observed in polarized voltage clamped fibers (Klein et al., 1996; Lacampagne et al., 1996) or in fully depolarized, notched fibers (present results). In bilayers, the mean single channel open-time decreases in the presence of millimolar Mg2+ due to the Mg2+ binding at S2 causing channel inactivation, whereas Mg2+ binding at S1 does not decrease channel open time (Laver et al., 1997). The constancy of event rise times observed here in muscle fibers exposed to various myoplasmic [Mg2+] would thus be consistent with Mg2+ binding at site 1 in our experiments. If activation of the voltage sensors were to decrease the Mg2+ affinity of these sites according to the ideas of Lamb and Stephenson (1991), then Mg2+ inhibition in resting fibers might be overcome by voltage sensor activation.
Calcium Activation of Channel Activity in Reduced [Mg2+]
In the present paper, we have attributed the increase in event frequency in decreased [Mg2+] to decreased Mg2+ inhibition of Ca2+ activation of the channel (Scheme 2, step 2) by CICR. We have also previously suggested that relatively larger events could be produced if the high local [Ca2+] resulting from one open channel could activate one or more neighboring channels by CICR (Klein et al., 1996). The original suggestion that activation of neighboring channels by CICR could give rise to larger amplitude events was related to the possible activation of alternate channels not coupled to voltage sensors (Block et al., 1988) by calcium efflux from neighboring channels that are directly activated by voltage sensors. It might also be anticipated that the increased spontaneous event frequency observed here in decreased [Mg2+] would be accompanied by an increase in the mean event amplitudes due to increased activation of neighboring channels by CICR. However, an increase in event amplitudes in decreased [Mg2+] was clearly not observed in these experiments.
One possible interpretation of the observed lack of effect of [Mg2+] on the event amplitudes might be that over the range of [Mg2+] used and under the conditions of these experiments the probability that a channel was free of Mg2+ was very low, even at the lowest [Mg2+] studied, so the probability of two neighboring channels being free of magnesium at the same time was negligible. Thus, even though the probability of channel opening increased with decreasing [Mg2+], there would have been an insignificant probability that a channel neighboring the open channel would be Mg2+-free at the same time. In that case, there would be no increase in probability that a single open channel would activate its neighbor as [Mg2+] was decreased, and the event amplitudes would be independent of [Mg2+] as observed, even though the open channel was activated by CICR after dissociation of Mg2+ from the channel.
An alternative interpretation of the [Mg2+] independence of the event amplitudes might be that each detected event consists of the opening of not a single channel, but of all of the contiguous channels within a region of close junctional apposition of the TT and SR (∼30–40 channels; Protasi, F., and C. Franzini-Armstrong, personal communication). Such entire unit activation could conceivably be achieved by propagation of calcium-induced calcium release (Stern et al., 1997). In this case, each discrete event would already be maximal after the spontaneous opening of any one of the channels within the coupling unit, and the amplitude of events would again be independent of [Mg2+] as observed. Thus, two extreme alternative possibilities, either no recruitment of additional channels or full recruitment of all channels in a coupling unit, might in principal account for the [Mg2+] independence of the event amplitudes observed here. However, the implications of these two alternatives for the interpretation of the single events are very different. In one case, each event would be generated by the calcium efflux via a single channel, whereas in the other case each event would be generated by the total calcium efflux via the 30–40 channels comprising the TT to SR coupling units in frog twitch fibers. In terms of Scheme 2, activation of all channels in the coupling unit would imply a high probability that Mg2+ would dissociate from site S1 of all channels within the event rise time in order for each channel to be activated by the high local [Ca2+] from the neighboring channels. However, since S1 has a relatively high affinity for Mg2+, it might be expected that the rate of Mg2+ dissociation from S1 might not be fast enough for the sites to be freed of Mg2+ within the event rise time of ∼6 ms. In that case, full activation of all channels in a coupling unit in each event would be a less likely alternative.
Other Implications of the Model for Mg2+ and Ca2+ Control of SR Calcium Release Events
In general, repeated events at the same triad are relatively rare at low event rates, indicating that repeated openings of a given unit are unlikely. This would be accounted for in Scheme 2 by having the dissociation rate of Ca2+ faster from S1 (step 4, forward) than from S2 of Ca2ICa2(step 3, reverse) and by having the binding of Mg2+ to ICa2 (step 5, forward) be faster than Ca2+ dissociation from ICa2 (Step 10). However, if some property of the RyR were altered such that either of these conditions were reversed, then multiple reopenings of the same release unit could occur, as we have occasionally observed (high value in Fig 2 B; see results).
The individual release events activated by lowering myoplasmic [Mg2+] in the present paper are very similar in rise time and amplitude to the release events observed during depolarization of partially reprimed voltage clamped fibers studied with the same confocal system as used in the present experiments (Lacampagne et al., 1996; Klein et al., 1997). This similarity could be accounted for if voltage sensor activation promoted dissociation of Mg2+ (Lamb and Stephenson, 1991) from the Mg2+-inhibited state Mg2M. In that case, the actual steps in channel opening and inactivation would be identical for events activated by the voltage sensors or by lowering [Mg2+], consistent with the experimentally observed similarity of voltage- and ligand-activated events. Note, however, that if every opened channel closed by the same (Ca2+-dependent) inactivation mechanism, independent of the opening mechanism, the event duration and amplitude could also be the same for voltage- and ligand- activated events, even if the two activation mechanisms involved different reaction steps for channel opening.
Notched Fiber Preparation for Recording Ligand-modulated Ca2+ Release Events
The notched fiber preparation provides a convenient tool for studying ligand modulation of SR Ca2+ release events. This preparation was first used in a previous study for measuring the Ca2+ dependence of spark frequency (Klein et al., 1996) and is described in more detail in the present article. We have improved the optical conditions for recording calcium sparks by mechanically clamping the notched fibers directly against the glass coverslip floor of the chamber, thereby avoiding the Vaseline used previously to anchor the fiber in the chamber. This provided a clearer optical path, lower background fluorescence, improved spark resolution, and, consequently, greater values of ΔF/F of calcium sparks than in our initial report (Klein et al., 1996). The notches in the membrane provide a path for diffusion of solutes from the bath to nearby regions of the cytoplasmic compartment of the fiber where the sarcomeric structure was not disturbed and from which our measurements were made. The presence of the notches also eliminates the transmembrane potential, which should induce full inactivation of the voltage sensors normally involved in the activation of calcium release by depolarization (see Schneider, 1994, for references). Furthermore, the addition of nifedipine, which inactivates the voltage sensors, did not alter the frequency of SR calcium release events, indicating that the voltage sensors were in fact fully inactivated. However, it is important to note that in the present experiments we cannot distinguish between events initiated by the opening of SR channels that may be coupled or not coupled to the TT voltage sensors (Block et al., 1988). In contrast to vesicle or bilayer studies, in notched fibers the activity of RyR calcium release channels can be studied while maintaining the basic integrity of the fiber and of the modulation system for controlling the release channels. However, under standard conditions, the frequency of events is extremely low. It is thus of interest to consider notched fibers exposed to decreased [Mg2+] solutions as a possible tool for future pharmacological studies since the increase in event frequency induced by the removal of magnesium ions does not affect individual spark properties.
Acknowledgments
We thank Naima Carter and Mark Chang for technical assistance, Gabe Sinclair and Walt Knapic for customization of optical and mechanical apparatus, and Ken Bagley for participating in some of the experiments.
This work was supported by research grants from the National Institutes of Health (R01-NS23346 to M.F. Schneider and R01-AR44197 to M.G. Klein), and by funds from the University of Maryland School of Medicine and the University of Maryland Graduate School, Baltimore, MD. A. Lacampagne was partially supported by le Conseil Régional du Centre, France, and by the Melzer Foundation.
Footnotes
Portions of this work were previously published in abstract form (Lacampagne, A., M.G. Klein, K. Bagley, and M.F. Schneider. 1997. Biophys. J. 72:A43).
Abbreviations used in this paper: CICR, calcium-induced calcium release; RyR, ryanodine receptor; SR, sarcoplasmic reticulum; TT, transverse tubule.
references
- Block B, Imagawa T, Campbell KP, Franzini-Armstrong C. Structural evidence for direct interaction between the molecular components of transverse tubule/sarcoplasmic reticulum junction in skeletal muscle. J Cell Biol. 1988;107:2587–2600. doi: 10.1083/jcb.107.6.2587. [DOI] [PMC free article] [PubMed] [Google Scholar]
- Cheng H, Lederer WJ, Cannell MB. Calcium sparks— elementary events underlying excitation–contraction coupling in heart-muscle. Science. 1993;262:740–744. doi: 10.1126/science.8235594. [DOI] [PubMed] [Google Scholar]
- Endo M, Tanaka M, Ogawa Y. Calcium-induced calcium release from the sarcoplasmic reticulum of skinned skeletal muscle fibers. Nature. 1970;228:34–36. doi: 10.1038/228034a0. [DOI] [PubMed] [Google Scholar]
- Endo M. Calcium release from sarcoplasmic reticulum. Curr Top Membr Transp. 1985;25:181–229. [Google Scholar]
- Ford LE, Podolsky RJ. Regenerative calcium release within muscle cells. Science. 1970;167:58–59. doi: 10.1126/science.167.3914.58. [DOI] [PubMed] [Google Scholar]
- Hain J, Nath S, Mayrleitner M, Fleischer S, Schindler H. Phosphorylation modulates the function of the calcium release channel of sarcoplasmic reticulum from skeletal muscle. Biophys J. 1994;67:1823–1833. doi: 10.1016/S0006-3495(94)80664-2. [DOI] [PMC free article] [PubMed] [Google Scholar]
- Herrmann-Frank A. Caffeine and Ca2+-induced mechanical oscillation in isolated skeletal muscle of the frog. J Muscle Res Cell Mot. 1989;10:437–445. doi: 10.1007/BF01771819. [DOI] [PubMed] [Google Scholar]
- Herrmann-Frank A, Varsànyi M. Enhancement of Ca2+release channel activity by phosphorylation of the skeletal muscle ryanodine receptor. FEBS Lett. 1993;332:237–242. doi: 10.1016/0014-5793(93)80640-g. [DOI] [PubMed] [Google Scholar]
- Herrmann-Frank A, Richter M, Sarkozki S, Mohr U, Lehmann-Horn F. 4-chloro-m-cresol, a potent and specific activator of the skeletal muscle ryanodine receptor. Biochim Biophys Acta. 1996;1289:31–40. doi: 10.1016/0304-4165(95)00131-x. [DOI] [PubMed] [Google Scholar]
- Jacquemond V, Schneider MF. Effects of low myoplasmic Mg2+on calcium binding by parvalbumin and calcium uptake by the sarcoplasmic reticulum in frog skeletal muscle. J Gen Physiol. 1992a;100:115–135. doi: 10.1085/jgp.100.1.115. [DOI] [PMC free article] [PubMed] [Google Scholar]
- Jacquemond V, Schneider MF. Low myoplasmic Mg2+potentiates calcium release during depolarization in frog skeletal muscle fibers. J Gen Physiol. 1992b;100:137–154. doi: 10.1085/jgp.100.1.137. [DOI] [PMC free article] [PubMed] [Google Scholar]
- Jiang, Y.H., M.G. Klein, and M.F. Schneider. 1998. Numerical simulation of Ca2+ ‘sparks' in skeletal muscle. Biophys. J. In press. [DOI] [PMC free article] [PubMed]
- Jong DS, Pape PC, Chandler WK. Calcium inactivation of calcium release in frog cut muscle fibers that contain millimolar EGTA and Fura-2. J Gen Physiol. 1995;106:337–388. doi: 10.1085/jgp.106.2.337. [DOI] [PMC free article] [PubMed] [Google Scholar]
- Klein MG, Cheng H, Santana LF, Jiang YH, Lederer WJ, Schneider MF. Two mechanisms of quantized calcium release in skeletal muscle. Nature. 1996;379:455–458. doi: 10.1038/379455a0. [DOI] [PubMed] [Google Scholar]
- Klein MG, Lacampagne A, Schneider MF. Voltage dependence of the pattern and frequency of discrete Ca2+release events after a brief repriming in frog skeletal muscle. Proc Nat Acad Sci USA. 1997;94:11061–11066. doi: 10.1073/pnas.94.20.11061. [DOI] [PMC free article] [PubMed] [Google Scholar]
- Lacampagne A, Lederer WJ, Schneider MF, Klein MG. Repriming and activation alter the frequency of stereotyped discrete Ca2+release events in frog skeletal muscle. J Physiol (Camb) 1996;497:581–588. doi: 10.1113/jphysiol.1996.sp021791. [DOI] [PMC free article] [PubMed] [Google Scholar]
- Lamb GD, Stephenson DG. Effect of Mg2+ on the control of Ca2+release in skeletal muscle of the toad. J Physiol (Camb) 1991;434:507–528. doi: 10.1113/jphysiol.1991.sp018483. [DOI] [PMC free article] [PubMed] [Google Scholar]
- Lamb GD, Stephenson DG. Effects of intracellular pH and [Mg2+] on excitation–contraction coupling in skeletal muscle fibers of the rat. J Physiol (Camb) 1994;478:331–339. doi: 10.1113/jphysiol.1994.sp020253. [DOI] [PMC free article] [PubMed] [Google Scholar]
- Laver DR, Curtis BA. Response of ryanodine receptor channels to Ca2+steps produced by rapid solution exchange. Biophys J. 1996;71:732–741. doi: 10.1016/S0006-3495(96)79272-X. [DOI] [PMC free article] [PubMed] [Google Scholar]
- Laver DR, Baynes TM, Dulhunty AF. Magnesium inhibition of ryanodine receptor calcium channels: evidence for two independent mechanisms. J Membr Biol. 1997;156:213–229. doi: 10.1007/s002329900202. [DOI] [PubMed] [Google Scholar]
- Ma J. Block by ruthenium red of the ryanodine-activated calcium release channel of skeletal muscle. J Gen Physiol. 1993;102:1031–1056. doi: 10.1085/jgp.102.6.1031. [DOI] [PMC free article] [PubMed] [Google Scholar]
- Meissner G. Adenine nucleotide stimulation of Ca2+-induced Ca2+release in sarcoplasmic reticulum. J Biol Chem. 1984;259:2365–2374. [PubMed] [Google Scholar]
- Meissner G. Ryanodine activation and inhibition of the Ca2+release channel of sarcoplasmic reticulum. J Biol Chem. 1986;261:6300–6306. [PubMed] [Google Scholar]
- Meissner G, Darling E, Eveleth J. Kinetics of rapid Ca2+ release by sarcoplasmic reticulum. Effects of Ca2+, Mg2+, and adenine nucleotides. Biochemistry. 1986;25:236–244. doi: 10.1021/bi00349a033. [DOI] [PubMed] [Google Scholar]
- Meissner G. Ryanodine receptors/Ca2+ release channels and their regulation by endogenous effectors. Annu Rev Physiol. 1994;56:485–508. doi: 10.1146/annurev.ph.56.030194.002413. [DOI] [PubMed] [Google Scholar]
- O'Sullivan WJ, Perrin DD. The stability constants of metal-adenine nucleotides complexes. Biochemistry. 1964;3:18–26. doi: 10.1021/bi00889a005. [DOI] [PubMed] [Google Scholar]
- Pape PC, Konishi M, Baylor SM. Valinomycin and excitation–contraction coupling in skeletal muscle fibers of the frog. J Physiol (Camb) 1992;449:219–235. doi: 10.1113/jphysiol.1992.sp019083. [DOI] [PMC free article] [PubMed] [Google Scholar]
- Pratusevich VR, Balke CW. Factors shaping the confocal image of the calcium spark in cardiac muscle cells. Biophys J. 1996;71:2942–2957. doi: 10.1016/S0006-3495(96)79525-5. [DOI] [PMC free article] [PubMed] [Google Scholar]
- Rios E, Pizzaro G. Voltage sensor of excitation–contraction coupling in skeletal muscle. Physiol Rev. 1992;71:849–908. doi: 10.1152/physrev.1991.71.3.849. [DOI] [PubMed] [Google Scholar]
- Rousseau E, LaDine J, Liu Q-Y, Meissner G. Activation of the Ca2+release channel of skeletal muscle sarcoplasmic reticulum by caffeine and related compounds. Arch Biochem Biophys. 1988;267:75–86. doi: 10.1016/0003-9861(88)90010-0. [DOI] [PubMed] [Google Scholar]
- Rousseau E, Meissner G. Single cardiac sarcoplasmic reticulum Ca2+-release channel: activation by caffeine. Am J Physiol. 1989;256:H328–H333. doi: 10.1152/ajpheart.1989.256.2.H328. [DOI] [PubMed] [Google Scholar]
- Rousseau E, Pinkos J, Savaria D. Functional sensitivity of the native skeletal Ca2+-release channel to divalent cations and Mg-ATP complex. Can J Pharm. 1992;70:394–402. doi: 10.1139/y92-049. [DOI] [PubMed] [Google Scholar]
- Schneider MF. Control of calcium release in functioning skeletal muscle fibers. Annu Rev Physiol. 1994;56:463–484. doi: 10.1146/annurev.ph.56.030194.002335. [DOI] [PubMed] [Google Scholar]
- Schneider MF, Klein MG. Sarcomeric calcium sparks activated by fiber depolarization and by cytosolic Ca2+in skeletal muscle. Cell Calcium. 1996;20:123–128. doi: 10.1016/s0143-4160(96)90101-3. [DOI] [PubMed] [Google Scholar]
- Simon SM, Llinas RR. Compartimentalization of the submembrane calcium activity during calcium influx and its significance in transmitter release. Biophys J. 1985;48:485–498. doi: 10.1016/S0006-3495(85)83804-2. [DOI] [PMC free article] [PubMed] [Google Scholar]
- Smith JS, Coronado R, Meissner G. Sarcoplasmic reticulum contains adenine nucleotide-activated calcium channels. Nature (Camb) 1985;316:446–449. doi: 10.1038/316446a0. [DOI] [PubMed] [Google Scholar]
- Smith JS, Coronado R, Meissner G. Single channel measurements of the calcium release channel from skeletal muscle sarcoplasmic reticulum. J Gen Physiol. 1986;88:573–588. doi: 10.1085/jgp.88.5.573. [DOI] [PMC free article] [PubMed] [Google Scholar]
- Sonnleitner A, Copello J, Fleischer S, Sorrentino V, Schindler H. Gating of the ryanodine receptor 1, 2 and 3 (RyR1, RyR2, RyR3) by ATP in the absence of calcium ions. Biophys J. 1997;72:A375. . (Abstr.) [Google Scholar]
- Stern MD, Pizzaro G, Ríos E. Local control model of excitation–contraction coupling in skeletal muscle. J Gen Physiol. 1997;110:415–440. doi: 10.1085/jgp.110.4.415. [DOI] [PMC free article] [PubMed] [Google Scholar]
- Tsugorka A, Rios E, Blatter LA. Imaging elementary events of calcium release in skeletal muscle cells. Science. 1995;269:1723–1726. doi: 10.1126/science.7569901. [DOI] [PubMed] [Google Scholar]
- Wang J, Best PM. Inactivation of the sarcoplasmic reticulum calcium channel by protein kinase. Nature. 1992;359:739–741. doi: 10.1038/359739a0. [DOI] [PubMed] [Google Scholar]
- Xu L, Mann G, Meissner G. Regulation of cardiac Ca2+ release channel (ryanodine receptor) by Ca2+, H+, Mg2+, and adenine nucleotides under normal and simulated ischemic conditions. Circ Res. 1996;79:1100–1109. doi: 10.1161/01.res.79.6.1100. [DOI] [PubMed] [Google Scholar]


