

Abstract
Computational design of surface charge–charge interactions has been demonstrated to be an effective way to increase both the thermostability and the stability of proteins. To test the robustness of this approach for proteins with predominantly β-sheet secondary structure, the chicken isoform of the Fyn SH3 domain was used as a model system. Computational analysis of the optimal distribution of surface charges showed that the increase in favorable energy per substitution begins to level off at five substitutions; hence, the designed Fyn sequence contained four charge reversals at existing charged positions and one introduction of a new charge. Three additional variants were also constructed to explore stepwise contributions of these substitutions to Fyn stability. The thermodynamic stabilities of the variants were experimentally characterized using differential scanning calorimetry and far-UV circular dichroism spectroscopy and are in very good agreement with theoretical predictions from the model. The designed sequence was found to have increased the melting temperature, ΔT m = 12.3 ± 0.2°C, and stability, ΔΔG(25°C) = 7.1 ± 2.2 kJ/mol, relative to the wild-type protein. The experimental data suggest that a significant increase in stability can be achieved through a very small number of amino acid substitutions. Consistent with a number of recent studies, the presented results clearly argue for a seminal role of surface charge–charge interactions in determining protein stability and suggest that the optimization of surface interactions can be an attractive strategy to complement algorithms optimizing interactions in the protein core to further enhance protein stability.
Keywords: rational design, protein stability, charge–charge interactions, protein surface
The design of proteins with improved thermodynamic stability has been the focus of many protein engineering studies. Due to the widely accepted notion that the interactions in the core of a protein play a major role in determining protein stability (Dill 1990; Makhatadze and Privalov 1995), most design approaches have been focused on optimizing interactions in the core, and, as a result, the protein surface has often been ignored in such studies. However, core optimization algorithms have challenges associated with accurately modeling interactions in the tightly packed interior of proteins (Hurley et al. 1992; Desjarlais and Handel 1995; Lazar et al. 1997). The protein surface, on the other hand, offers a much smaller set of interactions to be optimized but was largely ignored in design procedures due to the belief that residues on the surface do not contribute significantly to stability, as their solvent exposure in the native and unfolded states are similar. However, in the native state of a protein, surface residues do participate in a number of tertiary interactions, such as hydrogen bonding or long-range electrostatic interactions. Residues that participate in these types of interactions will have different contributions to the stability of the native and the unfolded states of a protein. Since surface residues are more amenable to substitution than those in the core, they should provide effective means to manipulate the stability of a protein without affecting the structural integrity of the protein. Indeed, it has been demonstrated that surface charge–charge interactions can be successfully exploited to modulate protein stability. For example, it has been shown that neutralizing or reversing the charges of individual residues with unfavorable interaction energies successfully enhances the stability (Grimsley et al. 1999; Loladze et al. 1999; Perl et al. 2000; Spector et al. 2000; Sanchez-Ruiz and Makhatadze 2001; Lee et al. 2005; Permyakov et al. 2005; Gribenko and Makhatadze 2007). In addition, it has been shown that further increases in stability can be gained by optimizing the entire surface charge distribution (Strickler et al. 2006).
SH3 domains are small protein–protein interaction modules that have been the subject of numerous folding studies. Structurally, the SH3 domains are comprised of two three-stranded β-sheets, orthogonally packed against one another (Fig. 1A) and their folding behavior is well approximated by a simple two-state reaction, where a polypeptide chain folds into its native state by passing through a high energy transition state barrier in the absence of populated folding intermediates (Larson et al. 2002; Northey et al. 2002a,b; Di Nardo et al. 2003; Zarrine-Afsar et al. 2006). In the present study, the Fyn SH3 domain is used as a model system for the rational optimization of surface charge–charge interactions to increase the stability of this protein. The Fyn SH3 domain with increased stability can serve an important purpose. The wild-type (WT) Fyn SH3 domain has a higher calculated energy of charge–charge interactions (ΔG qq), compared to any other protein previously optimized by this approach (Loladze et al. 1999; Makhatadze et al. 2004; Lee et al. 2005; Permyakov et al. 2005; Strickler et al. 2006; Gribenko and Makhatadze 2007), hereby providing insights into how much stability can be gained through the optimization of proteins possessing highly unfavorable charge–charge interaction energies. In this article, we report the results of experimental thermodynamic studies of computationally redesigned variants of the Fyn SH3 domain with optimized surface charge–charge interactions.
Figure 1.
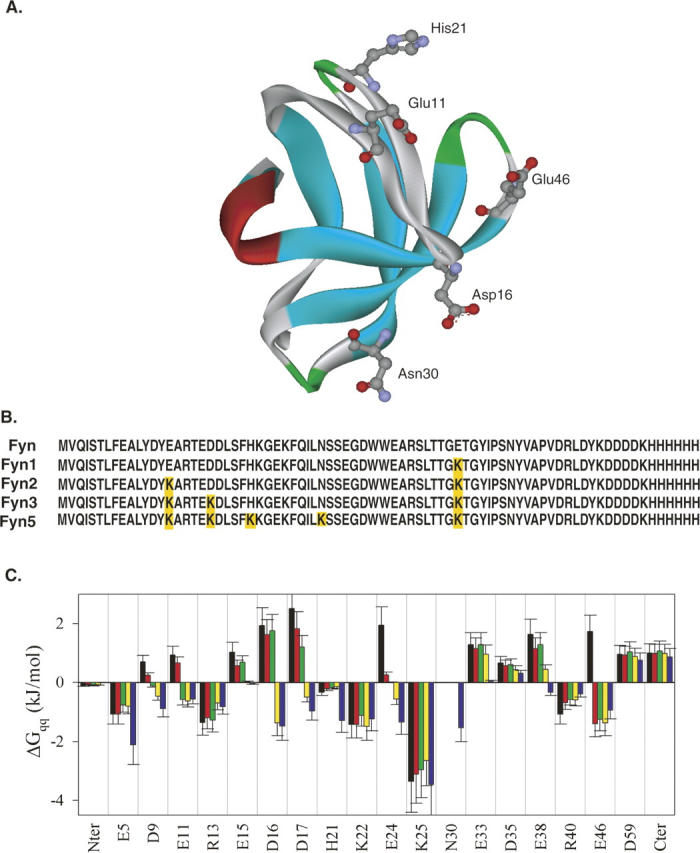
Primary sequence and the tertiary structure and charge–charge interaction energies of Fyn. (A) Cartoon representation of the three-dimensional structure of the Fyn SH3 domain (1FYN). The sites selected for substitution are represented with the ball-and-stick model. (B) The sequence alignment of the Fyn variants with the selected substitution sites highlighted in yellow. (C) Comparison of the energies of charge–charge interactions in the wild-type and designed sequences of Fyn at pH 7.0. Each bar represents the total energy of charge–charge interactions for that residue with all other charged residues in the protein, averaged over the ensemble of 11 structures. The error bars represent the standard deviations of the averaged values. Favorable interactions have negative values of ΔG qq, while positive values represent unfavorable ones. Black bars, wild type; red bars, Fyn1; green bars, Fyn2; yellow bars, Fyn3; blue bars, Fyn5 (see text for construct nomenclature).
Results and Discussion
Modeling charge–charge interactions in the Fyn SH3 domain
To explore the possibility of optimizing surface charge–charge interactions in the Fyn SH3 domain we first evaluated the energetics of the charge–charge interactions in this protein. Figure 1C shows the energies of charge–charge interactions for the wild-type Fyn SH3 domain, as calculated using the TK-SA model (Ibarra-Molero et al. 1999). These results indicate that the wild-type protein has many unfavorable charge–charge interactions, defined by positive values of ΔG qq, suggesting that, in this protein, charge–charge interactions are not fully optimized. The neutralization or reversal of the existing charges will lead to the unfavorable interactions becoming favorable. Additional favorable interactions can be gained by introducing new charges at previously uncharged positions on the protein surface. To find the most favorable combinations of surface charges, a genetic algorithm of search (Strickler et al. 2006) combined with the TK-SA model for calculation of energy of charge–charge interactions was used as described previously (Strickler et al. 2006). In addition to the existing charged residues, three neutral polar positions on the surface of the Fyn SH3 domain (Q27, N30, and Q53) were also included in the optimization algorithm. The dependence of the predicted energy of the charge–charge interactions on the number of the total substitutions made is shown in Figure 2. It is evident that the interaction energy initially becomes more favorable with increasing the number of substitutions, but begins to level off after five substitutions. One of the sequences with five substitutions (Fyn5—E11K/D16K/H21K/N30K/E46K, see also Fig. 1B) that is predicted to have favorable charge–charge interactions was selected for further experimental characterization. In the Fyn5 variant, four of the substitutions were at existing charged residues, while the fifth introduced a new charge at N30. Structurally, most of these sites are found in the loop regions of the protein (Fig. 1A). E11, D16, and H21 are all located in the distal loop, between the first and the second β-strands, D16 is located near the β-turn in this region, while E11 is closer to the first β-strand, and H21 is near the second β-strand. N30 is the first residue in the turn region between the second and third β-strands. E46 is considered to be the N-terminal residue of the fourth β-strand. The effect of the substitutions on the predicted energy of charge–charge interactions (on a per residue basis) in the optimized sequence, Fyn5, is compared to that of the wild type in Figure 1C. It is evident that the E11, D16, and E46 residues have unfavorable interaction energies in the wild-type protein that are predicted to become favorable upon charge reversals in the optimized Fyn5 variant. The H21 residue is already favorable in the wild-type protein but is expected to become much more so in the context of the other substitutions in the Fyn5 variant. The positive charge introduction at the N30 position is also predicted to contribute favorably to the total ΔG qq of the Fyn SH3 domain.
Figure 2.

Evaluation of the effectiveness of the genetic algorithm to find charge distributions at pH 7.0 that have increasing favorable charge–charge interaction energies relative to wild-type Fyn. The interaction energies are calculated by the TK-SA model. Each sequence, represented by black crosshairs, is characterized by the energy of charge–charge interactions and the number of substitutions relative to the wild-type protein. Note that the more favorable energies have smaller values of ΔG qq. The designed and wild-type sequences that were characterized experimentally are represented by white circles.
In order to examine the additivity of the contributions of the E11K, D16K, H21K, N30K, and E46K substitutions to the stability of the designed Fyn SH3 domain, we also characterized the following variants: Fyn1—E46K, Fyn2—E46K/E11K, and Fyn3—E46K/E11K/D16K (see also Fig. 1B). The Fyn1 variant contains only one substitution E46K. This position is unfavorable in the wild-type protein, so reversing the charge at this position is expected to cause the interaction energies to become favorable (see Fig. 1C). The Fyn2 construct has two substitutions, E11K/E46K, and is predicted to have favorable interaction energies at both positions, as illustrated in Figure 1C. The increase in the overall favorable energy of charge–charge interactions, however, is not predicted to be significantly different between the Fyn1 and Fyn2 variants (Fig. 2). The Fyn3 variant has three substitutions, E11K/D16K/E46K, and exhibits favorable predicted interaction energies at three positions, unlike the WT protein that possessed unfavorable interactions at these positions (Fig. 1C). This construct is also predicted to have a much more favorable overall energy of charge–charge interactions compared to both Fyn1 and Fyn2 variants (Fig. 2). Therefore, the predicted stabilities of the variants examined in this study are expected to conform to the following rank order: Fyn5 > Fyn3 > Fyn2 ≈ Fyn1 > WT.
Experimental evaluation of the role of charge–charge interactions in the stability of the Fyn SH3 domain
The predicted rank order in stability for the designed variants of the Fyn SH3 domain was experimentally tested using several biophysical methods, as described below. Figure 3A compares the differential scanning calorimetry (DSC) profiles of the wild-type Fyn SH3 domain with all of the designed variants, obtained at neutral pH. These profiles clearly show that all variants have increased thermostability relative to the WT protein, as evidenced by an increase in the temperature of the heat absorption maximum (see Fig. 3; Table 1). The Fyn5 variant has the highest transition temperature (T m), which is consistent with the predictions based on the calculations of charge–charge interactions (Fig. 2). The Fyn1 and Fyn2 variants have similar T m, which is in agreement with the prediction results given in Figure 2, suggesting that they do not possess significantly different charge–charge interaction energies. Furthermore, the experimentally obtained T m of the Fyn3 construct conforms to the predicted order of stability based on the computed energies of charge–charge interactions.
Figure 3.

Comparison of stabilities of the Fyn variants. DSC profiles of Fyn variants at pH 7.0. The open symbols represent experimental data (circles, wild type; triangles, Fyn1; diamonds, Fyn2; squares, Fyn3; inverted triangles, Fyn5). Only every fifth data point is shown, for clarity. The solid lines represent the global fit of the data to a two-state unfolding model. (Inset) The fraction of unfolded protein (FU) as a function of temperature for CD (symbols, same as above) and DSC (solid lines).
Table 1.
Thermodynamic parameters of unfolding for the Fyn variants at pH 7.0

The observed increase in the transition temperature of Fyn SH3 variants can be due to the optimized energetics of charge–charge interactions, but can also result from changes in the structure and/or oligomerization state of the protein. The structural properties of the designed variants of Fyn SH3 domain were characterized by circular dichroism spectroscopy. The CD spectra of the wild-type and variant proteins were similar, illustrating that the substitutions did not have a significant effect on the protein structure (see Fig. S2 of the Supplemental material). Analytical ultracentrifugation experiments were carried out to eliminate the possibility that amino acid substitutions change in the oligomerization state of the proteins. Analysis revealed that proteins remain monomeric under experimental conditions (see Fig. S3 of the Supplemental material). Therefore, the observed differences in the transition temperature cannot be attributed to changes in the structure or in the oligomerization state of the Fyn SH3 variants.
In addition to the transition temperature values, DSC scans can also provide insight into whether the two-state folding mechanism of the WT protein is retained in the designed variants. For this purpose, DSC profiles were fit to a two-state unfolding model, and the validity of this model was tested in two ways. First, the van't Hoff enthalpies (ΔH VH) extracted from fitting the data were compared to the calorimetric enthalpies (ΔH cal) that are measured directly by DSC (Table 1). The ΔH VH and ΔH cal are within the experimental error of 5% for each variant, suggesting that these proteins do unfold via a two-state mechanism (Privalov and Khechinashvili 1974), as previously noted for the WT Fyn SH3 domain (Larson et al. 2002; Northey et al. 2002a,b; Di Nardo et al. 2003; Zarrine-Afsar et al. 2006). Second, the thermal unfolding of the variants was monitored using far-UV circular dichroism spectroscopy and demonstrated that the transition temperature obtained from these experiments are similar to the T m value measured by DSC. The far-UV CD unfolding experiments monitor changes in the secondary structure upon unfolding, while the DSC experiments measure the energetics of global changes in the protein conformation. If the Fyn variants unfold via a two-state mechanism, then the stabilities and T m measured by each technique should be similar. Comparison of the fractions of unfolded proteins as a function of temperature obtained from CD and DSC experiments (Fig. 3, inset) shows that they are rather similar, providing further evidence that the two-state unfolding model is valid for all Fyn variants analyzed in this study.
Comparing the thermodynamic stabilities (ΔG) of the Fyn variants at the same temperatures requires the knowledge of the changes in heat capacity upon unfolding, ΔCp. The ΔCp defines the temperature dependence of both the enthalpy of unfolding, ΔCp = (dΔH/dT), and the entropy of unfolding, ΔCp/T = (dΔS/dT). Therefore, ΔCp is also necessary for defining the temperature dependence of the stability function, ΔG(T) = ΔH(T) − T · ΔS(T). Empirically, it has been noted that ΔCp is defined by the amount of polar and nonpolar surface area that is buried in the native state (Makhatadze and Privalov 1995; Myers et al. 1995). Consequently, substitutions on the surface of the Fyn SH3 domain are not expected to have a large effect on the ΔCp. Figure 4 shows the temperature dependence of the enthalpies of unfolding, ΔH(T m), for all Fyn variants. It appears that the enthalpies of unfolding of all variants follow the same function, suggesting that the ΔCp value is the same for all of the Fyn variants used in this study. The ΔCp estimated from the slope of the ΔH(T m) function is 3.6 ± 0.6 kJ/mol · K. This estimate of the ΔCp of the Fyn SH3 variants is consistent with ΔCp values of other proteins of similar size (Ibarra-Molero et al. 1999; Strickler et al. 2006). Moreover, it corresponds well to two previous estimates of ΔCp for the WT Fyn, 3.3 ± 0.4 kJ/mol · K (Filimonov et al. 1999) and 3.5 kJ/mol · K (Maxwell and Davidson 1998). The ΔCp value of 3.6 ± 0.6 kJ/mol · K was used to estimate ΔG for each Fyn variant at two different temperatures: 71.6°C and 25°C (Table 1). Importantly, the stability of the Fyn SH3 domain was increased by 8.3 ± 1.2 kJ/mol at 71.6°C and 7.1 ± 2.2 kJ/mol at 25°C by introducing only five substitutions on the protein surface.
Figure 4.

Dependence of the enthalpy of unfolding, ΔH(T m), on the transition temperature, T m, for the Fyn variants measured at pH 7.0. The error bars represent the estimated error of 5% for ΔH(T m). The solid line is the linear regression of the data. The slope of this line corresponds to the heat capacity change upon unfolding, ΔC P = 3.6 ± 0.6 kJ/mol.
Comparison between theory and experiment
To obtain quantitative insight into the additivity of the contribution of charge–charge interactions to the experimentally measured changes in stability, one needs to compare the change in stability upon stepwise substitutions. The Gibbs free energy of unfolding for each variant was calculated at the T m of the wild type using the Gibbs–Helmholtz equation (Equation 2, below). Figure 5 compares the experimentally measured differences in stability, ΔΔG exp = ΔG var − ΔG WT, with the calculated differences in stability expected from changes in the energy of charge–charge interactions, ΔΔG qq = ΔG WT,qq − ΔG var,qq. It is evident that the experimental data are very well correlated with the calculations (R = 0.96), suggesting that the optimization of surface charge–charge interactions is a valid approach to stabilizing proteins. The deviation of the slope of the best-fit line (m = 0.73) from unity suggests that the calculated changes in the energies of charge–charge interactions describe the overall changes in stability only qualitatively, not quantitatively. The data presented in Figure 5 also suggest that changes in thermostability can be qualitatively predicted using this computational approach, evidenced by the very good correlation between computed ΔΔG qq and experimentally measured differences in thermostability (ΔT m = T m,var − T m,WT).
Figure 5.

Comparison of experimentally measured changes in stability ΔΔG exp or thermostability (ΔT m) with those predicted by the TK-SA calculations, ΔΔG qq. The solid line represents perfect correlation (ΔΔG exp = ΔΔG qq). The dashed line represents the linear regression of the data (slope = 0.73).
The correlations between the experimental stability data (ΔΔG exp) and the theoretical calculations (ΔΔG qq) are generally not quantitative. This can be attributed to the simplicity and insufficient accuracy of the computational model used to calculate the energetics charge–charge interactions. In addition, this computational model does not attempt to quantify the effects of other types of interactions that are also important for stability, such as side-chain hydrophobicity and secondary structure propensity. However, the excellent correlation between the results of calculations and experiments (see Fig. 5) signals for a seminal role of charge–charge interactions in determining the stability of Fyn SH3 protein. It is also evident that the experimental stability data conforms to the relative rank order of the variants' stability observed in the calculations. Furthermore, the computational modeling has been able to successfully predict both the sign and, to a reasonable degree, the magnitude of the contribution of charge–charge interactions to the total protein stability. Of particular interest, the calculations predicted that the Fyn1 and Fyn2 variants would have comparable stabilities (Fig. 2), and the experimentally measured stabilities for these variants were found to be similar within the experimental error, as evident from Figure 5.
Finally, it has been demonstrated that it is possible to computationally identify the more energetically favorable combination of surface charge–charge interactions that leads to a significant increase in thermostability (stability) of over 12°C (∼8 kJ/mol). More importantly, the data presented here suggest that an increase in stability of such magnitude can be achieved with a small number of substitutions, as only five surface residues have been substituted in the designed Fyn SH3 domain.
While previously published design approaches have reported larger increases in stability than we observed here, these studies substituted over half of the amino acid residues of the protein in their design (Dantas et al. 2003; Zollars et al. 2006). Such dramatic changes in the sequence sometimes leads to unexpected consequences. For example, it was reported that one of the designed proteins was a dimer at the experimental concentrations, and, hence, the dimerization of the protein partly contributed to the observed increase in the stability (Dantas et al. 2007). In the case of Fyn SH3 domain, the designed variant is monomeric in solution, as determined by the analytical ultracentrifugation experiment, and appears to be structurally very similar to the wild-type protein (see Figs. S2 and S3 in Supplemental material). These data collectively suggest that the stabilization observed in the designed variant of the Fyn SH3 protein is likely to stem from the optimization of surface charge–charge interactions and is not from an altered dimeric state or a dramatic change in the protein structure. More interestingly, the magnitude of the upshift in T m between WT and designed sequence with a few surface mutations in this work (and elsewhere [Strickler et al. 2006]) is comparable to studies that have engineered stability through making a few substitutions in the hydrophobic cores of model proteins (reporting increases in stability of 10°C [Korkegian et al. 2005] or 10 kJ/mol [Bolon et al. 2003]). These observations serve to further support the idea that the rational design of surface charge–charge interactions is an effective strategy to complement core optimization algorithms to further enhance protein stability.
Concluding remarks
In the present work, the rational optimization of charge–charge interactions successfully increased the thermostability of the Fyn SH3 domain sequence with only a few substitutions. Furthermore, it was possible to predict the stepwise effects of substitutions on the stability of each variant. For Fyn, the energy of favorable charge–charge interactions was predicted to decrease after 13 substitutions (Fig. 2). A similar trend has also been observed for ubiquitin: Exhaustive calculations performed on every ionizable residue in ubiquitin indicate that the favorable energy begins to decrease after 10 substitutions (Strickler et al. 2006). The finding that the increase in favorable interactions begins to level off suggests there is a limit to the amount of stability that can be gained for a protein through the optimization of surface charge–charge interactions. This limit is a result of the fact that the native topology defined by a given protein sequence occupies a finite space. The addition of new charges into this space will always involve the introduction of both favorable and unfavorable interaction energies. If the substitution sites are chosen appropriately, the energy of favorable interactions will be larger than the unfavorable interaction energy. However, when the charge density increases beyond a certain point, the introduction of a new charge into the limited space of the native topology will lead to a balance between favorable and unfavorable interactions and no further increase in stability will be observed. Eventually, the charge density will become such that the introduction of new charges can only be unfavorable, so the energy of favorable charge–charge interactions (and predicted stability) will decrease. As a result, only a few sequences will produce optimal surface charge–charge interactions. To increase the stability of a protein beyond what is possible through optimization of surface charge–charge interactions, it would be necessary to optimize other types of interactions, such as hydrogen bonding, packing, or hydrophobicity.
Materials and Methods
Protein cloning, expression, and purification
Mutations were generated using a PCR-based strategy. Chemically induced competent Bl21* Escherichia coli strains were transformed by appropriate recombinant plasmid constructs (pET21d[+] vector) coding for Fyn SH3 domain mutants fused to a C-terminal hexahistidine tag provided by the vector. Protein expression was induced by the addition of IPTG to the culture media, and the purification was carried out through nickel affinity chromatography using a Ni-NTA affinity matrix (Qiagen Canada) under denaturing conditions (6 M GuHCl) according to the procedure described previously (Maxwell and Davidson 1998). Proteins were subsequently folded through equilibrium dialysis in 50 mM sodium phosphate plus 100 mM NaCl and used as such without cleaving the hexahistidine tag. Sample purity was verified through SDS-PAGE. The identities of the purified Fyn variants were confirmed using matrix-assisted laser desorption/ionization-time-of-flight (MALDI-TOF) mass spectrometry (Voyager DE-PRO, PerSeptive Biosystems/Applied Biosystems). Samples were prepared for MALDI-TOF by diluting the protein stock solution (concentrations varied between 0.5 and 1.4 mg/mL) 1:10 with matrix. The matrix solution was prepared by washing 10 mg of sinapinic acid with hexane to remove impurities and then dissolving in 1 mL of buffer containing 30% acetonitrile, 0.1% TFA. After vortexing 1–2 min to mix, the solution was centrifuged at 2500g for 1 min to pellet any matrix components not dissolved. The samples were allowed to air dry on the plate before the spectra were measured. For each protein, three spectra were accumulated, and the averaged data were processed using Data Explorer, version 4.0 (Applied Biosystems). The experimentally measured masses were compared to the theoretical masses, based on amino acid composition, calculated by the ExPASy proteomics server (Gasteiger et al. 2003). All Fyn variants had molecular masses determined by MALDI-TOF (MMS) that were consistent with those theoretically calculated from the amino acid sequence (MTH) (Fyn − MTH = 9178.8 Da, MMS = 9177.8 Da; Fyn1 − MTH = 9177.9 Da, MMS = 9176.4 Da; Fyn2 − MTH = 9176.9 Da; MMS = 9177.0 Da; Fyn3 − MTH = 9190.0 Da; MMS = 9190.2 Da; Fyn5 − MTH = 9195.1 Da, MMS = 9193.2 Da).
Calculation and optimization of surface charge–charge energies
The surface charge–charge interaction energies for each Fyn variant were calculated at pH 7.0 using the Tanford–Kirkwood model corrected for solvent accessibility (TK-SA), as described previously (Matthew et al. 1985; Ibarra-Molero et al. 1999). Structures for the designed sequences were generated through homology modeling using MODELLER v 7.7 (Marti-Renom et al. 2000). To account for the relative flexibility of side chains on the surface, an ensemble of 11 structures for each sequence was generated using MODELLER, and the calculations were performed on each structure individually. The interaction energies between charged groups i and j are calculated as:
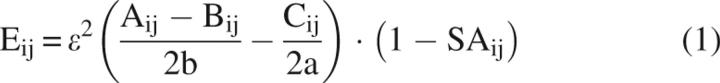 |
where ɛ is the unit charge, Aij is a function of the distance between the charges and the low dielectric of the protein, Bij is a function of the positions of the charges and the high dielectric of the solvent, Cij is a function of the ionic strength of the solvent, as previously defined by Tanford and Kirkwood (1957), b is the radius of the sphere representing the protein, a is the radius of the sphere from which solvent ions are excluded, and SAij is the average solvent accessible surface area of the two groups, calculated as described previously (Richmond 1984). The contribution of charge–charge interactions to the Gibbs free energy of unfolding (ΔG qq) is determined from changes in pKa values of the protein upon substitution relative to model compounds and has been previously described in great detail (Ibarra-Molero et al. 1999). Briefly, the charge–charge interaction energy, Eij, represents a perturbation in the protonation energy of the native state from that determined using model compounds. Since it is assumed that there are no residual charge–charge interactions in the unfolded state, the protonation energy of the unfolded state is determined solely from the model compounds. The following values of pKa were used: Asp – 4.0; Glu – 4.5; Lys – 10.6; Arg – 12.0; His – 6.3; pKa – 3.6; C-term – 7.7. The overall contribution of charge–charge interactions (ΔG qq) is taken to be the difference in protonation energy between the native and unfolded states. The averaged values and standard deviations of ΔG qq for each of the Fyn variants are shown in Figure 1C. The results of the TK-SA calculations for the Fyn variants were compared to the results of the calculations of charge–charge interaction energies from two continuum electrostatic models: The finite difference Poisson–Boltzmann equation included in the University of Houston Brownian Dynamics software package (UHBD) (Antosiewicz et al. 1994, 1996) and the Multi-Conformer Continuum Electrostatic model (MCCE) (Alexov and Gunner 1997). All three models produced qualitatively similar results for the surface residues of Fyn (see Fig. S1 in the Supplemental material).
Optimization of the surface charge–charge interactions was accomplished using the genetic algorithm, which is described in detail elsewhere (Ibarra-Molero and Sanchez-Ruiz 2002; Godoy-Ruiz et al. 2005; Strickler et al. 2006). Briefly, each in silico “chromosome” represents a charge distribution. The first generation is comprised of wild-type charge distributions, as well as other possible charge distributions given the sequence of the protein. The chromosomes with the lowest energies are passed on to the next generation. The remaining chromosomes undergo “crossover events” and “point mutations” to finish populating the new generation. Chromosomes with lower energies than a preset cutoff value were retained and analyzed. During optimization, positions D17 and E24 were held fixed because they are less than 50% solvent exposed. In addition to the existing charged surface residues, three neutral, polar residues—Q27, N30, and Q53—were included in the optimization.
Differential scanning calorimetry
The DSC experiments were performed using a VP-DSC instrument (MicroCal) at a scan rate of 90°C/h as previously described (Makhatadze 1998). The Fyn variants were prepared for DSC by dialyzing extensively against 50 mM sodium phosphate buffer (pH 7.0) containing 100 mM NaCl. Protein concentration was determined spectrophotometrically, using a molar extinction coefficient, calculated from amino acid composition (Edelhoch 1967; Pace et al. 1995), of ɛ280nm = 18,450 M−1cm−1 for all variants. The partial specific volume of the protein was calculated from amino acid composition as previously described (Makhatadze et al. 1990). Reversibility of unfolding of the variants was determined by stopping the DSC scan just after the transition, and then rescanning the same sample. All of the Fyn variants exhibited reversible thermal unfolding. The profiles were analyzed according to a two-state transition model. In-house scripts of the nonlinear regression routine, NLREG, were used to perform a global fit of the data, keeping the native and unfolded-state baselines and ΔC P the same for all the variants. The fitted parameters were ΔH VH(T m), ΔC p, and T m. Using these parameters, ΔG (T) is calculated by the Gibbs–Helmholtz equation
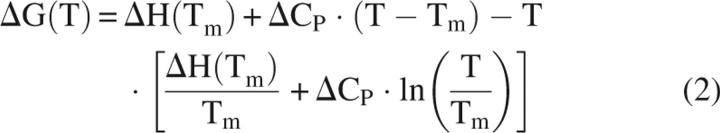 |
In this equation, ΔC p is the change in heat capacity upon unfolding, ΔH(T m) is the enthalpy of unfolding, ΔG(T) is the Gibbs energy, and T m is the transition temperature, which is the temperature where 50% of the protein is unfolded.
Circular dichroism spectroscopy
The thermal unfolding of the Fyn variants was monitored by following the changes in the ellipticity at 220 m on an Aviv Circular Dichroism spectrometer Model 62A DS (Aviv Associates) as previously described (Maxwell and Davidson 1998).
Analytical ultracentrifugation
Analytical ultracentrifugation experiments were performed on a Beckman XLA ultracentrifuge. Absorbance was monitored at 280 nm, and samples were allowed to equilibrate at three different rotor speeds (22,000, 28,000, and 37,000 rpm) at 20°C. Absorbance data were globally fitted to the equation
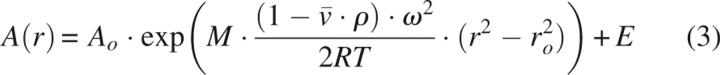 |
where A(r) is the absorbance at any given radius r, A 0 is the absorbance at a reference radius r 0, M is the molecular mass of the species in the cell, E is the baseline offset,  is the partial specific volume (0.717 cm3/g), calculated according to Makhatadze et al. (1990), ρ is the density of the solution (assumed to be 1 g/mL), and ω is the rotor angular velocity.
Electronic supplemental material
Supplemental_Figures.PDF contains three figures: Figure S1, comparison of the results of calculation of energies of charge–charge interactions using three different computational models; Figure S2, comparison of the CD spectra of the Fyn SH3 variants; and Figure S3, results of the analytical ultracentrifugation for the wild-type and designed variant of the Fyn SH3 domain.
Acknowledgments
This work was supported in part by grants from the National Science Foundation (MCB-0110396 to G.I.M.), NASA GSRP (to G.I.M. and K.L.S), and the Canadian Institutes of Health Research (to A.R.D.). A.Z.-A. is supported by a doctoral Canada Graduate Scholarship (CGS-D3) from the Natural Sciences and Engineering Research Council of Canada (NSERC).
Footnotes
Supplemental material: see www.proteinscience.org
Reprint requests to: George I. Makhatadze, Center for Biotechnology and Interdisciplinary Studies, Rensselaer Polytechnic Institute, 110 8th Street, Troy, NY 12180-3590, USA; e-mail: makhag@rpi.edu; fax: (518) 276-2851; or Alan R. Davidson, Department of Molecular and Medical Genetics, University of Toronto, Toronto, ON M5S 1A8, Canada; e-mail: alan.davidson@utoronto.ca; fax: (416) 978-6885.
Article and publication are at http://www.proteinscience.org/cgi/doi/10.1110/ps.073091607.
References
- Alexov E.G. and Gunner, M.R. 1997. Incorporating protein conformational flexibility into the calculation of pH-dependent protein properties. Biophys. J. 72: 2075–2093. [DOI] [PMC free article] [PubMed] [Google Scholar]
- Antosiewicz J., McCammon, J.A., and Gilson, M.K. 1994. Prediction of pH-dependent properties of proteins. J. Mol. Biol. 238: 415–436. [DOI] [PubMed] [Google Scholar]
- Antosiewicz J., McCammon, J.A., and Gilson, M.K. 1996. The determinants of pKas in proteins. Biochemistry 35: 7819–7833. [DOI] [PubMed] [Google Scholar]
- Bolon D.N., Marcus, J.S., Ross, S.A., and Mayo, S.L. 2003. Prudent modeling of core polar residues in computational protein design. J. Mol. Biol. 329: 611–622. [DOI] [PubMed] [Google Scholar]
- Dantas G., Kuhlman, B., Callender, D., Wong, M., and Baker, D. 2003. A large-scale test of computational protein design: Folding and stability of nine completely redesigned globular proteins. J. Mol. Biol. 332: 449–460. [DOI] [PubMed] [Google Scholar]
- Dantas G., Corrent, C., Reichow, S.L., Havranek, J.J., Eletr, Z.M., Isern, N.G., Kuhlman, B., Varani, G., Merritt, E.A., and Baker, D. 2007. High-resolution structural and thermodynamic analysis of extreme stabilization of human procarboxypeptidase by computational protein design. J. Mol. Biol. 366: 1209–1221. [DOI] [PMC free article] [PubMed] [Google Scholar]
- Desjarlais J.R. and Handel, T.M. 1995. De novo design of the hydrophobic cores of proteins. Protein Sci. 4: 2006–2018. [DOI] [PMC free article] [PubMed] [Google Scholar]
- Dill K.A. 1990. Dominant forces in protein folding. Biochemistry 29: 7133–7155. [DOI] [PubMed] [Google Scholar]
- Di Nardo A.A., Larson, S.M., and Davidson, A.R. 2003. The relationship between conservation, thermodynamic stability, and function in the SH3 domain hydrophobic core. J. Mol. Biol. 333: 641–655. [DOI] [PubMed] [Google Scholar]
- Edelhoch H. 1967. Spectroscopic determination of tryptophan and tyrosine in proteins. Biochemistry 6: 1948–1954. [DOI] [PubMed] [Google Scholar]
- Filimonov V.V., Azuaga, A.I., Viguera, A.R., Serrano, L., and Mateo, P.L. 1999. A thermodynamic analysis of a family of small globular proteins: SH3 domains. Biophys. Chem. 77: 195–208. [DOI] [PubMed] [Google Scholar]
- Gasteiger E., Gattiker, A., Hoogland, C., Ivanyi, I., Appel, R.D., and Bairoch, A. 2003. ExPASy: The proteomics server for in-depth protein knowledge and analysis. Nucleic Acids Res. 31: 3784–3788. doi: 10.1093/nar/gkg563. [DOI] [PMC free article] [PubMed] [Google Scholar]
- Godoy-Ruiz R., Perez-Jimenez, R., Garcia-Mira, M.M., Plaza del Pino, I.M., and Sanchez-Ruiz, J.M. 2005. Empirical parametrization of pK values for carboxylic acids in proteins using a genetic algorithm. Biophys. Chem. 115: 263–266. [DOI] [PubMed] [Google Scholar]
- Gribenko A.V. and Makhatadze, G.I. 2007. Role of the charge–charge interactions in defining stability and halophilicity of the CspB proteins. J. Mol. Biol. 366: 842–856. [DOI] [PubMed] [Google Scholar]
- Grimsley G.R., Shaw, K.L., Fee, L.R., Alston, R.W., Huyghues-Despointes, B.M., Thurlkill, R.L., Scholtz, J.M., and Pace, C.N. 1999. Increasing protein stability by altering long-range coulombic interactions. Protein Sci. 8: 1843–1849. [DOI] [PMC free article] [PubMed] [Google Scholar]
- Hurley J.H., Baase, W.A., and Matthews, B.W. 1992. Design and structural analysis of alternative hydrophobic core packing arrangements in bacteriophage T4 lysozyme. J. Mol. Biol. 224: 1143–1159. [DOI] [PubMed] [Google Scholar]
- Ibarra-Molero B., Loladze, V.V., Makhatadze, G.I., and Sanchez-Ruiz, J.M. 1999. Thermal versus guanidine-induced unfolding of ubiquitin. An analysis in terms of the contributions from charge–charge interactions to protein stability. Biochemistry 38: 8138–8149. [DOI] [PubMed] [Google Scholar]
- Ibarra-Molero B. and Sanchez-Ruiz, J.M. 2002. Genetic algorithm to design stabilizing surface–charge distributions in proteins. J. Phys. Chem. B 106: 6609–6613. [Google Scholar]
- Korkegian A., Black, M.E., Baker, D., and Stoddard, B.L. 2005. Computational thermostabilization of an enzyme. Science 308: 857–860. [DOI] [PMC free article] [PubMed] [Google Scholar]
- Larson S.M., Ruczinski, I., Davidson, A.R., Baker, D., and Plaxco, K.W. 2002. Residues participating in the protein folding nucleus do not exhibit preferential evolutionary conservation. J. Mol. Biol. 316: 225–233. [DOI] [PubMed] [Google Scholar]
- Lazar G.A., Desjarlais, J.R., and Handel, T.M. 1997. De novo design of the hydrophobic core of ubiquitin. Protein Sci. 6: 1167–1178. [DOI] [PMC free article] [PubMed] [Google Scholar]
- Lee C.F., Makhatadze, G.I., and Wong, K.B. 2005. Effects of charge-to-alanine substitutions on the stability of ribosomal protein L30e from Thermococcus celer . Biochemistry 44: 16817–16825. [DOI] [PubMed] [Google Scholar]
- Loladze V.V., Ibarra-Molero, B., Sanchez-Ruiz, J.M., and Makhatadze, G.I. 1999. Engineering a thermostable protein via optimization of charge–charge interactions on the protein surface. Biochemistry 38: 16419–16423. [DOI] [PubMed] [Google Scholar]
- Makhatadze G.I. 1998. Measuring protein thermostability by differential scanning calorimetry. In Current protocols in protein chemistry, 2 (ed. T.J. Wiley). John Wiley & Sons, New York. [DOI] [PubMed]
- Makhatadze G.I. and Privalov, P.L. 1995. Energetics of protein structure. Adv. Protein Chem. 47: 307–425. [DOI] [PubMed] [Google Scholar]
- Makhatadze G.I., Medvedkin, V.N., and Privalov, P.L. 1990. Partial molar volumes of polypeptides and their constituent groups in aqueous solution over a broad temperature range. Biopolymers 30: 1001–1010. [DOI] [PubMed] [Google Scholar]
- Makhatadze G.I., Loladze, V.V., Gribenko, A.V., and Lopez, M.M. 2004. Mechanism of thermostabilization in a designed cold shock protein with optimized surface electrostatic interactions. J. Mol. Biol. 336: 929–942. [DOI] [PubMed] [Google Scholar]
- Marti-Renom M.A., Stuart, A.C., Fiser, A., Sanchez, R., Melo, F., and Sali, A. 2000. Comparative protein structure modeling of genes and genomes. Annu. Rev. Biophys. Biomol. Struct. 29: 291–325. [DOI] [PubMed] [Google Scholar]
- Matthew J.B., Gurd, F.R., Garcia-Moreno, B., Flanagan, M.A., March, K.L., and Shire, S.J. 1985. pH-dependent processes in proteins. CRC Crit. Rev. Biochem. 18: 91–197. [DOI] [PubMed] [Google Scholar]
- Maxwell K.L. and Davidson, A.R. 1998. Mutagenesis of a buried polar interaction in an SH3 domain: Sequence conservation provides the best prediction of stability effects. Biochemistry 37: 16172–16182. [DOI] [PubMed] [Google Scholar]
- Myers J.K., Pace, C.N., and Scholtz, J.M. 1995. Denaturant m values and heat capacity changes: Relation to changes in accessible surface areas of protein unfolding. Protein Sci. 4: 2138–2148. [DOI] [PMC free article] [PubMed] [Google Scholar]
- Northey J.G., Di Nardo, A.A., and Davidson, A.R. 2002a. Hydrophobic core packing in the SH3 domain folding transition state. Nat. Struct. Biol. 9: 126–130. [DOI] [PubMed] [Google Scholar]
- Northey J.G., Maxwell, K.L., and Davidson, A.R. 2002b. Protein folding kinetics beyond the ϕ value: Using multiple amino acid substitutions to investigate the structure of the SH3 domain folding transition state. J. Mol. Biol. 320: 389–402. [DOI] [PubMed] [Google Scholar]
- Pace C.N., Vajdos, F., Fee, L., Grimsley, G., and Gray, T. 1995. How to measure and predict the molar absorption coefficient of a protein. Protein Sci. 4: 2411–2423. [DOI] [PMC free article] [PubMed] [Google Scholar]
- Perl D., Mueller, U., Heinemann, U., and Schmid, F.X. 2000. Two exposed amino acid residues confer thermostability on a cold shock protein. Nat. Struct. Biol. 7: 380–383. [DOI] [PubMed] [Google Scholar]
- Permyakov S.E., Makhatadze, G.I., Owenius, R., Uversky, V.N., Brooks, C.L., Permyakov, E.A., and Berliner, L.J. 2005. How to improve nature: Study of the electrostatic properties of the surface of α-lactalbumin. Protein Eng. Des. Sel. 18: 425–433. [DOI] [PubMed] [Google Scholar]
- Privalov P.L. and Khechinashvili, N.N. 1974. A thermodynamic approach to the problem of stabilization of globular protein structure: A calorimetric study. J. Mol. Biol. 86: 665–684. [DOI] [PubMed] [Google Scholar]
- Richmond T.J. 1984. Solvent accessible surface area and excluded volume in proteins. Analytical equations for overlapping spheres and implications for the hydrophobic effect. J. Mol. Biol. 178: 63–89. [DOI] [PubMed] [Google Scholar]
- Sanchez-Ruiz J.M. and Makhatadze, G.I. 2001. To charge or not to charge? Trends Biotechnol. 19: 132–135. [DOI] [PubMed] [Google Scholar]
- Spector S., Wang, M., Carp, S.A., Robblee, J., Hendsch, Z.S., Fairman, R., Tidor, B., and Raleigh, D.P. 2000. Rational modification of protein stability by the mutation of charged surface residues. Biochemistry 39: 872–879. [DOI] [PubMed] [Google Scholar]
- Strickler S.S., Gribenko, A.V., Gribenko, A.V., Keiffer, T.R., Tomlinson, J., Reihle, T., Loladze, V.V., and Makhatadze, G.I. 2006. Protein stability and surface electrostatics: A charged relationship. Biochemistry 45: 2761–2766. [DOI] [PubMed] [Google Scholar]
- Tanford C. and Kirkwood, J.G. 1957. Theory of protein titration curves. I. General equations for impenetrable spheres. J. Am. Chem. Soc. 79: 5333–5339. [Google Scholar]
- Zarrine-Afsar A., Mittermaier, A., Kay, L.E., and Davidson, A.R. 2006. Protein stabilization by specific binding of guanidinium to a functional arginine-binding surface on an SH3 domain. Protein Sci. 15: 162–170. [DOI] [PMC free article] [PubMed] [Google Scholar]
- Zollars E.S., Marshall, S.A., and Mayo, S.L. 2006. Simple electrostatic model improves designed protein sequences. Protein Sci. 15: 2014–2018. [DOI] [PMC free article] [PubMed] [Google Scholar]