

Abstract
Odorants and their perceptions differ along multiple dimensions, requiring that a critical examination of any putative neural code directly access the multidimensional nature of the encoding process. Previous work has examined simple, systematic odorant differences that, regardless of coding strategy, would be expected to produce simple, systematic predictions in neural and behavioral responses. Using an odorant identification confusion matrix task that extracts precise quality relationships across odorants, we determined whether spatially specific glomerular activity patterns predict perceptual quality relationships for odorants that cannot easily be classified a priori along a single chemical dimension. Multidimensional scaling analysis of odorant pattern similarity measures derived from the comparison of [14C]-2-deoxyglucose glomerular activity pattern data yielded a two-dimensional odorant activity space that was highly significantly predictive of similarly obtained odorant perceptual spaces, uniformly across animals. These results strongly support the relevance of global spatial patterns in the olfactory bulb to the encoding of odor quality.
Keywords: odorant quality perception, bulbar activity patterns, 2-deoxyglucose
The first step in the encoding of an odorant appears to be mediated by the binding of odorant molecular features to odorant receptors on olfactory sensory neurons (OSNs) (Malnic et al., 1999). Odorants stimulate distinct patterns of activity in the olfactory epithelium (Moulton, 1976; Scott & Brierly, 1999; Youngentob et al., 1995) that accurately predict psychophysically determined odorant quality perception (Kent et al., 1995, 2003). By virtue of the highly organized OSN projections to the bulb (Mombaerts, 1996), the information displayed by glomeruli is a reflection of the OSN responses (Johnson & Leon, 2000a,b; Johnson et al., 1998, 1999, 2002, 2005a,b; Uchida et al., 2000). Therefore, it has been hypothesized that odorant quality is represented through patterns of glomerular activation that enhance the patterned information established in the differential activation of OSNs (Kent et al., 2003; Mori et al., 1999; Youngentob et al., 1995). Consistent with this view are functional imaging studies demonstrating odorant specific patterns of glomerular activity (Johnson & Leon, 2000a,b; Johnson et al., 1998, 1999, 2002, 2005a,b; Meister & Bonhoffer, 2001; Uchida et al., 2000; Xu et al., 2003). Also suggestive are behavioral observations demonstrating that bulbar patterns of [14C]-2-deoxyglucose (2-DG) glomerular uptake predict the differential ability of rats to perceive two chemically similar stimuli as different in an olfactory habituation/dishabituation task (i.e., enantiomer pairs [Linster et al., 2001], homologous series [Cleland et al., 2002; Ho et al., 2006a] or similar hydrocarbons [Ho et al., 2006b]).
The above notwithstanding, the molecules, neural responses, and perceptions involved in olfaction are by their nature multidimensional. Indeed, one odorant can be described as being similar to two other odorants, and yet these two other odorants may not be perceived as correspondingly similar to each other. For this reason, studies of human olfactory perception have very commonly involved multidimensional techniques such as multidimensional scaling or principal components analysis to describe the relationships between odor perceptions more thoroughly (Chastrette et al., 1991; Dawes et al., 2004; Doty et al., 1994; Madany Mamlouk et al., 2003; Schiffman et al., 1977; Stevens and O’Connell, 1996). Odorant chemistry and the patterns of activity evoked by odorants in the rat olfactory bulb typically also differ simultaneously along many dimensions (Farahbod et al., 2006), and it is reasonable to expect that a complete understanding of the relationships between neural activity and perception would involve many of these dimensions. Indeed, relationships between odorants revealed by multidimensional scaling of perceptual similarities derived using a five-odorant identification confusion matrix task are well predicted by relationships revealed by multidimensional scaling of olfactory epithelial activity pattern similarities in rats (Kent et al., 1995, 2003; Youngentob et al., 2001).
To date, most investigations of the relationships between bulbar activity patterns and behavior have involved systematic differences along single dimensions of odorant chemistry such as stereoconfiguration in enantiomer odorants and carbon chain length in homologous series of odorants (Linster et al., 2001; Cleland et al., 2002; Ho et al., 2006a,b). To test the possibility of a multidimensional relationship among bulbar activity patterns and odor perception, we have used in the present study a set of five odorants that cannot be classified as a group that varies along a single chemical dimension. These odorants are acetone, 2-propanol, santalol, β-pinene, and pentadecane (Fig. 1). In this respect, although acetone and 2-propanol share a simple three-carbon backbone, 2-propanol also shares an alcohol functional group with santalol. Santalol and β-pinene are both polycyclic compounds, while β-pinene and pentadecane are both hydrocarbons without oxygen-containing functional groups. Pentadecane and santalol, on the other hand, are similar in their larger carbon number. Consequently, because both hydrocarbon structure and functional groups have been identified as important structural determinants of bulbar activity patterns (Johnson et al., 2002, 2005a; Leon and Johnson, 2003), it is not possible to predict, a priori, which odorant pairs would produce the most similar activity patterns. Indeed, as outlined below, the activity patterns evoked by these five odorants overlap in different bulbar locations depending on the different chemical relationships between the compounds
Figure 1.
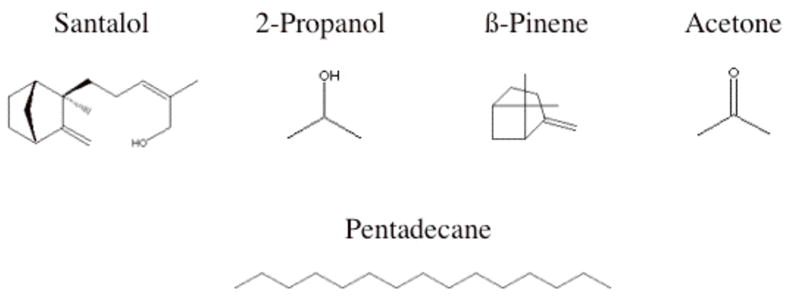
Chemical structures of the five odorants studied.
In this study, we show that 2-DG spatial patterns of odorant-evoked glomerular activity (Johnson & Leon, 2000a,b) accurately predict odorant quality perceptual patterns resulting from an odorant identification confusion matrix task that directly extracts perceptual quality relationships across sets of odorants (Kent et al., 1995, 2003; Youngentob et al., 1990, 1991, 2001).
Material and Methods
Animal Psychophysics
Six adult Long-Evans Hooded rats were trained and tested using a five-odorant identification confusion matrix task, according to established procedures (Youngentob et al., 1990). The method yielded trained rats that could differentially report (i.e., identify) the presentation of a set of five qualitatively different (at least to human observers) odorant stimuli. Operant techniques were used to: (1) shape trial-initiating and sampling behavior at an odorant port within a Plexiglas behavioral chamber; and (2) in an iterative training procedure that increased the number of odorants in the identification task (i.e., 2-odor differential response task, three-odor and so on), train the animals to associate a particular response tunnel (i.e., one response location among five alternative choices) within the behavioral chamber with one of the five different odorants. Each of five tunnels “represented” the correct response location for one of the set of five odorants used in the study: santalol, 2-propanol, β-pinene, acetone and pentadecane. Each rat’s odorant/response tunnel associations were randomly assigned so that no two rats had the same set of odorants associated with the same correct response tunnels.
Odorant stimuli were generated and delivered according to previously established methods and procedures (Kent et al., 1995, 2003; Youngentob et al., 1990, 1991, 2001). The concentrations (expressed as % vapor saturation at 20°C) were 7.5%, 4.5%, 3.625%, 1.5%, and 7.5% for santalol, 2-propanol, β-pinene, acetone and pentadecane, respectively. Although odorant intensity is not likely a salient contributor to the identification task (Youngentob et al., 1990; Youngentob et al., unpublished results) (i.e., given a sufficient number of molecules for the identification process, individual odorants, with few exceptions, smell qualitatively the same [and identification performance remains stable] across a wide range of concentrations), nonetheless, we minimized its potential contribution by intensity matching the odorants. Specifically, the concentrations of the odorants were chosen such that, at least to several human observers, their intensities were both matched and clearly above threshold.
The rats were trained to initiate a trial by breaking a photocell positioned across the odorant delivery port and sample the odorant presented. After completing a minimum sampling duration of 300msec, the animals were trained to leave the sampling port and register a response in the tunnel that by training the rat had learned to associate with reinforcement for the odorant presented. A response choice was made when the rat licked a reinforcement cup located at the end of one of the response tunnels. Criterion training was set at an overall performance of >90% on 200 trials and no less than 80% correct identification for an individual odorant. With this standard criterion, trained animals are near ceiling performance on the odorant identification differential response task (Kent et al., 1995, 2003; Youngentob et al., 1990, 1991, 2001).
Following criterion training, animals were tested using a randomized blocks design. Odorant stimuli were randomly presented in blocks of five trials with each block consisting of the single presentation of each of the five different odorant stimuli. Testing in any one session continued for a total of 40 consecutive blocks of trials (200 total trials per testing session; 40 trials per odorant). As noted above, because animals perform with a very high degree of accuracy following criterion performance (Kent et al., 1995, 2003; Youngentob et al. 1990, 1991, 2001), each rat was tested multiple times in order to acquire sufficient off-diagonal data (see below) for the reliable measurement of perceptual dissimilarity between two odorants. Indeed, these well-established training, testing and analytic procedures have been shown previously to reveal odor perceptual relationships that are both statistically reliable across different animals and related to epithelial activity patterns (Kent et al., 1995, 2003; Youngentob et al., 1990, 2001). Consequently, each rat was tested once per day and a total of 40 testing sessions were acquired (8,000 total trials;1600 trials per odorant).
2-DG Functional Mapping
In a separate series of animals that are both first reported here (2-propanol, n=5) as well as referenced to previous studies ([santalol, n=3; β-pinene, n=3; acetone, n=6: Johnson et al., 2002] and [pentadecane, n=4: Ho et al., 2006a]), postnatal day P18–20 rats were exposed to odorants for 2-DG functional spatial mapping of the olfactory bulb, according to established methods (Johnson et al., 1998, 1999). The concentrations of the odorants (at ambient temperature) were: 2-propanol- 4.7%, santalol −12.5%, β-pinene – 10%, acetone - 0.925%, and pentadecane – 12.5%. Just prior to exposure to one of the behavioral study odorants, an animal received a subcutaneous injection of 0.16–0.2 mCi/kg [14C]-2-DG (Sigma Chemical Co., St. Louis, MO). The awake animal was exposed to its respective odorant (one odorant/animal) for 45 minutes after which it was killed and the brain frozen in isopentane at −45°C. Fresh-frozen bulbs were cryostat sectioned at a thickness of 20μm, and every sixth section was exposed to autoradiography film in order to establish odorant-evoked glomerular activity patterns. Adjacent sections were used to identify both the glomerular layer and the necessary landmarks for standardization across animals.
The method for determination of odorant-evoked glomerular activity patterns of 2-DG uptake, as well as the quantitative comparison of odorant-induced patterns, has been previously described in detail (Johnson & Leon, 2000a,b; Johnson et al., 1998, 1999, 2002). Briefly, 2500 standardized radioactively labeled 2-DG uptake measurements per olfactory bulb were incorporated into anatomically standardized data arrays. The arrays from the two bulbs of each animal were averaged and the values within an array converted to z-scores. The z-score arrays were averaged across all the animals exposed to the same odorant, thereby providing an average odorant-induced spatial activity map across the olfactory bulb glomerular layer. As discussed below, this approach fulfilled two purposes. First, color contour representation of z-score values were used to visually highlight the different spatial activity patterns evoked by the different odorants and, second, comparison of z-score arrays for different odorants permitted the quantitative comparison of these odorant-induced activity patterns between odorants.
Results
Odorant-Induced Functional Activity Patterns
Figure 2 illustrates the relative glomerular activity across the olfactory bulb in response to each of the five odorants (santalol, 2-propanol, β-pinene, acetone, and pentadecane) used in the behavioral evaluation of odorant quality perception discussed below. The spatial activity maps to these odorants, as well as hundreds of additional ones can be further examined at http://leonserver.bio.uci.edu/publication-odorant-patterns.jsp?publication=Youngentob%20et%20al.,%202006.
Figure 2.
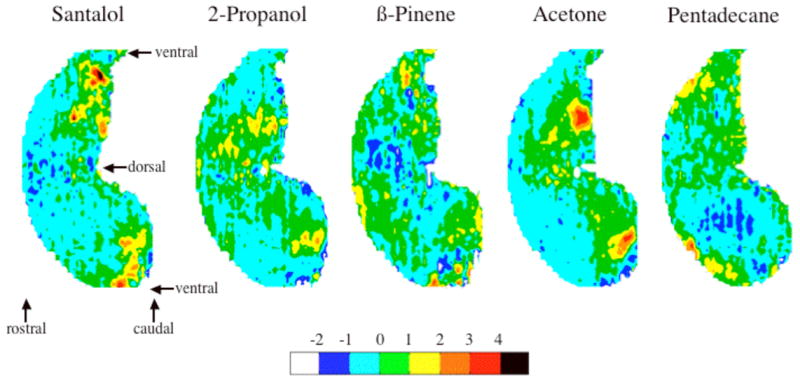
Odorant-induced activity maps for the five test odorants. The dorsal-centered color contour maps show the locations of 2-DG uptake across the entire glomerular layer. Color bar indicates relative 2-DG uptake in units of z-score.
To quantify the differences in glomerular activity for each odorant pair, a Pearson correlation coefficient was determined between corresponding data points within each pair of the 2500-element arrays. This provided a 5 × 5 matrix of correlation coefficients (Table 1) that indicated the degree to which any two glomerular activity patterns were similar. The similarity measures were subjected to a multidimensional scaling analysis (MDS) (see Schiffman et al., 1984) (Kruscal: linear – SYSTAT 5.2.1 Statistics and Graphics) that yielded a two-dimensional functional activity odorant space upon which the odorants were arranged according to their relative glomerular response similarities. In so doing, this approach permitted the geometric spatial representation of an otherwise incomprehensible matrix of data (Table 1). In our analysis, we limited the MDS pattern to the first two dimensions because they accounted for 93.8% of the four-dimensional variances, thereby leaving any meaningful remaining dimensions subject to measurement errors that may be concentrated in the 7.2% remaining. Figure 3 plots the relative position of each odorant in a combined functional activity and behavioral (see below) odorant space. With specific regard to the functional activity data (solid squares in Fig. 3) (and by visual comparison to the color contour patterns in Figure 2), the degree of similarity in the total glomerular response patterns between any two odorants mapped as the degree of closeness in the functional activity component of the odorant space. In other words, odorants with highly similar glomerular spatial activity patterns generated points closer together in the arbitrarily oriented 2-dimensional MDS space (e.g., 2-propanol and acetone), whereas odorants with relatively dissimilar patterns generated points farther apart in that space (e.g., 2-propanol and pentadecane).
Table 1.
Similarity matrix of glomerular activity patterns
| Santalol | 2-Propanol | β-Pinene | Acetone | Pentadecane | |
|---|---|---|---|---|---|
| Santalol | 1.000 | 0.022 | 0.044 | 0.188 | 0.162 |
| 2-Propanol | 0.022 | 1.000 | −0.009 | 0.409 | −0.094 |
| β-Pinene | 0.044 | −0.009 | 1.000 | −0.034 | 0.028 |
| Acetone | 0.188 | 0.409 | −0.034 | 1.000 | −0.021 |
| Pentadecane | 0.162 | −0.094 | 0.028 | −0.021 | 1.000 |
Figure 3.
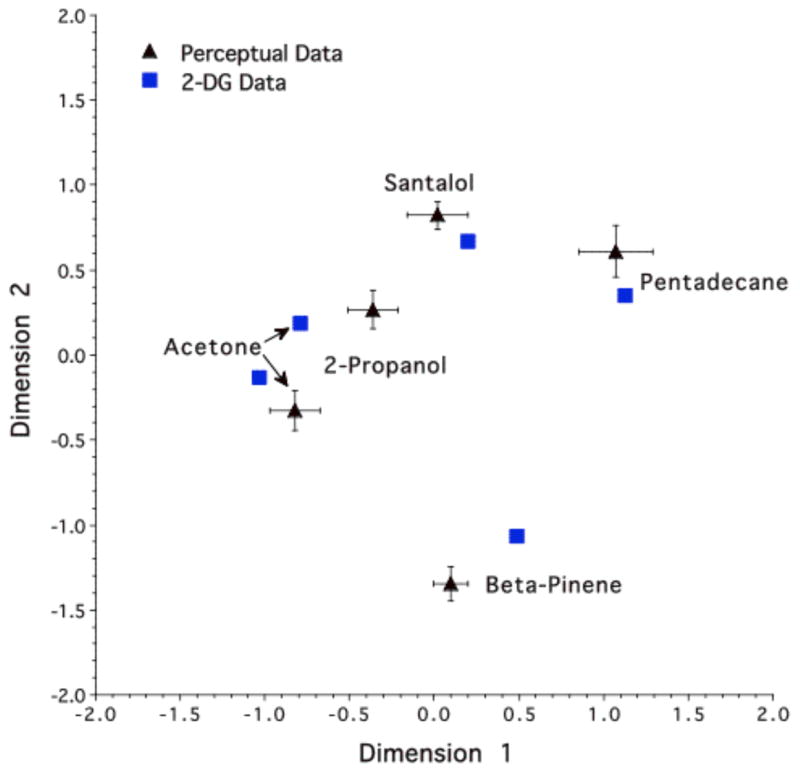
Alignment of the combined functional activity and behavioral odorant spaces. Coordinates are arbitrary and their scale is standardized to a common variance for the five behavioral and functional data points. The two-dimensional standard errors for the five behaviorally determined data points are shown.
Odorant Identification, Perceptual Differences among Odorants and their Relationship to the Mapping of Functional Activity Patterns
Using previously established operant conditioning methods, we trained rats to perform a five-odorant differential response task in which the rats learned to associate a particular response location within a behavioral chamber with one of five odorant stimuli (Youngentob et al., 1990, 1991). Although the behavioral task provided direct quantification of percent correct odorant identification performance for each of the six rats (mean ± sem: 95.1 ± 0.43%), one distinct advantage of the confusion matrix procedure was that it permitted analyses of the patterns or distributions of correct and incorrect responses to different odorants (Kent et al., 1995, 2003; Youngentob et al., 1990, 1991, 2001). Following our previously established approach, the results from each testing session for an animal were entered into a 5 × 5 odorant confusion matrix. As previously noted, a total of forty testing sessions were acquired for each animal and the results combined to yield a single composite matrix for the individual rats (Table 2). In these matrices the rows represented the odorant presented, while the columns represented the same odorants as five stimulus response alternatives. As such, for each odorant presented, the entries in the cells of a row were the relative frequencies with which the individual animal responded both correctly and with each of the four incorrect alternatives. As noted above, although the rats were highly accurate in identifying the odorants, the large number of trials (i.e., 1600 trials per odorant) resulted in a sufficient number of errors involving the alternative odorant response tunnels to permit the evaluation of perceptual dissimilarity between two odorants presented in the behavioral task. Indeed, even by gross inspection of the composite matrices, different animals tended to make similar patterns of errors by choosing particular incorrect response tunnels when presented with a given odorant stimulus.
Table 2.
Composites of 40 matrix replications (8,000 testing trials -1600 per odorant) for each rat
| FF40 | Stimulus response alternatives
|
FF43 | Stimulus response alternatives
|
||||||||
|---|---|---|---|---|---|---|---|---|---|---|---|
| Stimulus | Santalol | 2-Propanol | β-Pinene | Acetone | Pentadecane | Stimulus | Santalol | 2-Propanol | β-Pinene | Acetone | Pentadecane |
| Santalol | 0.979 | 0.008 | 0.000 | 0.002 | 0.011 | Santalol | 0.924 | 0.004 | 0.003 | 0.004 | 0.065 |
| 2-Propanol | 0.016 | 0.946 | 0.009 | 0.011 | 0.017 | 2-Propanol | 0.011 | 0.960 | 0.003 | 0.003 | 0.023 |
| β-Pinene | 0.003 | 0.001 | 0.947 | 0.022 | 0.026 | β-Pinene | 0.001 | 0.002 | 0.991 | 0.003 | 0.003 |
| Acetone | 0.001 | 0.004 | 0.043 | 0.926 | 0.025 | Acetone | 0.008 | 0.001 | 0.008 | 0.978 | 0.006 |
| Pentadecane | 0.006 | 0.008 | 0.004 | 0.006 | 0.975 | Pentadecane | 0.051 | 0.014 | 0.003 | 0.004 | 0.929 |
|
|
|
||||||||||
| FF41 | Stimulus response alternatives
|
FF44 | Stimulus response alternatives
|
||||||||
| Stimulus | Santalol | 2-Propanol | β-Pinene | Acetone | Pentadecane | Stimulus | Santalol | 2-Propanol | β-Pinene | Acetone | Pentadecane |
|
|
|
||||||||||
| Santalol | 0.982 | 0.004 | 0.002 | 0.003 | 0.008 | Santalol | 0.983 | 0.003 | 0.000 | 0.002 | 0.013 |
| 2-Propanol | 0.006 | 0.889 | 0.021 | 0.009 | 0.074 | 2-Propanol | 0.014 | 0.957 | 0.017 | 0.011 | 0.001 |
| β-Pinene | 0.002 | 0.011 | 0.962 | 0.002 | 0.024 | β-Pinene | 0.006 | 0.003 | 0.953 | 0.038 | 0.000 |
| Acetone | 0.007 | 0.008 | 0.007 | 0.947 | 0.031 | Acetone | 0.012 | 0.017 | 0.023 | 0.946 | 0.003 |
| Pentadecane | 0.003 | 0.053 | 0.014 | 0.011 | 0.921 | Pentadecane | 0.009 | 0.000 | 0.000 | 0.001 | 0.990 |
|
|
|
||||||||||
| FF42 | Stimulus response alternatives
|
FF45 | Stimulus response alternatives
|
||||||||
| Stimulus | Santalol | 2-Propanol | β-Pinene | Acetone | Pentadecane | Stimulus | Santalol | 2-Propanol | B-Pinene | Acetone | Pentadecane |
|
|
|
||||||||||
| Santalol | 0.936 | 0.023 | 0.009 | 0.016 | 0.016 | Santalol | 0.943 | 0.041 | 0.004 | 0.002 | 0.010 |
| 2-Propanol | 0.057 | 0.901 | 0.008 | 0.018 | 0.016 | 2-Propanol | 0.042 | 0.922 | 0.011 | 0.016 | 0.009 |
| β-Pinene | 0.010 | 0.011 | 0.942 | 0.025 | 0.012 | β-Pinene | 0.023 | 0.004 | 0.950 | 0.016 | 0.007 |
| Acetone | 0.031 | 0.022 | 0.006 | 0.925 | 0.016 | Acetone | 0.024 | 0.011 | 0.006 | 0.955 | 0.004 |
| Pentadecane | 0.008 | 0.004 | 0.001 | 0.006 | 0.981 | Pentadecane | 0.005 | 0.001 | 0.001 | 0.003 | 0.990 |
|
|
|
||||||||||
The composite data were used to analyze the patterns or distributions of responses to the different odorants (both correct and incorrect responses), which, when compared in a pair-wise fashion for all possible combinations of the odorants, yielded an odorant dissimilarity matrix for the individual rats that was based on a measure of average information transmitted for each paired comparison (see Appendix A). In this respect, for any pair of odorants, the degree of dissimilarity in their response distributions was taken to represent the degree to which any two odorants were perceptually dissimilar (Kent et al., 1995, 2003; Kurtz et al., 2000, 2001;Youngentob et al., 1990, 1991, 2001).
The dissimilarity measures determined from each rat’s 5 × 5 confusion matrix were analyzed using the same MDS methods, as above, to determine a perceptual odorant space for each of the six rats. Because we limited the MDS functional pattern (“the predictor” in this study) to two dimensions, we, therefore, also limited the behavioral evaluation of each animal to the same number of dimensions. As such, each behavioral evaluation also yielded the coordinates to a two-dimensional solution in which the odorants map according to their relative perceptual similarities in an individual animal’s MDS perceptual space.
The individual animal MDS solutions were used to test the null hypothesis that the odorant-induced glomerular activity patterns provided no information about the odorant stimuli in the perceptual odor spaces of the rats. Because the orientation of the two-dimensional solutions resulting from the MDS analyses (both functional and behavioral) were unique to the individual data sets, we first matched the orientation of each animal’s behavioral MDS coordinates to that of the functional activity coordinates. That is, using a previously established approach (see Appendix; Youngentob et al., 1995), the behavioral MDS pattern for each rat was rotated and flipped so as to optimize its orientation in terms of minimizing the sum of squared two-dimensional distances between the five bulbar-behavioral odorant pairs. Figure 3 plots the alignment of the average relative position of each odorant from the behaviorally determined perceptual data with these same odorants as determined from the functional 2-DG pattern similarity data. Of particular interest in this figure is the striking correspondence in the two-dimensional relationship among the odorants between the functional 2-DG derived MDS map and the average behaviorally derived perceptual MDS map. Moreover, the two-dimensional variability around each behavioral point in the average behavioral map qualitatively suggested a high degree of consistency in the observed correspondence across animals. That is, if the glomerular activity pattern between two odorants mapped relatively close to each other in the MDS space then so did the perceptual data for the same odorants in the behavioral animals. Conversely, if the glomerular maps of differential activity mapped relatively distant from each other, then these same odorants behaviorally mapped relatively farther apart in the odorant space.
To evaluate formally a predictive relationship between glomerular functional activity and perception, we performed a modification of a previously established two-dimensional pattern regression analysis (Youngentob et al., 1995) using the five-odorant points in 2-DG functional odorant space as the predictor of individual animal behavioral data (Kent et al., 1995, 2003; see Appendix B for details). Briefly, this analysis used the linear regression analyses to obtain coefficient-weighted vectors of the MDS functional activity pattern (based on the 2-DG pattern data discussed above) that estimated the two-dimensional locations of optimally oriented individual animal behavioral targets to evaluate whether: (1) there was an overall predictive relationship, and (2) there was any evidence of predictive heterogeneity among the animals. The results of this analysis demonstrated a highly significant homogeneous predictive association between the odorants’ glomerular activity patterns and the individual animals’ perceptual odorant spaces (R2 = 0.434; F1,18 = 16.07., P = nil). Further, there was no evidence for predictive heterogeneity across the six behavioral animals (F5,18 = 0.899, P > 0.5). This latter finding is noteworthy because it suggests broad generalizability of a predictive relationship between glomerular activity patterns and perception beyond the animals used in the current behavioral study.
Discussion
Previous investigators have successfully made predictions concerning the ability of rats to recognize a difference between the two odorants in pairs based on the similarity of the entire glomerular activation pattern evoked by the odorants (Cleland et al., 2002; Ho et al., 2006a,b; Linster et al., 2001). That is, using an odor habituation/dishabituation task (Cleland et al., 2002; Ho et al., 2006a,b; Linster et al., 2001), rats increased their investigation time to the novel odorant in a stimulus pair. Thus, the foregoing studies clearly demonstrated there is chemotopy to the odorant encoding process at the level of the olfactory bulb. Nonetheless, the multidimensional nature of odorants and odorant quality perception suggests more complex relationships are embedded in a putative olfactory code than can be gleaned from the simple discrimination studies of enantiomers or homologous series of odorants. Our present findings significantly extend upon the previous work by providing both controlled psychophysical measures of odorant quality identification and an analytic approach that focuses on the perceptual relationships among the five test odorants in the behavioral task. Additionally, applying a similar analytical approach to the odorant-evoked spatial activity patterns, we quantified the bulbar functional pattern relationships for the same five behavioral odorants. As qualitatively illustrated in Figure 3, we found a remarkable predictive relationship between the odorant-specific glomerular activity patterns and the perceptual relationship among the odorants. When the activity pattern for two odorants mapped relatively close to each other in the functional MDS space, then so did the perceptual data. Alternatively, when the 2-DG activity patterns mapped relatively distant from each other in the MDS space, then so did the behaviorally derived perceptual data.
Regarding the above, it should be emphasized that the predictive relationship between activity patterns and perception was based on a measure of the entire glomerular pattern and not a superficial assessment of the regions of greatest 2-DG uptake. For example, the area of peak 2-DG uptake evoked by pentadecane, β-pinene, and santalol all appear to be largely non-overlapping (Fig. 2). Nonetheless, MDS analysis using similarity measures based on the odorants’ entire evoked bulbar patterns indicated a greater similarity between pentadecane and santalol, than between either of these odorants and β-pinene, a relationship that was paralleled by the same degree of similarity in perception (Fig. 3). Taken together, these observations are of particular significance because they indicate that even when the peak responses have almost nothing in common, the greater the similarity between the entire glomerular activity patterns produced by any two odorants, the more they were perceptually confused in the odorant identification task. Consequently, our results support a combinatorial coding model in which the total pattern of bulbar activity is relevant to the production of an odorant’s perceptual quality.
These results also imply that the greater the total pattern similarity between two odorants, the greater was the degree of similarity in their underlying psychophysical dimensions. Indeed, our results show quantitatively, and perhaps counter-intuitively, neural and perceptual relationships that could not be presumed from any prior notion of molecular similarity among the odorants. As noted above, there was a greater perceptual and functional pattern similarity between pentadecane and santalol, than between either of these odorants and β-pinene, yet both santalol and β-pinene are bridged polycyclic compounds. Clearly, we do not know all the information that is likely required to encode any particular odorant in rats. Nonetheless, our data strongly support the idea that the olfactory system uses a code whereby individual molecular features of an odorant are transformed into functional activity within individual glomeruli or clusters of glomeruli within the olfactory bulb (Johnson et al., 2002). In other words, odorants sharing similar molecular features and a global glomerular activity pattern have similar odorant qualities.
The present study found that the glomerular activity pattern data significantly predicted 43% of the variability in individual rats’ perceptual data. More importantly, this association was uniform across the behavioral animals. In considering this finding, it is worth considering possible factors that could have either masked a stronger correspondence between these two measures or that might account for additional source of variance. Both development (Meisami and Sendra, 1993; Zou et al., 2004) and prior olfactory experience (Sullivan et al., 1986; Yuan et al., 2002) are known to refine glomerular structure and function. Therefore, it is remarkable that so much of the variance in behavior could be explained by these patterns, especially considering that the activity patterns were obtained for very young animals with little odor experience (under stimulating conditions that were different than those in the behavioral task [e.g. Johnson et al., 2002]), whereas the behavioral data were obtained for adults that had undergone extensive odorant identification training and testing. The unambiguous relationship between glomerular activity patterns and quality perceptual relationships also was evident in spite of the fact that further bulbar and cortical processing occurred in our behaving animals. To be sure, the bulbar patterns used as the predictor in the present study did not benefit from the sharpening that occurs at the level of the output neurons of the bulb (see review by Mori et al., 1999), which are also refined both as a consequence of both development (Yokoi et al., 1995) and odor experience (Fletcher & Wilson, 2003). Likewise, these patterns did not benefit from the further processing that likely occurs in olfactory cortical areas (Haberly, 2001). This additional processing may further refine the perceptual relationships among odorants.
While the strong predictive relationship between glomerular response patterns and odorant quality perception clearly supports the notion of a spatial code in olfaction, earlier studies reported that large lesions of the bulb apparently did not significantly affect odorant detection and discrimination (Lu & Slotnick, 1998). These lesions would be expected to have effects on these functional processes if the identity of specific OSNs played a critical role in producing the olfactory code. The important experimental problems with these prior studies seem to have been resolved more recently, wherein the same laboratory showed that a toxin that destroys a specific subset of spatially distinct OSNs in the dorsal zone of the OE dramatically decreased the detection threshold of some odorants but not others (Vedin et al., 2004). Their data now support the importance of specific OSN activity reflected in distinct glomerular activity patterns, for the production of olfactory perceptions, and the data strongly suggest that the highly significant correlations between brain and behavior that we have observed are not spurious.
The significant and homogeneous predictive relationship that we observed between odorant-specific glomerular activity patterns and the perceptual relationship among the same odorants offers a clear interpretation of spatially distributed patterns of glomerular activity. In extension to the previous studies demonstrating a chemotopy to the encoding process, the present data strongly support the long-standing hypothesis in the field of olfaction that odorant-evoked glomerular activity patterns serve as a fundamental basis of the multidimensional encoding of odorant quality perception, independent of further processing. Indeed, these data support the seminal suggestion by Adrian (1942) “that different chemical stimuli produce different distributions of excitation and that a familiar smell, like a familiar sight, is recognized by the specific pattern which arouses in the brain”.
Acknowledgments
Supported by NIH Grants DC03904 and AA014871 (S.L.Y.); DC03545 and DC006516 (M.L.).
Appendix A. Perceptual Dissimilarity in the Rat between Two Odorants Presented in a 5-Odorant Identification Confusion Matrix Task as Measured by Average Information Transmitted
A testing session consists of 40 blocks of trials with the five different odorants presented in randomized sequence within each block. The trained rat registers its response to each presented odorant by licking the reinforcement cup at the end of on of five response tunnels corresponding to the five odorants.
After 40 testing sessions, each odorant has been presented sixteen-hundred times to the rat and the distribution of the five possible responses to each odorant is recorded in a five-by-five matrix.
Let i =1,2 index any two odorants,
j = 1,2,…,5 index the five possible alternatives,
nij =the number of responses of type j to odorant I,
and
where the dot notation indicates summation over the appropriate index.
The average information transmitted with respect to the two odorants measures the dissimilarity between them (Attneuve, 1959):
This measures the extent to which the distributions of correct and incorrect responses differ between two odorants. If the animal tends to make the same types of mistakes for both odorants, the dissimilarity is less than if the types of mistakes differ between the odorants. The 5 X 5 symmetric dissimilarity matrix from all pairs of the five odorants is then submitted to a Kruskal multidimensional scaling algorithm to generate the perceptual odorant space (SYSTAT, 1992).
Appendix B. Two-Dimensional Tests of the Bulbar Prediction of Behavioral Response Patterns in the Rat
The Kruskal stress criterion in the SYSTAT Multidimensional Scaling (MDS) program (SYSTAT 5.2.1 Statistics and Graphics) converted the 5×5 matrix of bulbar similarities between odorants and each of the six 5×5 matrices of behavioral dissimilarities between odorants into two-dimensional patterns of values, each pattern scaled to variance 2 and a 0,0 centroid (SYSTAT, 1992). The behavioral pattern for each rat was rotated and ‘flipped’ so as to optimize its orientation in terms of the sum of squared two-dimensional distances between the 5 bulbar-behavioral odorant pairs (Kent et al., 1995, 2003).
In this analysis, bulbar coordinate pattern values are indicated by
The optimally oriented behavioral coordinate pattern values are indicated by
The total sum of squared behavioral values in each dimension for each rat is given by
and the behavioral sum of squares in each dimension for each rat obtained by regression on the bulbar values is given by
Thus, the pooled total and regression sum of squares over all six rats are
and the error sum of squares in each dimension pooled over all six rats is
The behavioral sum of squares in each dimension as predicted by a single common least squares regression on the bulbar values is given by
so that the sum of squares for regression heterogeneity in each dimension is given by
Finally, summing over both dimensions, the sums of squared distances are
and
Thus, the respective F-tests for a common regression and for homogeneity are
and
References
- Adrian ED. Olfactory reactions in the brain of the hedgehog. Journal of Physiology. 1942;100:459–473. doi: 10.1113/jphysiol.1942.sp003955. [DOI] [PMC free article] [PubMed] [Google Scholar]
- Attneuve F. Applications of Information Theory to Psychology. New York: Henry Holt and Company; 1959. [Google Scholar]
- Chastrette M, de Saint Laumer JY, Sauvegrain P. Analysis of a system of description of odors by means of four different multivariate statistical methods. Chemical Senses. 1991;16:81–93. [Google Scholar]
- Cleland TA, Morse A, Yue EL, Linster C. Behavioral models of odor similarity. Behavioral Neuroscience. 2002;116:222–231. doi: 10.1037//0735-7044.116.2.222. [DOI] [PubMed] [Google Scholar]
- Dawes PJ, Dawes MT, Williams SM. The smell map: commonality of odour perception confirmed. Clinical Otolaryngology. 2004;29:648–654. doi: 10.1111/j.1365-2273.2004.00873.x. [DOI] [PubMed] [Google Scholar]
- Doty RL, Smith R, McKeown DA, Raj J. Tests of human olfactory function: Principal components analysis suggests that most measure a common source of variance. Perception and Psychophysics. 1994;56:701–7. doi: 10.3758/bf03208363. [DOI] [PubMed] [Google Scholar]
- Fletcher ML, Wilson DA. Olfactory bulb mitral-tufted cells plasticity: odorant specific tuning reflects previous odorant exposure. Journal of Neuroscience. 2003;23:6946–6955. doi: 10.1523/JNEUROSCI.23-17-06946.2003. [DOI] [PMC free article] [PubMed] [Google Scholar]
- Haberly LB. Parallel-distributed processing in olfactory cortex: new insights from morphological and physiological analysis of neuronal circuitry. Chemical Senses. 2001;26:551–576. doi: 10.1093/chemse/26.5.551. [DOI] [PubMed] [Google Scholar]
- Ho SL, Johnson BA, Leon M. Long hydrocarbon chains serve as unique molecular features recognized by ventral glomeruli of the rat olfactory bulb. Journal of Comparative Neurology. 2006a;498:16–30. doi: 10.1002/cne.20973. [DOI] [PMC free article] [PubMed] [Google Scholar]
- Ho SL, Johnson BA, Chen AL, Leon M. Differential responses to branched and unsaturated aliphatic hydrocarbons in the rat olfactory system. Journal of Comparative Neurology. 2006b doi: 10.1002/cne.21139. in press. [DOI] [PMC free article] [PubMed] [Google Scholar]
- Farahbod H, Johnson BA, Minami SS, Leon M. Chemotopic representations of aromatic odorants in the rat olfactory bulb. Journal of Comparative Neurology. 2006;496:350–366. doi: 10.1002/cne.20982. [DOI] [PMC free article] [PubMed] [Google Scholar]
- Johnson BA, Leon M. Modular representations of odorants in the glomerular layer of the rat olfactory bulb and the effects of stimulus concentration. Journal of Comparative Neurology. 2000a;422:496–509. doi: 10.1002/1096-9861(20000710)422:4<496::aid-cne2>3.0.co;2-4. [DOI] [PubMed] [Google Scholar]
- Johnson BA, Leon M. Odorant molecular length: one aspect of the olfactory code. Journal of Comparative Neurology. 2000b;426:330–338. doi: 10.1002/1096-9861(20001016)426:2<330::aid-cne12>3.0.co;2-5. [DOI] [PubMed] [Google Scholar]
- Johnson BA, Ho SL, Xu Z, Yihan JS, Yip S, Hingco EE, Leon M. Functional mapping of the rat olfactory bulb using diverse odorants reveals modular responses to functional groups and hydrocarbon structural features. Journal of Comparative Neurology. 2002;449:180–194. doi: 10.1002/cne.10284. [DOI] [PubMed] [Google Scholar]
- Johnson BA, Farahbod H, Leon M. Interactions between odorant functional group and hydrocarbon structure influence activity in glomerular response modules in the rat olfactory bulb. Journal of Comparative Neurology. 2005a;483:205–216. doi: 10.1002/cne.20409. [DOI] [PMC free article] [PubMed] [Google Scholar]
- Johnson BA, Farahbod H, Saber S, Leon M. Effects of functional group position on spatial representations of aliphatic odorants in the rat olfactory bulb. Journal of Comparative Neurology. 2005b;483:192–204. doi: 10.1002/cne.20415. [DOI] [PMC free article] [PubMed] [Google Scholar]
- Johnson BA, Woo CC, Hingco EE, Pham KL, Leon M. Multidimensional chemotopic responses to n-aliphatic acid odorants in the rat olfactory bulb. Journal of Comparative Neurology. 1999;409:529–548. [PubMed] [Google Scholar]
- Johnson BA, Woo CC, Leon M. Spatial coding of odorant features in the glomerular layer of the rat olfactory bulb. Journal of Comparative Neurology. 1998;393:457–471. doi: 10.1002/(sici)1096-9861(19980420)393:4<457::aid-cne5>3.0.co;2-#. [DOI] [PubMed] [Google Scholar]
- Kent PF, Youngentob SL, Sheehe PR. Odorant-specific spatial patterns in mucosal activity predict perceptual differences among odorants. Journal of Neurophysiology. 1995;74:1777–1781. doi: 10.1152/jn.1995.74.4.1777. [DOI] [PubMed] [Google Scholar]
- Kent PF, Mozell MM, Youngentob SL, Yurco P. Mucosal activity patterns as a basis for olfactory discrimination: comparing behavior and optical recordings. Brain Research. 2003;981:1–11. doi: 10.1016/s0006-8993(03)02512-5. [DOI] [PubMed] [Google Scholar]
- Kurtz DB, et al. Odorant quality perception: A metric individual differences approach. Perception & Psychophysics. 2000;62:1121–1129. doi: 10.3758/bf03212093. [DOI] [PubMed] [Google Scholar]
- Kurtz DB, White TL, Sheehe PR, Hornung DE, Kent PF. Odorant confusion matrix: the influence of patient history on patterns of odorant identification and misidentification in hyposmia. Physiology & Behavior. 2001;72:595–602. doi: 10.1016/s0031-9384(01)00410-3. [DOI] [PubMed] [Google Scholar]
- Leon M, Johnson BA. Olfactory coding in the mammalian olfactory bulb. Brain Research Reviews. 2003;42:23–42. doi: 10.1016/s0165-0173(03)00142-5. [DOI] [PubMed] [Google Scholar]
- Linster C, Johnson BA, Yue E, Morse A, Xu Z, Hingco EE, Choi Y, Choi M, Messiha A, Leon M. Perceptual correlates of neural representations evoked by odorant enantiomers. Journal of Neuroscience. 2001;15:9837–43. doi: 10.1523/JNEUROSCI.21-24-09837.2001. [DOI] [PMC free article] [PubMed] [Google Scholar]
- Lu XC, Slotnick BM. Olfaction in rats with extensive lesions of the olfactory bulbs: implications for odor coding. Neuroscience. 1998;84:849–66. doi: 10.1016/s0306-4522(97)00520-4. [DOI] [PubMed] [Google Scholar]
- Madany-Mamlouk A, Chee-Ruiter C, Hofmann UG, Bower JM. Quantifying olfactory perception: mapping olfactory perception space by using multidimensional scaling and self-organizing maps. Neurocomputing. 2003;52:591–597. [Google Scholar]
- Malnic B, Hirono J, Sato T, Buck LB. Combinatorial receptor codes for odors. Cell. 1999;96:713–723. doi: 10.1016/s0092-8674(00)80581-4. [DOI] [PubMed] [Google Scholar]
- Meisami E, Sendera TJ. Morphometry of rat olfactory bulbs stained for cytochrome oxidase reveals that the entire population of glomeruli form early in the neonatal period. Developmental Brain Research. 1993;71:253–257. doi: 10.1016/0165-3806(93)90177-c. [DOI] [PubMed] [Google Scholar]
- Meister M, Bonhoeffer T. Tuning and topography in an odor map on the rat olfactory bulb. Journal of Neuroscience. 2001;21:1351–1360. doi: 10.1523/JNEUROSCI.21-04-01351.2001. [DOI] [PMC free article] [PubMed] [Google Scholar]
- Mombaerts P, Wang F, Dulac C, Chao SK, Nemes A, Mendelsohn M, Edmondson J, Axel R. Visualizing an olfactory sensory map. Cell. 1996;87:675–686. doi: 10.1016/s0092-8674(00)81387-2. [DOI] [PubMed] [Google Scholar]
- Moulton DG. Spatial patterning of response to odors in the peripheral olfactory system. Physiological Reviews. 1976;56:578–593. doi: 10.1152/physrev.1976.56.3.578. [DOI] [PubMed] [Google Scholar]
- Mori K, Nagao H, Yoshihara Y. The olfactory bulb: coding and processing of odor molecule information. Science. 1999;286:711–715. doi: 10.1126/science.286.5440.711. [DOI] [PubMed] [Google Scholar]
- Schiffman SS, Robinson D, Erickson TP. Multidimensional scaling of odorants: Examination of psychological and physicochemical dimensions. Chemical Senses & Flavor. 1977;19:715–720. [Google Scholar]
- Schiffman SS, Reynolds ML, Young FW. Introduction to multidimensional scaling: Theory, Methods and Applications. New York: Academic Press; 1984. [Google Scholar]
- Scott JW, Brierly T. A functional map in rat olfactory epithelium. Chemical Senses. 1999;24:679–690. doi: 10.1093/chemse/24.6.679. [DOI] [PubMed] [Google Scholar]
- Stevens DA, O’Connell RJ. Semantic-free scaling of odor quality. Physiology and Behavior. 1996;60:211–215. doi: 10.1016/0031-9384(96)00019-4. [DOI] [PubMed] [Google Scholar]
- Sullivan RM, Leon M. Early olfactory learning induces an enhanced olfactory bulb response in young rats. Brain Research. 1986;392:278–282. doi: 10.1016/0165-3806(86)90256-7. [DOI] [PubMed] [Google Scholar]
- SYSTAT: Statistics, Version 5.2 Edition, Evansont, Il: SYSTAT, Inc, 1992, pp 724.
- Uchida N, Takahashi YK, Tanifuji M, Mori K. Odor maps in the mammalian olfactory bulb: domain organization and odorant structural features. Nature Neuroscience. 2000;3:1035–1043. doi: 10.1038/79857. [DOI] [PubMed] [Google Scholar]
- Vedin V, Slotnick B, Berghard A. Zonal ablation of the olfactory sensory neuroepithelium of the mouse: effects on odorant detection. European Journal of Neuroscience. 2004;20:1858–64. doi: 10.1111/j.1460-9568.2004.03634.x. [DOI] [PubMed] [Google Scholar]
- Xu F, Liu N, Kida I, Rothman DL, Hyder F, Shepherd GM. Odor maps of aldehydes and esters revealed by functional MRI in the glomerular layer of the mouse olfactory bulb. Proceedings of the National Academy of Science, USA. 2003;100:11029–11034. doi: 10.1073/pnas.1832864100. [DOI] [PMC free article] [PubMed] [Google Scholar]
- Yokoi M, Mori K, Nakanishi S. Refinement of odor molecule tuning by dendrodendritic synaptic inhibition in the olfactory bulb. Proceedings of the National Academy of Science, USA. 1995;92:3371–3375. doi: 10.1073/pnas.92.8.3371. [DOI] [PMC free article] [PubMed] [Google Scholar]
- Youngentob SL, Kent PF, Sheehe PR, Schwob JE, Tzoumaka E. Mucosal inherent activity patterns in the rat: evidence from voltage-sensitive dyes. Journal of Neurophysiology. 1995;73:387–398. doi: 10.1152/jn.1995.73.1.387. [DOI] [PubMed] [Google Scholar]
- Youngentob SL, Markert LM, Hill TW, Matyas EP, Mozell MM. Odorant identification in rats: an update. Physiology & Behavior. 1991;49:1293–1296. doi: 10.1016/0031-9384(91)90366-v. [DOI] [PubMed] [Google Scholar]
- Youngentob SL, Markert LM, Mozell MM, Hornung DE. A method for establishing a five-odorant identification confusion matrix task in rats. Physiology & Behavior. 1990;47:1053–1059. doi: 10.1016/0031-9384(90)90352-5. [DOI] [PubMed] [Google Scholar]
- Youngentob SL, Margolis FL, Youngentob LM. OMP gene deletion results in an alteration in odorant quality perception. Behavioral Neuroscience. 2001;115:626–631. doi: 10.1037//0735-7044.115.3.626. [DOI] [PubMed] [Google Scholar]
- Yuan Q, Harley CW, Bruce JC, McLean JH, Knopfel T. Optical imaging of odor preference memory in the rat olfactory bulb. Journal of Neurophysiology. 2002;87:3156–3159. doi: 10.1152/jn.00917.2001. [DOI] [PubMed] [Google Scholar]
- Zou DJ, et al. Postnatal refinement of peripheral olfactory projections. Science. 2004;25:1976–1979. doi: 10.1126/science.1093468. [DOI] [PubMed] [Google Scholar]