Abstract
Ceramide channels formed in the outer membrane of mitochondria have been proposed to be the pathways by which proapoptotic proteins are released from mitochondria during the early stages of apoptosis. We report that sphingosine also forms channels in membranes, but these differ greatly from the large oligomeric barrel-stave channels formed by ceramide. Sphingosine channels have short open lifetimes and have diameters less than 2 nm, whereas ceramide channels have long open lifetimes, enlarge in size reaching diameters in excess of 10 nm. Unlike ceramide, sphingosine forms channels in erythrocyte plasma membranes that vary in size with concentration, but with a maximum possible channel diameter of 2 nm. In isolated mitochondria, a large proportion of the added sphingosine was rapidly metabolized to ceramide in the absence of externally added fatty acids or fatty-acyl-CoAs. The ceramide synthase inhibitor, fumonisin B1 failed to prevent sphingosine metabolism to ceramide and actually increased it. However, partial inhibition of conversion to ceramide was achieved in the presence of ceramidase inhibitors, indicating that reverse ceramidase activity is at least partially responsible for sphingosine metabolism to ceramide. A small amount of cytochrome c release was detected. It correlated with the level of ceramide converted from sphingosine. Thus, sphingosine channels, unlike ceramide channels, are not large enough to allow the passage of proapoptotic proteins from the intermembrane space of mitochondria to the cytoplasm.
Keywords: Mitochondria, apoptosis, sphingolipids, ion channels, ceramidase, ceramide synthase, sphingosine, ceramide
INTRODUCTION
Apoptosis, programmed cell death, is a physiological process required for normal development and tissue homeostasis in multicellular organisms. Deregulation of apoptosis is fundamental to many diseases, such as cancer, stroke, heart disease, neurodegenerative disorders, autoimmune disorders, and viral diseases. Mitochondria are known to play a major regulatory role in apoptosis (Crompton, 1999;Susin et al., 1998). Early in apoptosis, there is an increase in the permeability of the mitochondrial outer membrane, that leads to the release of intermembrane space proteins, including cytochrome c, procaspases, apoptosis inducing factor (AIF), heat shock proteins, Smac/Diablo, and endonuclease G (reviewed in Saelens et al., 2004). The release of intermembrane space proteins into the cytoplasm is crucial for the activation of specific caspases and DNases that are responsible for the execution of apoptosis.
The mechanism for the increased permeability of the mitochondrial outer membrane during the induction phase of apoptosis is currently unknown and highly debated. It is thought to occur by either the permeability transition or the creation of a pore in the outer membrane. Several pathways have been proposed for this pore, including channels formed by Bax oligomers (Antonsson et al., 2000,2001; Saito et al., 2000), the mitochondrial apoptosis-induced channel (MAC) (Pavlov et al., 2001), Bax-induced lipidic pores (Basañez et al., 1999), BH3/Bax/lipid interactions that induce supramolecular openings/lipidic pores (Kuwana et al., 2002; Terrones et al., 2004), and ceramide channels (Siskind et al., 2002,2003; Siskind and Colombini, 2000).
Ceramides form oligomeric barrel-stave channels with estimated diameters larger than 10 nm in planar phospholipid membranes (Siskind et al., 2003). In mitochondrial outer membranes, ceramide channels allow the release of proteins up to 60 kDa in size (Siskind et al., 2002). Even though this cutoff was measured under denaturing conditions and thus is most likely an underestimate, it is still in line with the size of proapoptotic proteins released from mitochondria during apoptosis (cytochrome c 12 kDa, (Dickerson et al., 1971); endonuclease G 28 kDa, (Schafer et al., 2004); AIF 57 kDa, (Mate et al., 2002); Smac/DIABLO 42 kDa, (Chai et al., 2001)). In addition, mitochondria contain enzymes capable of generating ceramide (ceramide synthase and reverse ceramidase) and several apoptotic stimuli have been shown to cause an elevation of mitochondrial ceramide that precedes the mitochondrial phase of apoptosis (Bose et al., 1995; Charles et al., 2001; Kroesen et al., 2001; Perry et al., 2000; Raisova et al., 2000; Rodriguez-Lafrasse et al., 2001; Thomas et al., 1999; Witty et al., 1996). Ceramide-induced apoptosis and cytochrome c release are inhibited by antiapoptotic Bcl-2 proteins (Geley et al., 1997; Ghafourifar et al., 1999; Gottschalk et al., 1994; Wiesner et al., 1997; Zhang et al., 1996). Thus, ceramide channels are indeed good candidates for the pathway by which proapoptotic proteins are released into the cytosol during apoptosis.
Ceramide is a sphingosine-based lipid that is not only formed in mitochondria, but also broken down to sphingosine by a mitochondrial ceramidase (Bionda et al., 2004; El Bawab et al., 2000). Sphingosine itself has been proposed to induce apoptosis (Cuvillier 2002; Cuvillier et al., 2000, 2001; Hung et al., 1999; Jarvis et al., 1996; Sweeney et al., 1998) independent of ceramide. We therefore wanted to determine if sphingosine forms channels like ceramide that are large enough to allow the passage of proapoptotic intermembrane space proteins or alternatively if it acted through its conversion to ceramide. The results of this paper show that while sphingosine does form channels in membranes, these channels are not large enough to be the pathway by which proapoptotic proteins are released from the mitochondrial intermembrane space to the cytoplasm.
MATERIALS AND METHODS
Reagents
The following reagents were purchased from Avanti Polar Lipids (Alabaster, AL): sphingosine, asolectin (polar extract of soybean phospholipids), diphytanoylphosphatidylcholine (DiPyPC), C16-ceramide. Fumonisin B1 (FB1), N-oleylethanolamide (OE), and D-erythro-2-(N-Myristoylamino)-1-phenyl-1-propanol (MAPP) were purchased from Biomol (Plymouth Meeting, PA). Fatty acid depleted bovine serum albumin (BSA), horse heart cytochrome c, sodium ascorbate, antimycin A, 2,4-dinitrophenol (DNP), and cholesterol were purchased from Sigma Chemical Co. (St. Louis, MO). [3-³H]-sphingosine was purchased from American Radiolabeled Chemical Inc. (St. Louis, MO).
Electrophysiological Recordings
Planar membranes were formed by the monolayer method (Montal and Mueller, 1972) as modified (Colombini, 1987), across a 100-µm diameter hole in a Saran partition using 0.5% (w/v) asolectin, 0.5% (w/v) DiPyPC, 0.2% (w/v) cholesterol in hexane to form the monolayers. Except for the reversal potential experiments, the aqueous solution contained 1.0M KCl, 1mM MgCl2, 5 mM PIPES (pH 6.8). The voltage was clamped (trans side was ground) and the current recorded. Sphingosine or C2-ceramide was stirred into the water phase from a Me2SO solution to have a final concentration of vehicle less than 0.5%. Conductance measurements were performed in the voltage clamp mode. Data were filtered by a low-pass 4-pole Bessel filter (Model LPF-202, Warner Instrument Corp., Hamden, CT) at 1 kHz, recorded on a chart recorder, and directly saved into computer memory with a sampling frequency of 2 kHz.
Reversal Potential Measurements
Planar membranes were formed as above. The aqueous solutions were 100 mM and 1.0 M KCl on the trans and cis side, respectively. Both sides also contained 1 mM MgCl2, and 5 mM PIPES (pH 6.8). The reversal potential of sphingosine channels was determined by applying continuous symmetrical triangular voltage waves at a frequency of 0.1 Hz and the current was recorded both before and after the addition of sphingosine to the aqueous phase on both sides of the membrane. The application of triangular voltage waves enabled the recording of the current–voltage relationship as a function of time. From the linear portions of the current–voltage relationship, the conductance and reversal potential of the sphingosine-induced conductances were determined from the slope and intercept, respectively. All calculations were corrected for the bias current, the electrode asymmetry, the conductance of the unmodified membrane, and the capacitive current.
Erythrocyte Experiments
Erythrocytes were obtained from decapitated male Sprague-Dawley rats in a solution of 150 mM NaCl, 4 mM EGTA, 5 mM HEPES pH 7.4 to prevent clotting. They were used within 3 days. Erythrocytes were washed in successive centrifugation steps followed by resuspension in the above buffer. 50 µL of erythrocytes (40 mg protein/mL stock) were added to 450 µL of an equiosmolar solution of the test nonelectrolyte or isolation buffer. We used glucose, sucrose, raffinose, and polyethelene glycol 1500 with molecular weights of 180, 342, 504, and 1500, respectively. Sphingosine was added at the indicated concentration (the final [DMSO] was less that 1%), incubated for 15 min, and then the cells were sedimented (5 min at 12,000 × g). 400 µL of supernatant was added to 400 µL of Drabkin’s reagent (Sigma Technical Bulletin No. 525) and the absorbance measured at 540 nm after 5 min. The percent lysis of the erythrocytes was determined from the maximum possible absorbance at 100% lysis obtained after the addition of Triton X-100 (0.5% (w/v) final).
Mitochondrial Isolation and Cytochrome c Release
Rat liver mitochondria were isolated by differential centrifugation of tissue homogenate as described previously (Siskind et al., 2002).Mitochondrial intactness was determined by the rate of oxidation of exogenously-added cytochrome c as compared to the rate measured with mitochondria with hypotonically lysed outer membranes as described previously (Siskind et al., 2002). The percent cytochrome c release following incubation with sphingosine was determined using a cytochrome c ELISA test (R&D systems). Briefly, mitochondria (0.6 mg/mL, 0.6 mL total volume) were incubated with a particular concentration of sphingosine (0.2—2 µM final concentration) for 5, 15, or 30 min (with and without inhibitors of sphingolipid metabolism). The mitochondria were pelleted and the supernatant assayed for cytochrome c content. The percent cytochrome c release was expressed as a percent of the total cytochrome c released following rupture of the mitochondrial outer membrane by hypotonic shock as described in Siskind et al. (2002).
Sphingosine Insertion
0.6 mL of isolated mitochondria (0.6 mg/mL) were incubated with [³H]-sphingosine (final concentration 2 µM) and 1 µM BSA (fatty acid depleted) for 5, 15, or 30 min in the presence or absence of inhibitors of sphingolipid metabolism. Half the mitochondria were then pelleted (at 12, 000 × g for 5 min) and the other half left unspun. 500 µL of supernatant was then subjected to scintillation counting. Percent insertion of [³H]-sphingosine was determined from the difference between total radioactivity in the solution and that after removal of mitochondria by centrifugation.
Sphingosine Metabolism in Isolated Mitochondria
Isolated mitochondria were treated as in the above sphingosine insertion experiments except that after pelleting the mitochondria (12,000 × g), the entire supernatant was removed and the lipids were isolated from the mitochondrial pellet according to the method of Bligh and Dyer, 1959. Briefly, 0.6 mL H2O was added to the mitochondrial pellet followed by the addition of 0.8 mL CH3 OH and 1.6 mL CHCl3. The samples were vortexed and put onto ice for 60 min. The aqueous phase was discarded and the organic phase dried under N2. The lipids were dissolved in 60 µL CHCl3: CH3OH (95:5, v/v) and separated by silica gel thin layer chromatography (TLC) with chloroform: methanol: acetic acid (65:15:5 v/v) and then developed in I2. The bands comigrating with sphingosine and N-hexadecyl-D-erythro-sphingosine (C16-ceramide) standards (and all other bands present) were scraped into separate vials and analyzed by scintillation counting.
RESULTS
Sphingosine Forms Channels in Planar Phospholipid Membranes
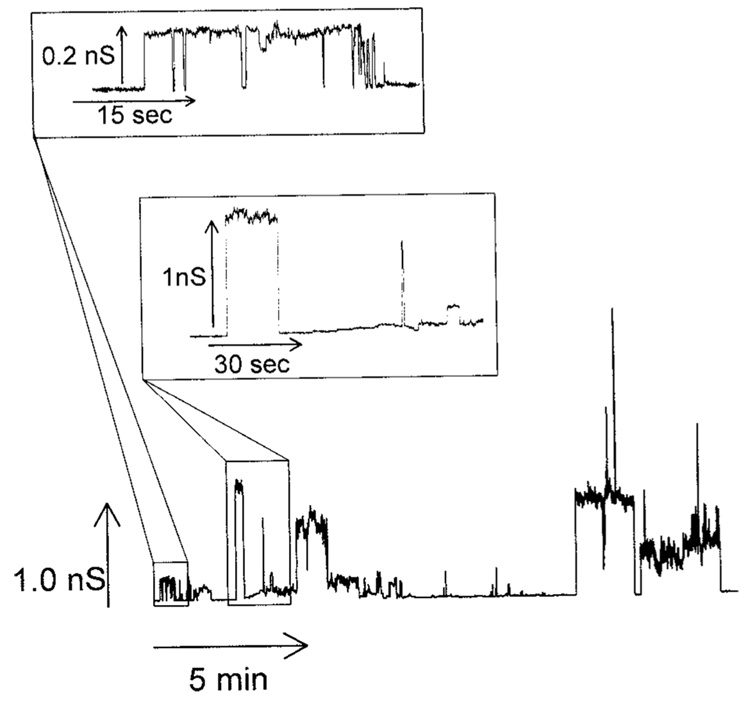
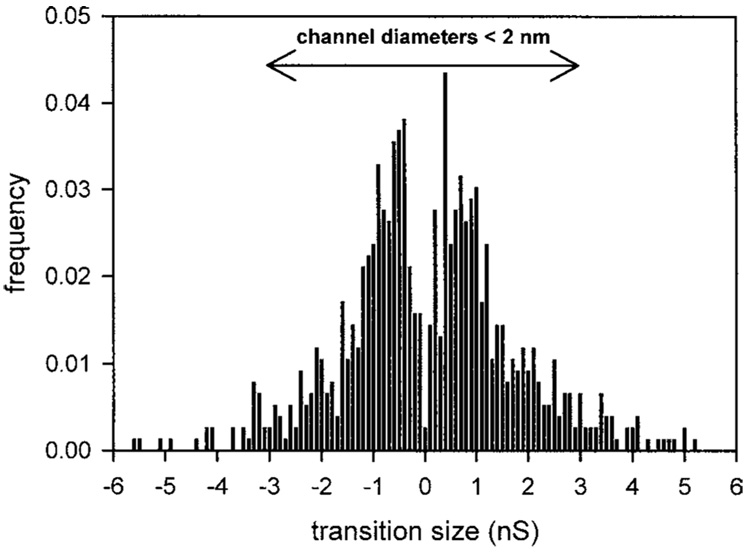
The effect of sphingosine on membrane conductance was monitored by utilizing the planar membrane technique. The addition of sphingosine (3 µM final) to the aqueous phase on either one or both sides of the planar phospholipid membrane resulted in pore formation (Fig. 1). These stepwise current increases are diagnostic of sphingosine channel formation in the membrane. Sphingosine conductance transitions varied in size from as small as 50 pS to as large as 6.5 nS (Fig. 2). The range of conductance transitions observed corresponds to estimated channel diameters less than 2 nm.
Fig. 1.
Sphingosine forms channels in planar phospholipid membranes. Example of sphingosine channels following the addition of sphingosine (3 µM final) to the aqueous phase on the cis side of a planar phospholipid membrane with the voltage clamped at +10mV. The two insets are enlarged sections of the main figure.
Fig. 2.
Distribution of conductance increments and decrements observed after the addition of sphingosine to the cis side of a planar phospholipid membrane. Increments and decrements are given positive and negative signs, respectively. The range of conductance transitions corresponding to channels less than 2 nm in diameter is indicated. Data are the combined results from 11 experiments. The frequency was calculated by dividing the number of observed conductance transitions within a particular bin range by the total number of observed increments and decrements.
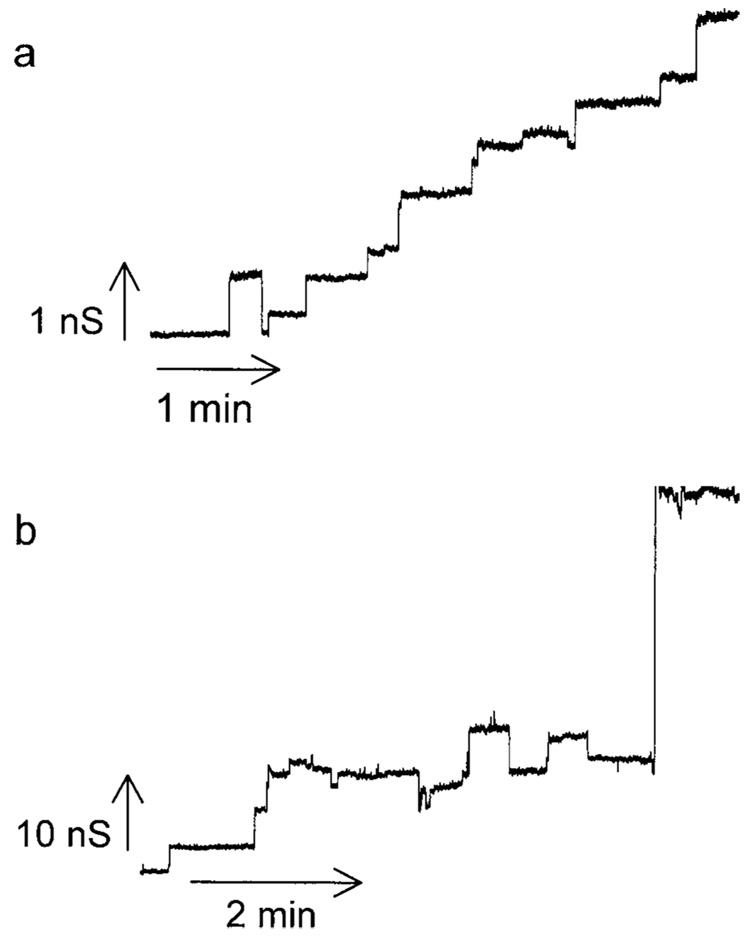
The conductance formed by sphingosine is qualitatively very different from that formed by ceramide (compare Fig. 1 and Fig. 3). The sphingosine conductance fluctuates rapidly while that formed by ceramide tends to increase much like a staircase. Previous work showed that the discrete increments in ceramide conductance were generally not the result of the formation of new channels but the growth in size of one individual channel. The sphingosine conductance seems to be made up of multiple individual channels with a relatively short lifespan. Because of the short open time of the sphingosine channels, the overall membrane conductance does not tend to increase significantly as new channels form (Fig. 1) until there are enough channels in the membrane so that multiple channels are open at the same time. This rapid opening and closing of individual channels results in a very noisy conductance when many channels are present and this too is distinct from what is observed with ceramide. Both sphingosine and ceramide channels exhibit a range of conductance increments and decrements. From the histogram of conductance transitions it is obvious that the range of conductance transitions observed with sphingosine (0.05–6.5 nS; Fig. 2) is significantly smaller than those observed with ceramide (1–60 nS; Siskind et al., 2003;Siskind and Colombini, 2000). Thus, ceramide channels are much larger and more stable than those formed by sphingosine.
Fig. 3.
Two examples of a ceramide channel formed in planar phospholipid membranes. Small (a) and large (b) conductance increments in the growth of individual ceramide channels observed following the addition of C2-ceramide (5 µM final) to the aqueous phase bathing the cis side of a planar phospholipid membrane.
We have previously reported that ceramide channels enlarge and shrink in size; individual conductance increments and decrements generally represent the enlargement and shrinkage of a single channel in the membrane rather than the formation and dissolution of novel channels (Siskind et al., 2003). One evidence for this is the observation that ceramide conductance decrements are much larger in size than the largest observed increments (Siskind et al., 2003). For sphingosine this is not the case. Sphingosine increments mirror the observed decrements (Fig. 2), indicating that the conductance transitions most likely represent individual sphingosine channels acting in parallel.
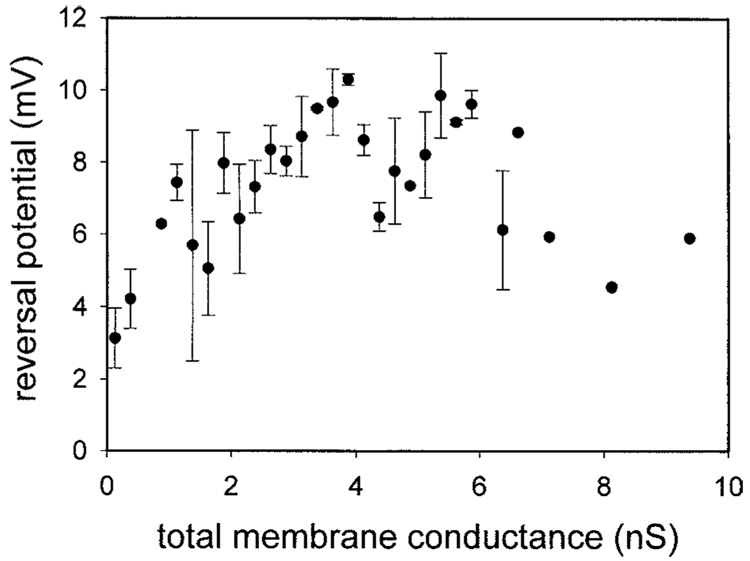
Sphingosine and ceramide channels also differ in terms of their selectivities. Very small ceramide channels are cation selective and this selectivity decreases drastically as the total membrane conductance increases until the channel(s) are no longer selective (Siskind et al., 2003). Sphingosine channels are weakly anion selective and their selectivity does not change with increasing total membrane conductance (Fig. 4). Increases in channel size are usually accompanied by a decrease in ion selectivity, whereas channels conducting in parallel have the same selectivity. Thus, unlike ceramide channels, sphingosine channels remain small and conductance increments represent the formation of novel channels acting in parallel in the membrane.
Fig. 4.
Selectivity measurements indicate that sphingosine channels do not enlarge in size. Experiments were performed in the presence of a 10-fold KCl gradient. The reversal potential was measured as a function of increasing membrane conductance as described in the Methods. Data are means ± SD of results from three separate experiments.
Sphingosine Forms Channels in Plasma Membranes of Erythrocytes
Erythrocytes contain osmotically-active solutes, especially hemoglobin and its counterions that must be balanced by extracellular solutes to prevent bulk water movement and cell lysis. The insertion of a channel into the erythrocyte membrane that allows extracellular solutes to enter results in an osmotic influx of water, increasing the cell volume and intracellular pressure until the cell membrane tears and hemoglobin is released. Lysis of erythrocytes in the presence of a test channel-former can be prevented by incubation in a medium that contains a solute that is too large to enter the erythrocyte through the test channels and thus there is no osmotic water flow and no lysis. By suspending cells in isoosmotic solutions composed of different size solutes, one can determine which solute is permeable and consequently the size of the permeability pathway in the erythrocyte membrane. This allows one not only to detect the formation of channels in the erythrocyte membrane but also to measure their size (Tejuca et al., 2001). We therefore performed hemolysis experiments to get an estimate of the diameter of sphingosine channels formed in the plasma membranes of erythrocytes.
Erythrocytes were dispersed into media containing either salt or nonelectrolytes of different sizes. Sphingosine was added, the cells were separated from the medium after incubation for a set time, and the percent of lysed erythrocytes (from comparing the amount of hemoglobin in the supernatant to the total amount for 100% lysis) quantitated. From time courses it was determined that hemolysis was essentially complete after 15 min and this was used as the standard time for testing.
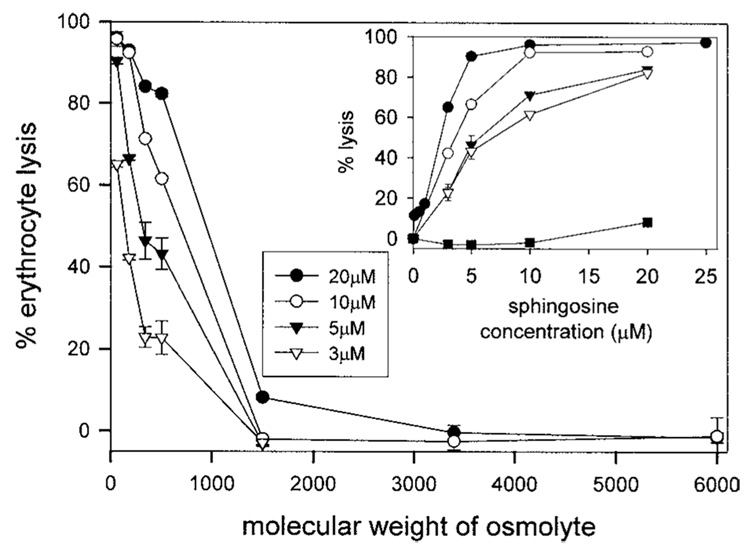
At 20 µM sphingosine, the channels are permeable to raffinose, but not PEG1500 (Fig. 5). There appears to be a uniform population of channels present or at least all the cells have some channels with diameters between 1.3 nm (based on the hydrated radius of raffinose; Schultz and Solomon, 1961) and 2.4 nm (based on the hydrated radius of PEG1500; Kuga, 1981). At 10 µM sphingosine, all the cells have channels permeable to glucose but only a portion of these have channels large enough to allow sucrose and raffinose to permeate (Fig. 5). Likewise, at 5 and 3 µM sphingosine, the proportion of cells capable of passing the larger nonelectrolytes is greatly diminished yet all are able to allow NaCl to permeate. Thus, the size of the channels formed varies over a narrow range depending on the amount of sphingosine present: from 0.5 to 2 nm in diameter. However, at levels of sphingosine above 20 µM, the channel diameters do not increase any further, indicating that there is a maximum channel diameter. The maximal estimated pore size is in line with the one calculated from the conductance transitions observed in planar phospholipid membranes (2 nm; see Fig. 2).
Fig. 5.
Sphingosine channels in erythrocyte plasma membranes have diameters less than 2 nm. In the main figure, erythrocytes (4 mg hemoglobin/mL) were added to solutions equiosmolar in test nonelectrolytes or isolation buffer and incubated for 15 min with sphingosine at the concentrations indicated. The percent lysis of the erythrocytes is the amount of hemoglobin released expressed as a percentage of the total hemoglobin released after addition of Triton X-100. The inset is a replot of the data from the main figure portraying erythrocyte lysis as a function of sphingosine concentration. The symbols in the inset are as follows: filled circles, NaCl; open circles, glucose; filled triangles, sucrose; open triangles, raffinose; filled squares, PEG-1500. The data are means ± SD of duplicates from three separate experiments (generally error bars are smaller than the symbols). It was previously reported that sphingosine causes hemolysis (52).
The Action of Sphingosine on Isolated Mitochondria
In order to directly determine if sphingosine permeabilizes the mitochondrial outer membrane to cytochrome c, and thus causes its release, sphingosine was added directly to mitochondria isolated from rat liver. We were unable to measure the permeability of the outer mitochondrial membrane by assaying the oxidation rate of exogenously-added reduced cytochrome c as was done previously for ceramide channels (Siskind et al., 2003); sphingosine, unlike ceramide, completely inhibits cytochrome c oxidase even at concentrations less than 1 µM (data not shown and Igisu et al., 1988). The presence of an intact outer mitochondrial membrane did not abrogate this inhibition. Instead, the amount of cytochrome c released by isolated mitochondria was measured using a commercial ELISA assay (see Methods).
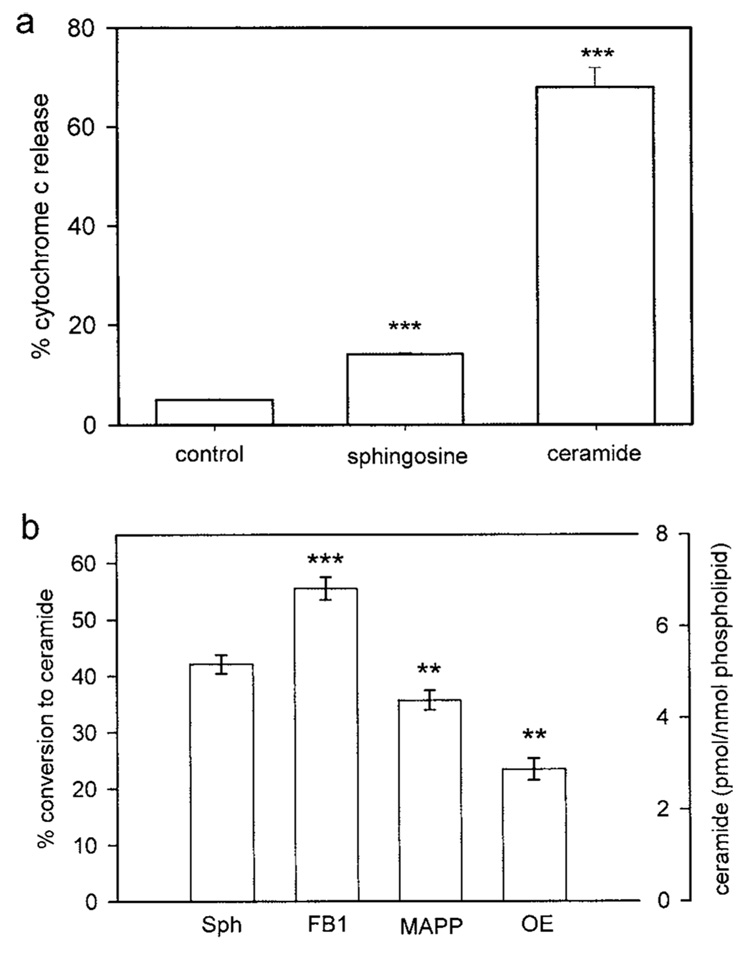
Sphingosine added to isolated mitochondria (2 µM final) induced the release of only 14 ± 0.2% of the total cytochrome c as compared to 68 ± 4% release induced by the same amount of added C2-ceramide and 5 ± 0.2% release from untreated mitochondria (Fig. 6(a)). This would indicate that sphingosine induces a small, albeit statistically significant, release of cytochrome c from isolated mitochondria. However, mitochondria are capable of converting sphingosine to ceramide (Bionda et al., 2004). Indeed, even in the absence of added cosubstrates, fatty acids and acyl-CoA, (and the presence of fatty-acid free BSA in the mitochondrial isolation medium to remove endogenous fatty acids), a large fraction of the added sphingosine was converted to ceramide (Fig. 6(b)). When 2 µM [³H]sphingosine was added to isolated mitochondria, 42 ± 2% (5.1 ± 0.2 pmol ceramide/nmol phospholipid) was converted to [³H]ceramide (Fig. 6(b)). Incubation of mitochondria with the ceramide synthase inhibitor FB1 (5 µM) before the addition of 2 µM sphingosine increased the conversion to ceramide to 55 ± 2 % (6.7 pmol ceramide/nmole phospholipid) (Fig. 6). Ceramidase inhibitors, MAPP or OE, decreased the conversion to 36 ± 2 (4.3 ± 0.2 pmol ceramide/nmol phospholipid) and 23 ± 2% (2.9 pmol ceramide/ nmol phospholipid), respectively (Fig. 6). Preincubation of mitochondria with MAPP and OE together did not completely block conversion of sphingosine to ceramide (data not shown).
Fig. 6.
Sphingosine added to isolated mitochondria induces a small percent of release of cytochrome c and is converted to ceramide. (a) Cytochrome c release from 0.6 mL mitochondria (0.6 mg/mL) untreated (control), or incubated with 2 µM sphingosine or ceramide for 15 min was measured and expressed as a function of the total cytochrome c released from mitochondria with ruptured outer membranes. (b) Isolated mitochondria were incubated with [³H]-sphingosine (final concentration 2 µM) and 1 µM BSA (fatty acid depleted) for 15 min in the presence or absence (Sph) of inhibitors of sphingolipid metabolism (5 µM; FB1, fumonisin B1; MAPP, D-erythro-2-(N-myristoylamino)-1-phenyl-1-propanol; OE, N-oleylethanolamide). The percent conversion to ceramide and the corresponding level of ceramide are displayed on the two y axes. Data are means ± SD of triplicates from three separate experiments. The levels of statistical significance from control (Sph) are: ** P ≤ 0.01; *** P ≤ 0.001.
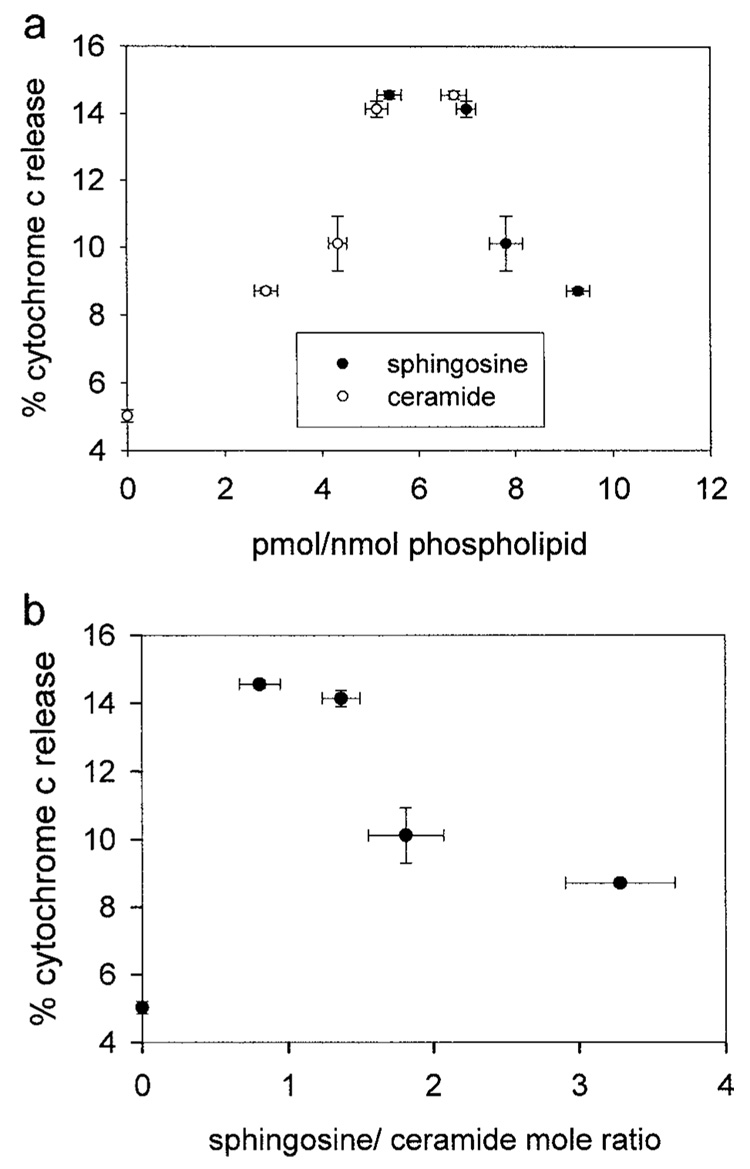
Addition of sphingosine to isolated mitochondria resulted in small amounts of cytochrome c release. However, this release could be attributed to the conversion of sphingosine to ceramide because there was more release of cytochrome c at lower levels of sphingosine and at higher levels of ceramide in the membrane (Fig. 7(a)). Indeed, the percent release of cytochrome c in Fig. 7(a) was lower than expected given the levels of ceramide formed from the added sphingosine. The exogenous addition of 2 µM C2-ceramide (Fig. 6(a)) to isolated mitochondria corresponded to 5.3 pmol ceramide inserted/nmol phospholipid and there was no conversion of C2-ceramide to sphingosine detected (data not shown). This level of C2-ceramide resulted in the release of 68 ± 4% of the cytochrome c. However, 6.7 pmoles of ceramide (converted from sphingosine)/nmole phospholipid only resulted in 14.6 ± 0.1% cytochrome c release (Fig. 7(a)). This difference is not due to the type of ceramide used as C16-ceramide added to isolated mitochondria at only 4–8 pmole of ceramide per nmole mitochondrial phospholipid forms channels large enough for cytochrome c to permeate (manuscript in preparation). Moreover, we find that the percent of cytochrome c release is inversely proportional to the ratio of sphingosine to ceramide in the mitochondrial membranes (Fig. 7(b)). This suggests that sphingosine inhibits or antagonizes the ability of ceramide to form protein permeable channels. Alternatively, these differences could also be due to the particular membrane in which the ceramide generation occurs. Bionda et al. (2004) showed that both mitochondrial outer and inner membranes contain ceramide synthase. Thus, ceramide generation in the mitochondrial inner membrane could also account for these differences. Regardless, the results with isolated mitochondria argue strongly that sphingosine does not form channels large enough to allow proteins to cross membranes.
Fig. 7.
The percent cytochrome c released from isolated mitochondria correlates with the level of ceramide converted from sphingosine. Isolated mitochondria were incubated with varying concentrations of [³H]-sphingosine (0.2–2 µM) for 15 min, and some of the sphingosine was converted to ceramide. (a) Cytochrome c release as a function of radiolabeled sphingosine or ceramide present. The percent cytochrome c release is statistically different from the control in the following manner (given in order of the level with the highest cytochrome c release to the lowest): P ≤ 0.001, P ≤ 0.001, P ≤ 0.01, P ≤ 0.001. (b) Data from section (a) expressed as the ratio of unconverted sphingosine to ceramide converted from sphingosine. The negative correlation between the percent cytochrome c release and the ratio of sphingosine to ceramide is statistically significant at the level of <0.01. Data are means ± SD of triplicate samples from three separate experiments.
DISCUSSION
In this study, we demonstrated for the first time that sphingosine forms channels in planar phospholipid membranes and erythrocytes. Characterization of sphingosine channels in these systems and in isolated mitochondria indicates that they are too small to allow proteins to cross membranes. Sphingosine channels have characteristics that differ greatly from ceramide channels. In planar phospholipid membranes, sphingosine channels have short open lifetimes, do not enlarge in size, and have diameters less than 2 nm, whereas ceramide channels have long open lifetimes, enlarge in size, and can reach diameters in excess of 10 nm. Sphingosine channels are somewhat anion selective and the selectivity does not vary with increasing total membrane conductance. Very small initial ceramide channels are cation selective and the selectivity decreases drastically with increasing total membrane conductance, indicating channel growth (Siskind et al., 2003). Our previous work with ceramide channels has shown that they form large barrel-stave channels that enlarge and shrink in size in a defined manner; the individual conductance increments do not represent the formation of novel channels, but rather the enlargement of preexisting channels (Siskind et al., 2003). Our current work with sphingosine channels indicates that these channels do not exhibit such behavior; the conductance increments and decrements represent the formation and dissolution of separate channels conducting in parallel. The data indicate that it is the amide linkage and its capacity to form hydrogen bonds that allows ceramide channels to enlarge to sizes that allow proteins to permeate. With free amino groups, sphingosine molecules are unable to form the columns that are predicted to make up the ceramide annuli (Siskind et al., 2003; Siskind and Colombini, 2000). Thus, it is not surprising that sphingosine channels are not as stable or large as those formed by ceramide.
Sphingosine does form channels in erythrocyte plasma membranes similar in size to the ones formed in planar phospholipid membranes. In erythrocyte plasma membranes the diameter of the channels depends on the sphingosine concentration with the maximum achievable diameter around 2 nm. Unlike sphingosine, ceramides do not form channels in erythrocyte plasma membranes, regardless of the concentration in the membrane (manuscript in preparation). We found no conversion of sphingosine to ceramide in erythrocytes (data not shown).
The data on sphingosine action on isolated rat liver mitochondria indicates that sphingosine channels are too small to allow cytochrome c to permeate. Because the percent of cytochrome c release increased with the proportion of sphingosine converted to ceramide and decreased with the proportion of unconverted sphingosine, it is highly unlikely that sphingosine channels are responsible for the release of cytochrome c. In addition, the estimates of sphingosine channel diameter, 2 nm, is too small to allow cytochrome c to permeate (the estimated diameter of cytochrome c is 3.4 nm (Dickerson et al., 1971)). Thus sphingosine channels are indeed too small to allow proteins to permeate. Instead, it is the conversion of sphingosine to ceramide and ceramide channel formation that is responsible for the formation of channels large enough to allow proapoptotic intermembrane space proteins to be released into the cytosol.
We were surprised by the percent of sphingosine that was converted to ceramide (over 40% of the sphingosine that inserted into the mitochondria) and the rapid manner in which it was converted (leveled off within 15 min). In addition, we were unable to completely inhibit the conversion of sphingosine to ceramide even in the presence of inhibitors of ceramide synthase (FB1) and ceramidase (MAPP and/or OE) alone or in combination. Bionda et al. (2004) found that FB1 actually activated mitochondrial ceramide synthase when sphingosine and palmitoyl-CoA were used as substrates. This could explain the increased conversion of sphingosine to ceramide we observed in isolated mitochondria incubated with FB1 and sphingosine.
It has been proposed that sphingosine plays a role in apoptosis induction independent of ceramide. Clearly, many studies have indicated an elevation in cellular sphingosine levels following an apoptotic stimulus and sphingosine added to cell cultures induces apoptosis (for example, Cuvillier, 2002; Cuvillier et al., 2000, 2001;Nava et al., 2000; Sweeney et al., 1998). However, many studies depend on inhibitors of sphingosine metabolism to conclude that sphingosine itself, and not one of its metabolites, is apoptotic (Cuvillier et al., 2000, 2001; Hung et al., 1999; Jarvis et al., 1996; Ohta et al., 1995; Sweeney et al., 1998). It is clear from our results and the results of Bionda et al., 2004 that mitochondrial ceramide synthase is not inhibited by FB 1 and is in fact activated when sphingosine (as opposed to sphinganine) is used as a substrate. In addition, isolated mitochondria are capable of converting sphingosine to ceramide via reverse ceramidase, which can at least be partially inhibited by MAPP and OE. There are many complicating factors that make interpretation of whole cell studies difficult. These include the multiple subcellular locations of sphingosine generation and/or metabolism (Riebeling et al., 2003; Venkataraman et al., 2002), the specificity of inhibitors, and the ability of exogenously-added inhibitors to reach a given subcellular location. Thus, the conclusion that sphingosine induces apoptosis is on shaky ground.
Bionda et al. (2004) studied ceramide synthase or reverse ceramidase activity in isolated mitochondria by adding both sphingosine and palmitate (or palmitoyl-CoA) and measuring ceramide generation. It was surprising to us that isolated mitochondria could convert exogenously-added sphingosine to ceramide in medium not supplemented with fatty-acyl CoAs or fatty acids as ceramide synthase requires fatty acyl CoAs and reverse ceramidase requires fatty acids. The conversion of sphingosine to ceramide in isolated mitochondria was partially inhibited by ceramidase inhibitors. Reverse ceramidase utilizes fatty acids and not fatty acyl-CoAs as substrates for the acylation of sphingosine (Okino et al., 2003). However, the mitochondria were isolated in the presence of bovine serum albumin (fatty acid free) and thus it is doubtful that there is a large enough source of free fatty acids to accommodate the level of conversion to ceramide that was achieved here. This indicates that there could be an additional source of fatty acids and/or an unknown mechanism for the acylation of sphingosine to ceramide.
Sphingosine channels are not large enough to release proteins from mitochondria during the induction phase of apoptosis. However, sphingosine channels could influence the apoptotic process in a variety of ways. Sphingosine channels in the inner membrane could induce the permeability transition (PT), a process believed to initiate mitochondria-mediated apoptosis. Sphingosine inhibition of cytochrome c oxidase could lead to the production of reactive oxygen species, which could also lead to the induction of apoptosis. Alternatively, sphingosine channel formation in the outer membrane could serve an antiapoptotic role. Closure of VDAC and the subsequent failure to exchange metabolites between mitochondria and the cytosol has been proposed to be an early step in the initiation of apoptosis. In addition, the antiapoptotic protein Bcl-xL has been shown to promote VDAC’s open configuration (Vander Heiden et al., 2001) while the proapoptotic protein, cut Bid, has been shown to promote VDAC closure (Rostovtseva et al., 2004). Thus sphingosine channels could inhibit apoptosis by restoring metabolite flux when VDAC channels are closed.
Sphingosine could also protect cells from the lethal action of ceramide channels by interacting with ceramide and thus depleting the pool of ceramide available to form channels. In addition, sphingosine and ceramide could interact and form hybrid channels that are too small to allow the release of proapoptotic proteins from mitochondria, but large enough to allow metabolites to exchange. Indeed, as Fig. 7(b) indicates, the percent cytochrome c release declines as the ratio of sphingosine to ceramide increases. Thus, whether or not sphingosine is anti- or proapoptotic most likely depends on the submitochondrial location in which it is generated and the local concentration of sphingosine (and ceramide).
Bionda et al. (2004) recently showed that ultrapure isolated rat liver mitochondria (free from contamination with microsomes and the mitochondrial associated membrane/membrane/endoplasmic reticulum-related compartment) possessed ceramide synthase and reverse ceramidase activities (Bionda et al., 2004). They found ceramide synthase activity in both the outer and inner membranes (Bionda et al., 2004). It is still unknown in which mitochondrial membrane ceramidase is located. The local environment may play a role in regulating whether ceramidase or reverse ceramidase activity is favored. For example, Okino et al., 2003 found that cardiolipin is potent inhibitor of reverse ceramidase activity and activator of ceramidase activity. Thus, the presence of cardiolipin in the inner mitochondrial membrane would favor sphingosine formation. The fact that the ceramidase inhibitors partially inhibited the conversion of sphingosine to ceramide implies that mitochondrial reverse ceramidase activity is indeed present in at least the outer membrane.
The results of this paper show that sphingosine forms channels that are characteristically very different from ceramide channels. Unlike ceramide channels, sphingosine channels are too small to be the pathway by which proapoptotic intermembrane space proteins are released from mitochondria during apoptosis. However, sphingosine channels may directly influence the apoptotic process depending on the location in which they are formed.
ACKNOWLEDGMENTS
This work was supported by National Institutes of Health grant NS42025.
Abbreviations used
- AIF
apoptosis inducing factor
- MAC
mitochondrial apoptosis-induced channel
- pS
picoSiemens
- nS
nanoSiemens
- DiPyPC
diphytanoylphosphatidylcholine
- FB1
fumonisin B1
- OE
N-oleylethanolamide
- MAPP
D-erythro-2-(N-myristoylamino)-1-phenyl-1-propanol
- BSA
bovine serum albumin
- DNP
2,4-dinitrophenol
- PIPES
piperazine-N,N′-bis[2-ethanesulfonic acid]
- TLC
thin layer chromatography
- C16-ceramide
N-hexadecyl-D-erythro-sphingosine
- PT
permeability transition
- VDAC
voltage dependent anion-selective channel.
REFERENCES
- Antonsson B, Montessuit S, Lauper S, Eskes R, Martinou JC. Biochem. J. 2000;345:271–278. [PMC free article] [PubMed] [Google Scholar]
- Antonsson B, Montessuit S, Sanchez B, Martinou JC. J. Biol. Chem. 2001;276:11615–11623. doi: 10.1074/jbc.M010810200. [DOI] [PubMed] [Google Scholar]
- Basañez G, Nechushtan A, Drozhinin O, Chanturiya A, Choe E, Tutt S, Wood KA, Hsu Y-T, Zimmerburg J, Youle RJ. Proc. Natl. Acad. Sci. U.S.A. 1999;96:5492–5497. doi: 10.1073/pnas.96.10.5492. [DOI] [PMC free article] [PubMed] [Google Scholar]
- Bionda C, Portoukalian J, Schmitt D, Rodriguez-Lafrasse C, Ardail D. Biochem. J. 2004;382:527–533. doi: 10.1042/BJ20031819. [DOI] [PMC free article] [PubMed] [Google Scholar]
- Bligh EA, Dyer WJ. Can. J. Biochem. Physiol. 1959;37:911–917. doi: 10.1139/o59-099. [DOI] [PubMed] [Google Scholar]
- Bose R, Verheij M, Haimovitz-Friedman A, Scotto K, Fuks Z, Kolesnick RN. Cell. 1995;82:405–414. doi: 10.1016/0092-8674(95)90429-8. [DOI] [PubMed] [Google Scholar]
- Chai J, Shiozaki E, Srinivasula SM, Wu Q, Datta P, Alnemri ES, Shi Y, Dataa P. Cell. 2001;104:769–780. doi: 10.1016/s0092-8674(01)00272-0. [DOI] [PubMed] [Google Scholar]
- Charles AG, Han TY, Liu YY, Hansen N, Giuliano AE, Cabot MC. Cancer Chemother. Pharmacol. 2001;47:444–450. doi: 10.1007/s002800000265. [DOI] [PubMed] [Google Scholar]
- Colombini M. Methods Enzymol. 1987;148:465–475. doi: 10.1016/0076-6879(87)48045-2. [DOI] [PubMed] [Google Scholar]
- Crompton M. Biochem. J. 1999;342:233–249. [PMC free article] [PubMed] [Google Scholar]
- Cuvillier O. Biochim. Biophys. Acta. 2002;1585:153–162. doi: 10.1016/s1388-1981(02)00336-0. [DOI] [PubMed] [Google Scholar]
- Cuvillier O, Edsall RL, Spiegel S. J. Biol. Chem. 2000;275:15691–15700. doi: 10.1074/jbc.M000280200. [DOI] [PubMed] [Google Scholar]
- Cuvillier O, Nava VE, Murthy SK, Edsall LC, Levade T, Milstien S, Spiegel S. Cell Death Differ. 2001;8:162–171. doi: 10.1038/sj.cdd.4400793. [DOI] [PubMed] [Google Scholar]
- Dickerson RE, Takano T, Eisenberg D, Kallai OB, Samson L, Cooper A, Margoliash E. J. Biol. Chem. 1971;246:1511. [PubMed] [Google Scholar]
- El Bawab S, Roddy P, Qian T, Bielawska A, Lemasters JJ, Hannun YA. J. Biol. Chem. 2000;275:21508–21513. doi: 10.1074/jbc.M002522200. [DOI] [PubMed] [Google Scholar]
- Geley S, Hartmann BL, Kofler R. FEBS Lett. 1997;400:15–18. doi: 10.1016/s0014-5793(96)01284-7. [DOI] [PubMed] [Google Scholar]
- Ghafourifar P, Klein SD, Schucht O, Schenk U, Pruschy M, Rocha S, Richter C. J. Biol. Chem. 1999;274:6080–6084. doi: 10.1074/jbc.274.10.6080. [DOI] [PubMed] [Google Scholar]
- Gottschalk A, Boise L, Thompson C, Quintáns J. Proc. Natl. Acad. Sci. U.S.A. 1994;91:7350–7354. doi: 10.1073/pnas.91.15.7350. [DOI] [PMC free article] [PubMed] [Google Scholar]
- Hung W-C, Chang H-C, Chuang L-Y. Biochem. J. 1999;338:161–166. [PMC free article] [PubMed] [Google Scholar]
- Igisu H, Hamasaki N, Ito A, Ou W. Lipids. 1988;23:345–348. doi: 10.1007/BF02537346. [DOI] [PubMed] [Google Scholar]
- Jarvis WD, Fornari FA, Jr., Traylor RS, Martin HA, Kramer LB, Erukulla RK, Bittman R, Grant S. J. Biol. Chem. 1996;271:8275–8284. doi: 10.1074/jbc.271.14.8275. [DOI] [PubMed] [Google Scholar]
- Kroesen B-J, Pettus B, Luberto C, Busman M, Sietsma H, Leij LD, Hannun YA. J. Biol. Chem. 2001;276:13606–13614. doi: 10.1074/jbc.M009517200. [DOI] [PubMed] [Google Scholar]
- Kuga S. J. Chromatogr. 1981;206:449–461. [Google Scholar]
- Kuwana T, Mackey MR, Perkins G, Ellisman MH, Latterich M, Schneiter R, Green DR, Newmeyer DD. Cell. 2002;111:331–342. doi: 10.1016/s0092-8674(02)01036-x. [DOI] [PubMed] [Google Scholar]
- Mate MJ, Ortiz-Lombardia M, Boitel B, Haouz A, Tello D, Susin SA, Penninger J, Kroemer G, Alzari PM. Nat. Struct. Biol. 2002;9:442–446. doi: 10.1038/nsb793. [DOI] [PubMed] [Google Scholar]
- Montal M, Mueller P. Proc. Natl. Acad. Sci. U.S.A. 1972;69:3561–3566. doi: 10.1073/pnas.69.12.3561. [DOI] [PMC free article] [PubMed] [Google Scholar]
- Nava VE, Cuvillier O, Edsall LC, Kimura K, Milstien S, Gelmann EP, Spiegel S. Cancer Res. 2000;60:4468–4474. [PubMed] [Google Scholar]
- Ohta H, Sweeney EA, Masamune A, Yatomi Y, Hakomori S, Igarashi Y. Cancer Res. 1995;55:691–697. [PubMed] [Google Scholar]
- Okino N, He X, Gatt S, Sandhoff K, Ito M, Schuchman EH. J. Biol. Chem. 2003;278:29948–29953. doi: 10.1074/jbc.M303310200. [DOI] [PubMed] [Google Scholar]
- Pavlov EV, Priault M, Pietkiewicz D, Cheng EH-Y, Antonsson B, Manon S, Korsmeyer SJ, Mannella CA, Kinnally KW. J. Cell Biol. 2001;155:725–731. doi: 10.1083/jcb.200107057. [DOI] [PMC free article] [PubMed] [Google Scholar]
- Perry DK, Carton J, Shah AK, Meredith F, Uhlinger DJ, Hannun YA. J. Biol. Chem. 2000;275:9078–9084. doi: 10.1074/jbc.275.12.9078. [DOI] [PubMed] [Google Scholar]
- Raisova M, Bektas M, Wieder T, Daniel P, Eberle P, Orfanos CE, Geilen CC. FEBS Lett. 2000;473:27–32. doi: 10.1016/s0014-5793(00)01491-5. [DOI] [PubMed] [Google Scholar]
- Riebeling C, Allegood JC, Wang E, Merrill AH, Jr., Futerman AH. J. Biol. Chem. 2003;278:43452–43459. doi: 10.1074/jbc.M307104200. [DOI] [PubMed] [Google Scholar]
- Rodriguez-Lafrasse C, Alphonse G, Broquet P, Aloy M, Louisot P, Rousson R. Biochem. J. 2001;357:407–416. doi: 10.1042/0264-6021:3570407. [DOI] [PMC free article] [PubMed] [Google Scholar]
- Rostovtseva TK, Antonsson B, Suzuki M, Youle RJ, Colombini M, Bezrukov SM. J. Biol. Chem. 2004;279:13575–13583. doi: 10.1074/jbc.M310593200. [DOI] [PubMed] [Google Scholar]
- Saelens X, Festjens N, Walle LV, van Gurp M, van Loo G, Vandenabeele P. Oncogene. 2004;23:2861–2874. doi: 10.1038/sj.onc.1207523. [DOI] [PubMed] [Google Scholar]
- Saito M, Korsmeyer SJ, Schlesinger PH. Nat. Cell Biol. 2000;2:553–555. doi: 10.1038/35019596. [DOI] [PubMed] [Google Scholar]
- Schafer P, Scholz SR, Gimadutdinow O, Cymerman IA, Bujnicki JM, Ruiz-Carrillo A, Pingoud A, Meiss G. J. Mol. Biol. 2004;338:217–228. doi: 10.1016/j.jmb.2004.02.069. [DOI] [PubMed] [Google Scholar]
- Schultz SG, Solomon AK. J. Gen. Physiol. 1961;44:1189–1199. doi: 10.1085/jgp.44.6.1189. [DOI] [PMC free article] [PubMed] [Google Scholar]
- Siskind LJ, Colombini M. J. Biol. Chem. 2000;275:38640–38644. doi: 10.1074/jbc.C000587200. [DOI] [PMC free article] [PubMed] [Google Scholar]
- Siskind LJ, Davoody A, Lewin N, Marshall S, Colombini M. Biophys. J. 2003;85:1560–1575. doi: 10.1016/S0006-3495(03)74588-3. [DOI] [PMC free article] [PubMed] [Google Scholar]
- Siskind LJ, Kolesnick RN, Colombini M. J. Biol. Chem. 2002;277:26796–26803. doi: 10.1074/jbc.M200754200. [DOI] [PMC free article] [PubMed] [Google Scholar]
- Susin SA, Zamzami N, Kroemer G. Biochim. Biophys. Acta. 1998;1366:151–165. doi: 10.1016/s0005-2728(98)00110-8. [DOI] [PubMed] [Google Scholar]
- Sweeney EA, Inokuchi J, Igarashi Y. FEBS. 1998;425:61–65. doi: 10.1016/s0014-5793(98)00198-7. [DOI] [PubMed] [Google Scholar]
- Tejuca M, Dalla Serra M, Potrich C, Alvarez C, Menestrina G. J. Membr. Biol. 2001;183:125–135. doi: 10.1007/s00232-001-0060-y. [DOI] [PubMed] [Google Scholar]
- Terrones O, Antonsson B, Yamaguchi H, Wang H-G, Liu J, Lee RM, Herrmann A, Basañez G. J. Biol. Chem. 2004;279:30081–30091. doi: 10.1074/jbc.M313420200. [DOI] [PubMed] [Google Scholar]
- Thomas RL, Jr., Matsko CM, Lotze MT, Amoscato AA. J. Biol. Chem. 1999;274:30580–30588. doi: 10.1074/jbc.274.43.30580. [DOI] [PubMed] [Google Scholar]
- Vander Heiden MG, Li XX, Gottleib E, Hill RB, Thompson CB, Colombini M. J. Biol. Chem. 2001;276:19414–19419. doi: 10.1074/jbc.M101590200. [DOI] [PubMed] [Google Scholar]
- Venkataraman K, Riebeling C, Bodennec J, Riezman H, Allegood JC, Sullards MC, Merrill AH, Jr., Futerman AH. J. Biol. Chem. 2002;277:35642–35649. doi: 10.1074/jbc.M205211200. [DOI] [PubMed] [Google Scholar]
- Wiesner DA, Kilkus JP, Gottscalk AR, Quintáns J, Dawson G. J. Biol. Chem. 1997;272:9868–9876. doi: 10.1074/jbc.272.15.9868. [DOI] [PubMed] [Google Scholar]
- Witty JP, Bridgham JT, Johnson AL. Endocrinology. 1996;137:5269–5277. doi: 10.1210/endo.137.12.8940345. [DOI] [PubMed] [Google Scholar]
- Zhang J, Alter N, Reed JC, Borner C, Obeid LM, Hannun YA. Proc. Natl. Acad. Sci. U.S.A. 1996;93:5325–5328. doi: 10.1073/pnas.93.11.5325. [DOI] [PMC free article] [PubMed] [Google Scholar]


