

Abstract
To investigate the effect of odorant hydrocarbon structure on spatial representations in the olfactory bulb systematically, we exposed rats to odorant chemicals possessing one of four different oxygen-containing functional groups on one of five different hydrocarbon backbones. We also used several hydrocarbon odorants lacking other functional groups. Hydrocarbon structural categories included straight-chained, branched, double-bonded, alicyclic, and aromatic features. Activity throughout the entire glomerular layer was measured as uptake of [14C]2-deoxyglucose and was mapped into anatomically standardized data matrices for statistical comparisons across different animals. Patterns evoked by straight-chained aliphatic odorants confirmed an association of activity in particular glomerular response modules with particular functional groups. However, the amount of activity in these same modules also was affected significantly by differences in hydrocarbon structure. Thus, the molecular features recognized by receptors projecting to these response modules appear to involve both functional group and hydrocarbon structural elements. In addition, particular benzyl and cyclohexyl odorants evoked activity in dorsal modules previously associated with the ketone functional group, which represents an exception to the rule of one feature per response module that had emerged from our previous studies. These dorsal modules also responded to nitrogen-containing aromatic compounds involving pyridine and pyrazine rings. The unexpected overlap in modular responses to ketones and odorants seemingly unrelated to ketones may reflect some covert shared molecular feature, the existence of odorant sensory neurons with multiple specificities, or a mosaic of sensory neuron projections to these particular modules.
Indexing terms: deoxyglucose, odors, imaging techniques
Olfactory sensory neurons expressing the same odorant receptor gene typically send convergent projections to a pair of glomeruli in each olfactory bulb, one glomerulus of which is located in the lateral aspect and one in the medial aspect (Ressler et al., 1994; Vassar et al., 1994; Mombaerts et al., 1996). Pure odorants evoke spatial patterns of activity in the olfactory bulb that involve corresponding lateral and medial pairs of glomerular clusters, which presumably reflects the activation of subsets of odorant receptors recognizing particular molecular features of each odorant (Johnson et al., 1998; 1999; 2002; 2004a,b; Johnson and Leon, 2000a,b). The molecular features that are most important for activity in particular regions of the glomerular layer can be deduced from differences in activity across carefully chosen series of odorants differing systematically in chemical structure (Leon and Johnson, 2003).
When we used odorants sharing a straight-chained feature but differing in oxygen-containing functional groups, we found that each functional group was associated with activity in one or more pairs of anterior glomerular clusters, while all odorants overlapped in their stimulation of other, more posterior pairs of glomerular clusters (Johnson and Leon, 2000a). This finding suggested that the anterior glomeruli might be particularly sensitive to functional group, while the posterior glomeruli might be specific for the hydrocarbon structure of the odorants. Indeed, homologous series of straight-chained odorants differing in carbon number but possessing the same functional group stimulated the same anterior areas but displayed more differences in the posterior bulb (Johnson et al., 1999; 2004a). Carboxylic acid odorants differing more dramatically in hydrocarbon structure, including branched, double-bonded and cyclic structures, also overlapped in their activation of the acid-associated, anterior glomerular module, but yielded different posterior activation patterns (Johnson and Leon, 2000b). Although there is some evidence that responses associated with functional groups other than carboxylic acids overlap for odorants of greatly differing hydrocarbon structure (Johnson et al., 2002), there has been no systematic study of widely different structures involving these other functional groups. Nor has there been a study to determine if there are glomeruli associated with particular hydrocarbon structural features by varying both hydrocarbon structure and functional group systematically.
In the present study, we have exposed rats to 22 different odorants combining five different functional groups with five different hydrocarbon structural features to test whether all functional group-associated glomerular modules respond independently of hydrocarbon structure. We also have searched for areas of the bulb activated in common by odorants sharing particular hydrocarbon structures. In the course of this work, we found evidence that a unique region in the dorsal part of the bulb responded both to the ketone functional group and to aromatic structural features, which led us to study other aromatic odorants to explore the specificity of that module in greater detail.
MATERIALS AND METHODS
Odorants
The odorants, together with their unique Chemical Abstract Services registry number are listed in Table 1, which also indicates our commercial sources and the manufacturer’s stated purity. Chemicals from Acros were purchased through Fisher Scientific (Tustin, CA). Odorants from Fluka and Aldrich Flavors and Fragrances were purchased through Sigma-Aldrich (St. Louis, MO). All liquid odorants were used neat. Solid odorants were diluted in light mineral oil (Fisher brand) using a ratio of 1 g/10 mL for 2,3-dimethylpyrazine and 1 g/20 mL for cinnamyl alcohol, methyl cinnamate, thymol, and methyl nicotinate. Odorants were volatilized using high purity nitrogen. A nitrogen flow rate of 100 mL/min was used for all odorants diluted in mineral oil, and after passing through 200 mL of solution in a 500-mL gas-washing bottle, this vapor was diluted 1/10 in ultra zero air prior to reaching the exposure chamber at a final flow rate of 1 L/min. For all odorants used neat, 100 mL was used in a 125-mL gas-washing bottle. Most of these odorants were volatilized at a nitrogen flow rate of 250 mL/min and then were diluted 1/8 in ultra zero air before reaching the exposure chamber at 2 L/min. One exception was 2-methyl-2-pentene, which was so volatile that a flow rate of 50 mL/min of nitrogen and a dilution of 1/37 in air was used to avoid excessive evaporation. Two other exceptions were methyl isocaproate and methyl 3-methylbutenoate, which had a tendency to foam excessively at higher flow rates. For these odorants, we used nitrogen flow rates of 181 mL/min and 138 mL/min and dilutions of 1/11 and 1/14, respectively. Separate FEP tubing was dedicated to each odorant.
Table 1.
Odorants used in the study
| Odorant | CAS # | Source | Purity (%) | # of rats |
|---|---|---|---|---|
| 2-Octanone | 111-13-7 | Acros | 99 | 4 |
| Mesityl oxide | 141-79-7 | Acros | 99 | 4 |
| 5-Methyl-2-hexanone | 110-12-3 | Acros | 99 | 4 |
| Acetylcyclohexane | 823-76-7 | Alfa Aesar | 96 | 4 |
| Acetophenone | 98-86-2 | Acros | 99 | 4 |
| Methyl heptanoate | 106-73-0 | Acros | 99 | 4 |
| Methyl 3-methyl-2-butenoate | 924-50-5 | Fluka | 97 | 4 |
| Methyl isocaproate | 2412-80-8 | Aldrich F&F1 | 97 | 4 |
| Methyl cyclohexanecarboxylate | 4630-82-4 | Acros | 98 | 4 |
| Methyl benzoate | 93-58-3 | Acros | 99 | 4 |
| 1-Heptanol | 111-70-6 | Acros | 98 | 3 |
| 3-Methyl-2-buten-1-ol | 556-82-1 | Acros | 98 | 4 |
| 4-Methyl-1-pentanol | 626-89-1 | Acros | 99 | 4 |
| Cyclohexylmethanol | 100-49-2 | Acros | 99 | 4 |
| Benzyl alcohol | 100-51-6 | Acros | 99 | 4 |
| Heptanal | 111-71-7 | Acros | 95 | 4 |
| 3-Methyl-2-butenal | 107-86-8 | Aldrich F&F | 97 | 4 |
| Cyclohexanecarboxaldehyde | 2043-61-0 | Acros | 98 | 4 |
| Benzaldehyde | 100-52-7 | Acros | 98 | 4 |
| Octane | 111-65-9 | Acros | 99 | 4 |
| 2-Methyl-2-pentene | 625-27-4 | Acros | 99 | 4 |
| Ethylbenzene | 100-41-4 | Acros | 99.8 | 4 |
| Methyl anthranilate | 134-20-3 | Acros | 99 | 3 |
| Methyl salicylate | 119-36-8 | Acros | 99+ | 3 |
| Thymol | 89-83-8 | Acros | 99 | 3 |
| Methyl phenylacetate | 101-41-7 | Acros | 99 | 3 |
| Cinnamaldehyde | 14371-10-9 | Fluka | 98 | 3 |
| Methyl cinnamate | 103-26-4 | Acros | 98 | 3 |
| Cinnamyl alcohol | 104-54-1 | Acros | 98 | 3 |
| 2,3-Dimethylpyrazine | 5910-89-4 | Acros | 99 | 3 |
| 4-tert-butylpyridine | 3978-81-2 | Acros | 96 | 3 |
| Methyl nicotinate | 93-60-7 | Acros | 99 | 3 |
Aldrich Flavors and Fragrances
Exposures
All procedures involving rats were approved by the UC Irvine Institutional Animal Care and Use Committee. Rats (postnatal day 17–19) were transferred together with their dams into clean cages at least one hour before any experiment in order to reduce carryover of odors from soiled bedding into the odorant exposure chamber. Both male and female rats were used, with their numbers balanced across the different odorant conditions. Immediately prior to exposure, each rat was given a subcutaneous injection of [14C]2-deoxyglucose (16 μL/g, 0.1 mCi/mL, 52 mCi/mmol, Sigma Chemical Company, St. Louis) at the back of the neck, after which it was placed in a 2-L glass mason jar. Odorant or control vapor then began to enter the jar through the lid, which also was fitted with a vent. Odorant exposures continued for 45 min, after which the rat was decapitated, and its brain was removed rapidly and frozen at −45° C in 2-methylbutane.
Activity mapping
We sectioned olfactory bulbs and mapped uptake of 2-deoxyglucose (2-DG) as described previously (Johnson et al., 1999; 2004a). Briefly, the bulbs were sectioned in a coronal plane using a cryostat, and regularly spaced, 20-μm sections were taken for autoradiography. Images of alternate, cresyl violet-stained sections were used to locate anatomical landmarks and to direct measurements from the glomerular layer of the autoradiograph section. Measurements were taken at the intersection of the glomerular layer and each gridline of a polar grid chosen for each section on the basis of its relative rostral-caudal location in the bulb. Individual section files were merged into matrices that were standardized with respect to anatomical landmarks to correct for differences in bulb size. Left and right bulbs of each rat were mapped and their matrices averaged. A vehicle blank was subtracted, followed by converting each matrix into units of z scores with respect to the mean and standard deviation of values in that matrix. These z score-standardized matrices then were either averaged across a given odorant condition to generate plots of activity patterns or used for other statistical analyses.
The spatial distributions of activity represented by the averaged matrices were illustrated by means of contour charts plotted using Microsoft Excel. Our convention is to orient these charts such that the ventral surface runs horizontally at the center of each chart, the dorsal surface is represented along the top and bottom borders, and rostral is to the left. We choose ventral-centered charts to minimize the subjective impact of values that are missing along the dorsal surface due to occasional loss of tissue on the cryostat knife. Because this convention differs from that used by others, and because 2-dimensional plots of a curved 3-dimensional surface always entail distortions at the periphery, we also provide dorsal-centered 2-dimensional charts and 3-dimensional rotatable reconstructions of each of these patterns on our website (http://leonlab.bio.uci.edu).
Software used for imaging
The images in Figure 4 were acquired using a Sony XC-77 CCD camera and NIH IMAGE 1.62 software. The autoradiography image was pseudocolor-enhanced using the 32-color look up table from NIH IMAGE, while the image of the cresyl violet-stained section was saved using grayscale. Both images then were opened in Canvas 8 (Deneba Systems, Inc) on a Macintosh computer. The grayscale image was darkened, made partially transparent, and overlaid on the autoradiography image.
Fig. 4.

Responses in module “C” involve discontinuous glomeruli. Shown are pseudocolor-enhanced images of autoradiograms corresponding to the location of module “C” in one rat exposed to 2-octanone and in another rat exposed to methyl benzoate. Arrows indicate regions of low 2-DG uptake intervening between foci of elevated uptake. Also shown are overlays of adjacent cresyl violet-stained sections indicating the likely presence of glomeruli in the inactive areas. Scale bars = 1 mm.
RESULTS
Modular representations of functional groups
In a previous study, we used a straight-chained series with odorants containing different functional groups, specifically, 2-hexanone, methyl valerate, 1-pentanol, and pentanal, and we found that the differences in the odorant functional group were associated with modular differences in the pattern of 2-DG uptake (Johnson and Leon, 2000a). In the present study, we presented a similar series of odorants that possessed two additional carbons in the chain, and achieved very similar results involving the same glomerular response modules (Fig. 1, top row). We have superimposed on contour charts borders of clusters of glomeruli with what appear to be common responses proposed in a prior study (Johnson et al., 2002), which we call glomerular modules. The modular boundaries may not be identical to those that would be derived from the present study. However, characterization of the patterns using these modules allows effective comparisons to previously studied odorants that overlap systematically with the present odorants in both chemical structure and evoked activity patterns.
Fig. 1.

Spatial patterns of 2-DG uptake evoked by odorants containing specific combinations of functional groups and hydrocarbon structures. Odorants possessed one of five hydrocarbon backbones as indicated on the left. These backbones were substituted with additional structures indicated by “R” to represent the ketone, methyl ester, alcohol, and aldehyde functional groups. Several hydrocarbon odorants also were used wherein the hydrocarbon backbone was extended by an ethyl group. Each activity pattern is a contour chart illustrating the average of z score-transformed data matrices from four individual rats. Ranges of z score values were assigned different colors as shown in the key at the end of the fourth row. The charts represent rolled-out maps of the entire glomerular layer oriented as shown in the inset. The inset also shows the location of previously determined glomerular response modules (Johnson et al., 2004a). Lateral modules are labeled using lower cases letters, and paired medial modules of the same specificity are labeled using upper case letters. The outlines of these modules are superimposed on each contour chart. Modules judged to be of particular importance to the representation of either the functional group or the hydrocarbon structure are further labeled with letters on individual contour charts.
The ketone, 2-octanone, stimulated uptake in paired modules we have labeled “c” (dorsolateral) and “C” (dorsomedial), which were not well stimulated by the straight-chained odorants having other functional groups, but which were stimulated by numerous other ketones in previous studies (Johnson and Leon, 2000a; Johnson et al., 2002; 2004a,b). The ester methyl heptanoate evoked uptake in paired modules “a” (anterior, dorsolateral) and “A” (dorsomedial), which have been associated with methyl and ethyl esters in other studies (Johnson and Leon, 2000a; Johnson et al., 1998; 2002; 2004a,b). Methyl heptanoate also activated glomeruli in paired modules “f” and “F”, which have been associated previously with numerous ester odorants (Johnson and Leon, 2000a; Johnson et al., 2002; 2004a,b), and glomeruli in modules “b” (lateral) and “B” (medial), which contain glomeruli responding to other esters that are asymmetric around the ester bond (Johnson et al., 2004b). Previous studies indicated that glomeruli within modules “b” and “B” also respond to numerous primary alcohols and aldehydes (Johnson and Leon, 2000a; Johnson et al., 2002, 2004a,b). Consistent with this specificity, the primary alcohol 1-heptanol in the current study evoked 2-DG uptake in paired modules “b” and “B”, as did the aldehyde heptanal. Heptanal also stimulated glomeruli within paired modules “l” and “L” that respond to aldehydes of similar and greater length (Johnson et al., 2004a). Heptanal also evoked lesser uptake in module “A”, which may reflect contamination from the corresponding carboxylic acid arising through spontaneous oxidation of the aldehyde (Johnson et al., 2004a). Interestingly, the simple hydrocarbon octane evoked a pattern rather similar to that of the aldehyde except that it did not activate module “A” (Fig. 2).
Fig. 2.

Relative activation of glomerular modules. Z score values were averaged across each of the glomerular modules shown in Figure 1. Modules yielding positive values (representing uptake exceeding the average across the glomerular layer) were standardized further as a ratio of the maximal average value obtained for any module located in the same bulbar aspect (lateral or medial). These values are displayed as the diameter of circles. Solid circles and lower case letters are used for lateral modules, while open circles and upper case letters are used for medial modules. Odorants are grouped with respect to their hydrocarbon structural category as shown on the left.
If the ketone, methyl ester, alcohol, and aldehyde functional groups were sufficient to stimulate the corresponding modules, then odorants possessing these functional groups in the context of very different hydrocarbon structures should also stimulate those modules, as was previously observed for carboxylic acids with respect to modules “a” and “A” (Johnson and Leon, 2000b). To test this prediction, we used odorants possessing five very different hydrocarbon backbones as shown in Figure 1.
Our results with the ketone series supported the hypothesis of recognition of the ketone group independently of hydrocarbon structure. All five ketones were found to stimulate glomeruli contained within the borders of our previously defined modules “c” and “C” (Fig. 1, first column), which have been associated with the ketone functional group. The different ketone odorants differed in their stimulation of other regions of the glomerular layer, which could subserve differences in perceived odor across the series.
Although changing hydrocarbon structure did not affect the activation of the response modules that had been identified as specific for either carboxylic acids or for ketones, it clearly affected the association of the methyl ester, alcohol, and aldehyde functional groups with the particular glomerular modules that had been identified in the straight-chained odorant series. For example, the association between methyl esters and modules “a” and “A” was only weakly evident for methyl esters other than the straight-chained methyl heptanoate in the present study (Fig. 1, second column). The association between the methyl ester and modules “f” and “F” was maintained for the double bonded and branched methyl 3-methyl-2-butenoate, the branched methyl isocaproate, and the cyclic methyl cyclohexanecarboxylate. However, the aromatic ester methyl benzoate did not evoke as much 2-DG uptake in these modules.
Similarly, not all primary alcohols stimulated glomeruli in modules “b” and “B”, the modules with which they were associated in the straight-chained series. Although benzyl alcohol evoked small foci of uptake in these paired modules, 3-methyl-2-buten-1-ol, 4-methyl-1-pentanol, and cyclohexylmethanol did not convincingly stimulate them (Fig. 1, column 3). Nor was there a convincing relationship between the aldehyde functional group and modules “b” and “B” for any aldehyde other than the straight-chained heptanal (Fig. 1, column 4).
Modular representations of hydrocarbon features
If any consistently located glomeruli represent information about hydrocarbon structure as an odorant molecular feature, one might expect to see those glomeruli activated by different odorants sharing that structural feature even if they differ in functional groups. We therefore looked for overlapping areas of activity across the odorant series represented as rows in Figure 1. Indeed, associations between particular hydrocarbon structures and the activity in particular previously defined modules appeared to be present. Surprisingly, however, the modules showing these associations included modules we had previously associated with specific odorant functional groups.
The straight-chained odorants appeared more likely to activate glomeruli within modules “b” and “B” than did odorants with other hydrocarbon structural features (Fig. 1). When z score-standardized activity was averaged across each module and expressed as a fraction of the module most activated by that odorant in the same bulbar aspect (lateral or medial), the association of the straight-chained feature with 2-DG uptake in modules “b” and “B” became even more evident (Fig. 2). It should be noted that particular individual odorants within this straight-chained series apparently stimulated different subregions of modules “b” and “B”, while other sets of odorants stimulated more similar parts of the modules (Fig. 1). Therefore, the shared activation of a module is not equivalent to the shared activation of an odorant receptor or glomerulus.
Most odorants in the benzyl series (Fig. 1, bottom row) activated glomeruli within modules “c” and “C”, which previously had been associated with the ketone functional group (Fig. 2). Even ethylbenzene, which possesses no oxygen-containing functional group, effectively stimulated these modules. The exception in the aromatic series was benzyl alcohol. This odorant is less volatile than most of the other odorants in the series, and it stimulated much less total 2-DG uptake across the glomerular layer (data not shown: the z score standardization used for the charts in Figure 1 corrects for differences in overall uptake across the layer). Perhaps the lower concentration of this odorant made it ineffective as a stimulus for the receptors associated with these modules.
All of the cyclohexyl odorants stimulated uptake in foci within the paired posterior modules “h” and “H” (Fig. 1, second row from bottom; Fig. 2). Activation of these modules was not specific to the cyclohexane feature, however, as several 3-methyl-2-butenyl and straight-chained odorants also evoked uptake in modules “h” and “H”. Three of the four cyclohexyl odorants also evoked uptake in modules “c” and “C” (Fig. 1, Fig. 2). As was the case for the benzyl compounds, the less volatile alcohol, cyclohexylmethanol, was the exception and did not stimulate modules “c” and “C”. The cyclohexyl odorants activating modules “c” and “C” tended also to activate intervening modules (“f”, “F”, and “M”), thus producing an arc of uptake in the posterior bulb.
The two branched molecular features in our series did not appear to be associated selectively with activity in any particular module that was independent of functional group. However, within any given odorant series involving a single functional group, the posterior pattern of 2-DG uptake differed between the two branched odorants and between each branched odorant and odorants possessing the other three hydrocarbon structures (Fig. 1).
Individual odorants associated with uptake in particular modules
In addition to the associations between modular responses and either particular functional groups or particular hydrocarbon structures, there were at least two cases of individual odorants that strongly activated modules apparently not associated with either their functional group or their hydrocarbon structure. Thus, the ester methyl 3-methyl-2-butenoate stimulated paired modules “c” and “C” (Fig. 1), and benzyl alcohol evoked foci of 2-DG uptake within paired modules “a” and “A” (Fig. 1), which are more strongly associated with carboxylic acids and straight-chained methyl and ethyl esters.
Statistical analysis of modular activation
To verify that the above-reported associations between odorant features and modular activity was reflected in the individual rats exposed to the odorants, as opposed to being present only in the plots of the averaged data, we subjected the individual underlying data matrices to a statistical analysis similar to that used in prior studies (Linster et al., 2001; Johnson et al., 2004a,b). This analysis was restricted to ketone, methyl ester, and alcohol odorants of all five-hydrocarbon structures, which provided a complete block design for the statistical test. First, we determined the maximal z-score value within each module of each animal’s data matrix. For each of the 27 previously identified modules, we performed a two-factor ANOVA using functional group and hydrocarbon structure as the two factors. The resulting P values then were corrected for the large number of modules investigated using the false discovery rate method, which identifies all modules that would be significant at an experiment-wise criterion of P < 0.05 (Curran-Everett, 2000). In this correction, the first module to be considered significant must have an original P value less than [0.05 * (1/27)]; the second must be less than [0.05 * (2/27)]; the third less than [0.05 * (3/27)], and so forth.
Table 2 indicates which response modules were found to be significantly different for each factor, as well as which modules showed significant interactions between the factors. A remarkably large number of modules were significantly affected by each factor. For the functional group factor, 20 of the 27 modules were significantly different. For the hydrocarbon structure factor, 24 of the 27 modules differed significantly, including many of the same modules that differed across functional groups. Twelve modules yielded a significant interaction between functional group and hydrocarbon structure. The modules showing significant differences with respect to functional group were not more likely to be located in the rostral bulb, nor were the modules differing across hydrocarbon structure more likely to be located in the caudal bulb, despite early impressions from straight-chained and carboxylic acid odorant series (Johnson and Leon, 2000a,b).
Table 2.
Modules showing significant differences (P < 0.05) across functional groups and hydrocarbon structures1.
| Factor | Modules2 |
|---|---|
| Functional group | G,j,l,A,C,F,H,J,G,I,M,k,d,K,a,h,i,L,b,c |
| Hydrocarbon structure | b,e,h,i,l,B,D,E,F,H,J,L,j,M,n,C,A,a,G,K,f,c,k,I |
| Interaction | H,C,A,F,M,c,h,e,d,E,J,a |
Statistical significance was tested using a two-factor ANOVA followed by false discovery rate (FDR) correction (Curran-Everett, 2000).
Significantly different modules are listed in order of increasing P value.
As discussed in more detail in a previous paper (Johnson et al., 2004b), the results of the ANOVA do not necessarily validate the modules as processing units in olfaction. Similar statistical results may have been obtained using arbitrary subdivisions of the data matrices in place of the proposed glomerular modules.
Centroid analysis in modules “c” and “C”
It appeared from the averaged patterns shown in Figure 1 that different individual odorants stimulating modules “c” and “C” might be activating different parts of the modules. To explore this possibility further, we measured the centroids of 2-DG uptake within the modules in each individual animal exposed to odorants activating modules “c” and “C”, and we subjected these values to statistical analysis (Johnson et al., 1998; 1999; 2004a; Johnson and Leon, 2000b). Indeed, the locations of uptake differed significantly across odorants for both the lateral module “c” (one-factor ANOVA, P < 0.05, F(10,32)=2.25) and the medial module “C” (P < 0.01, F(10,32) = 3.03). This indicates that particular glomeruli within modules “c” and “C” differ in their responses to the different odorants. However, as shown in Figure 3, it did not appear that either the ketone functional group or any specific hydrocarbon structural feature was systematically associated with particular locations of uptake within the modules. Rather, particular ketones and non-ketone aromatic odorants had completely overlapping centroids, as did cyclohexyl and aromatic odorants.
Fig. 3.
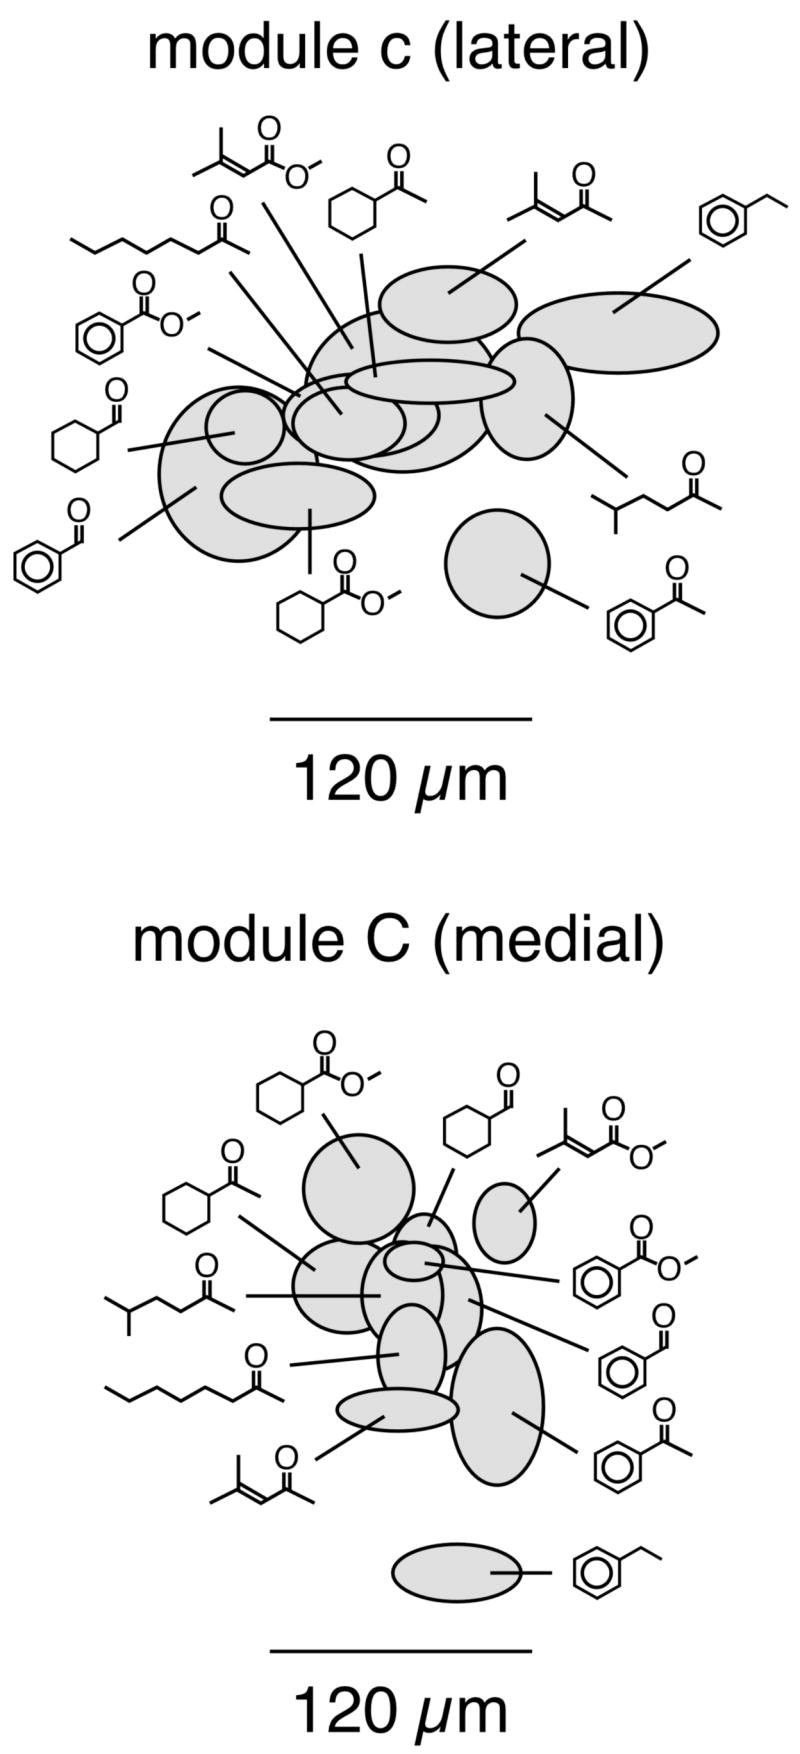
Relative locations of centroids of 2-DG uptake within modules “c” and “C”. For each of the rats exposed to the 11 odorants clearly activating glomeruli in modules “c” and “C”, we determined centroids of uptake within the modules. The centroids are displayed as ellipses. The centers of the ellipses indicate the mean values across the odorant condition, and the heights and widths indicate the standard errors in the dorsal-ventral and rostral-caudal dimensions, respectively. The centroids are shown in the same orientation as the charts in Figure 1. Rostral is to the left. For the lateral module, dorsal is up, whereas for the medial module, ventral is up.
Inspection of individual autoradiograph images corresponding to modules “c” and “C” also indicated the likelihood that different glomeruli within these modules displayed distinct specificity. As shown in Figure 4, strong foci of 2-DG uptake evoked by either the ketone 2-octanone or the benzyl odorant methyl benzoate appeared to be interrupted by regions of low labeling. This response pattern is consistent with the intermingled presence of activated and inactive glomeruli within the modules after exposure to a single odorant.
Specificity of modules “c” and “C” with respect to aromatic odorants
The activation of modules “c” and “C” by four of the five benzyl odorants in our original series (Figure 1, row 5) suggested the possibility of a broad responsiveness of these modules to odorants possessing this structural feature. To test this idea, we selected a number of additional benzyl compounds incorporating different functional groups and alkyl substitutions. As shown in Figure 5, methyl anthranilate and methyl salicylate were very effective in evoking 2-DG uptake within modules “c” and “C”, which indicates that the addition of either an amine or a hydroxyl group onto the structure of methyl benzoate was well tolerated by the receptors responsible for activity in these modules. The phenolic odorant thymol, which has isopropyl and methyl group substituents, was less effective in stimulating the modules, as were methyl phenylacetate and cinnamaldehyde. Methyl phenylacetate is similar structurally to the very effective odorant methyl benzoate (Fig. 1), except that it possesses one additional methylene group between the ester bond and the benzene ring. The further extension of this alkyl bridge in methyl cinnamate was associated with a loss of activation in modules “c” and “C” (Fig. 5). Cinnamyl alcohol also failed to stimulate the modules, despite its structural similarity to the moderately effective cinnamaldehyde (Fig. 5). Therefore, although additional benzyl odorants stimulate modules “c” and “C”, it is clear that these responses are specific to particular compounds. Interestingly, many of the benzyl compounds that poorly stimulated modules “c” and “C” appeared to activate the neighboring modules “b” and “B”.
Fig. 5.

Activity patterns evoked by additional aromatic odorants. Shown are color-coded contour charts of z score-standardized data matrices averaged across three rats exposed to each of the odorants. The boundaries of modules “c” and “C” are superimposed on each chart. The assignment of colors to the contour chart is according to the key shown in Figure 1. The degree of stimulation of modules “c” and “C” varied from strong to little or none across the different aromatic odorants. Benzyl and non-benzyl aromatic odorants overlapped in their major foci of activation.
Benzyl compounds represent only one type of aromatic chemical, wherein all members of the ring are comprised by carbon. To determine whether nitrogen-containing aromatic compounds also are capable of activating modules “c” and “C”, we tested 2,3-dimethylpyrazine, 4-tert-butylpyridine and methyl nicotinate. As shown in Figure 5, all three of these nitrogen-containing aromatic odorants stimulated the modules, although methyl nicotinate did so only weakly.
DISCUSSION
Modular representations of functional groups
For odorants with a straight-chained hydrocarbon structure, we have reproduced our past results showing an association between particular functional groups and particular glomerular modules (Johnson and Leon, 2000a; Johnson et al., 2002, 2004a). However, the investigation of other hydrocarbon structures in the present study has revealed that the overall coding strategy is more complex than this simple relationship implies. On the background of a different hydrocarbon structure, a given functional group does not necessarily evoke activity in the set of modules with which it was associated in the context of a straight-chained backbone. Also, the statistical analysis in the present study has shown significant effects of hydrocarbon structure on modules that previously were associated with functional groups in studies of straight-chained compounds.
In light of the present results, the simplest hypothesis may be that most glomerular modules contain glomeruli associated with odorant receptors that are specific for odorants possessing particular combinations of functional group and hydrocarbon structural features. Nevertheless, the carboxylic acid functional group continues to be associated with modules “a” and “A” in the context of numerous different hydrocarbon structures (Johnson and Leon, 2000b). Modules “c” and “C” also seem to be activated by ketones of very different hydrocarbon structures, although larger straight-chained ketones do not stimulate the modules, perhaps because their low volatility prevents them from reaching an effective concentration (Johnson et al., 2004a).
Modular representations of hydrocarbon structural features
There was some evidence in the present study for an association between certain hydrocarbon structures and 2-DG uptake in particular glomerular modules. For example, straight-chained odorants were more likely to stimulate modules “b” and “B”, most benzyl compounds stimulated modules “c” and “C”, and cyclohexyl odorants activated modules “c” and “C” as well as “h” and “H”. However, these same modules were significantly affected by odorant functional group, thereby reiterating the importance of an interaction between hydrocarbon structural features and functional groups in describing the specificity of glomerular modules.
Multiple specificity of modules “c” and “C”
Modules “c” and “C” appear to respond to multiple kinds of odorant chemicals. Ketones, a variety of aromatic odorants, several cyclohexyl odorants and methyl 3-methyl-2-butenoate were all found to stimulate 2-DG uptake in the dorsolateral module “c” and dorsomedial module “C”. In a recent study, we also reported activation of glomeruli in these modules by the secondary alcohols 2-heptanol, 3-heptanol, and 5-nonanol (Johnson et al., 2004b). Despite the breadth of odorant structures to which glomeruli in the modules respond, there also is clear evidence for specificity within the modules. Many chemically unrelated odorants do not stimulate 2-DG uptake in these modules (Johnson et al., 1998; 1999; 2000a,b; 2002a b; 2004a,b). Also, within systematic series of chemically related odorants such as the cinnamyl compounds and the aromatic methyl esters in the present study, as well as the alcohol positional series in our previous paper (Johnson et al., 2004b), the amount of 2-DG uptake within the modules clearly was dependent on specific aspects of chemical structure. Furthermore, as evidenced by the significant differences in centroids across different odorants in the present study, different glomeruli within the module appear to respond to the different odorants. Thus, rather than having a low specificity, glomeruli within these modules appear to display specificity for numerous kinds of odorant chemical structures.
How could glomeruli within one module be specific for multiple structures? We have diagrammed a number of possible explanations in Figure 6. The first possibility is that despite their overt differences in structure, the various odorants somehow resemble one another in steric and electronic properties so that certain sets of distinct odorants are effectively bound at the same binding sites of the same odorant receptors, thereby activating the same sensory neurons and glomeruli (Fig. 6A).
Fig. 6.

Four possible explanations for overlapping responses to chemically unrelated odorants. A. The same odorant receptor (OR) responds to the two classes of odorants despite their overt dissimilarity. B. A single olfactory sensory neuron (OSN) expresses two distinct odorant receptors, each of which is specific for one of the classes of odorants. C. Two distinct sets of olfactory sensory neurons, each expressing only one odorant receptor specific for one of the classes of odorants, converge in their projections into a single glomerulus (G). D. Glomeruli (e.g., G1a and G1b) that have related specificities with respect to one class of odorant intermingle in the olfactory bulb with glomeruli specific for members of the distinct class of odorant.
A second possibility is that there are multiple types of odorant receptors expressed within individual sensory neurons projecting to each glomerulus, with each receptor type responding to a different class of odorant (Fig. 6B). Although most sensory neurons are thought to express only one odorant receptor gene (Malnic et al., 1999), one study appears to have revealed expression of more than one odorant receptor gene in a single sensory neuron (Rawson et al., 2000) and another study showed a degree of heterogeneity in the odorant specificity of different sensory neurons expressing the same odorant receptor (Bozza et al., 2002).
A third possibility is that distinct sensory neurons expressing different odorant receptor genes converge together and project to the same glomeruli within the modules (Fig. 6C). Individual glomeruli that have been investigated extensively with respect to sensory neuron innervation appear to receive all of their input from sensory neurons expressing the same receptor gene (Potter et al., 2001; Treloar et al., 2002). However, of the approximately 1000 receptor genes and 2000 glomeruli estimated to be present in the rodent olfactory bulb, only a handful have been studied with respect to the specificity of their innervation, which certainly leaves open the possibility that particular glomeruli might be innervated differently. Using 2-photon imaging of calcium responses at the extreme dorsal aspect of the bulb, Wachowiak et al. (2004) found that specific glomeruli had similar responses to odorants as diverse as 2-hexanone, butyl acetate, benzaldehyde, hexyl acetate and octanal. They therefore concluded that there was little if any response specificity in mouse glomeruli. It is important, however, to note that they were unlikely to be recording from either module “c” or “C”, since these modules are mostly dorsomedial and dorsolateral, neither extending to the extreme dorsal surface of the bulb in rats (Johnson and Leon, 2000b). The odorants recorded in the calcium imaging study evoke peak responses in regions well outside of their recording site (Johnson, et al., 2002, 2004a, 2004b, this report). It is likely that the calcium signal reflects a background response to odorants that tails off from the peak response across a wide area of the bulb, including its dorsal aspect (Johnson et al., 2004a). One would expect overlapping response specificities in these widespread background responses, particularly when using highly sensitive recording techniques. Indeed, signals using the 2-photon calcium imaging technique might even include subthreshold variations in calcium levels, although this possibility apparently has not been investigated directly. If these sensitive imaging techniques were focused on the peak glomerular responses to odorants, we would expect them to reveal the same specificities that we observe using 2-DG uptake.
A fourth possibility is that modules “c” and “C” contain interdigitated glomeruli of distinct specificity (Fig. 6D). This possibility is consistent with the appearance of modules “c” and “C” in individual autoradiograph images, where regions of low labeling interrupt multiple strong foci of 2-DG uptake evoked by an individual odorant (Fig. 4). The variance between animals in the exact locations of the active and inactive glomeruli, together with the averaging procedures that we use on our data matrices, might obscure differences between odorant-evoked activity patterns at this fine level of detail. Techniques capable of measuring high-resolution responses to the different odorant classes in the same animal (e.g., electrophysiology or optical imaging) probably would be best suited to distinguishing the hypothesis in Figure 6D from the other three hypotheses (Fig. 6A–C). Thus far, optical imaging of other modules has shown that nearby glomeruli that respond to homologous series of straight-chained aldehydes (or their acid contaminants) can be interrupted by glomeruli not responding to any of the odorants in that series (Meister and Bonhoeffer, 2001; Wachowiak and Cohen, 2001), which is consistent with the mosaic hypothesis. An alternative explanation of these optical imaging data is that the inactive glomeruli may respond to related odorants possessing some hydrocarbon structure other than the straight chain.
Unique characteristics of the bulbar area involving modules “c” and “C”
The apparent responsiveness of modules “c” and “C” to multiple odorant features is an exception to the rule of one molecular feature per module that had emerged during our earlier studies. In a recent study, modules “c” and “C” also did not display a chemotopic organization with respect to ketone carbon chain length, unlike other functional group-dependent modules (Johnson et al., 2004a). Given the unusual properties of these modules, it seemed warranted to consider other unique characteristics of the area of the olfactory bulb in which they reside.
Modules “c” and “C” make up an appreciable fraction of the dorsal half of the olfactory bulb, which receives projections from sensory neurons located in the central channel of the olfactory epithelium (Schoenfeld and Knott, 2002, 2004). These neurons and their axons express sets of odorant receptors, growth factor receptors, carbohydrate structures, enzymes, and other, uncharacterized antigens that are distinct from those expressed by sensory neurons in extremities of the turbinates, which project to the ventral half of the bulb (Schwob and Gottlieb, 1988; Yoshihara et al., 1997; Schoenfeld and Knott, 2002, 2004; Ferrari et al., 2003). The sensory neuron-to-glomerulus convergence ratio is lower in the dorsal half of the bulb, which receives projections from one quarter of the sensory neurons, and dorsal glomeruli tend to be smaller than ventral glomeruli (Schoenfeld and Knott, 2004). Therefore, the unique response properties and the unique organization of responses within modules “c” and “C” appear to be associated with unique anatomical characteristics.
The central channel of the epithelium is the area first exposed to odorants during inspiration (Kimbell et al., 1997). It is thought that deep sniffing might be required to distribute odorants farther in to the turbinates, such that withholding deep sniffs might limit the access of odorants to the central channel (Kimbell et al., 1997). Therefore, one possibility for the specificity of modules “c” and “C” is that the multiple classes of odorants stimulating these modules might be inherently unpleasant to the rats, causing them to inhale only shallowly. The central channel of the epithelium also would be expected to concentrate odorants that absorb strongly to the mucosa (Hornung and Mozell, 1977; Kimbell et al., 1997). Such odorants are typically thought to be hydrophilic, possibly with lower volatility (Schoenfeld and Knott, 2004). However, certain odorants in the present study that stimulate modules “c” and “C” have predicted hydrophobicities similar to those of odorants that stimulate only more ventral modules. At least one effective odorant, ethylbenzene, is both quite hydrophobic and quite volatile, suggesting that the combination of these properties cannot alone explain activation of dorsal glomeruli. Nevertheless, the possibility remains that aromatic odorants absorb strongly to the mucosa by some process other than hydrophilicity, perhaps involving more specific interactions with macromolecular constituents of the mucosa.
Implications for perception
The large overlap of responses in the dorsolateral and dorsomedial parts of the olfactory bulb that are evoked by apparently dissimilar odorants such as ketones and aromatic compounds raises the question as to whether rats would perceive a similarity in the odors of these chemicals. Indeed, ketones and aromatic odorants not only share stimulation of these particular regions, but they also yield highly correlated patterns overall (not shown). We previously have demonstrated that high correlations between overall patterns of 2-DG uptake can predict which odorant enantiomers are perceived to be similar in a cross-habituation assay (Linster et al., 2001a). The relative similarity in patterns of 2-DG uptake along various homologous series involving straight-chained odorants of different carbon number also were correlated with behavioral measures of odorant similarity (Linster et al, 2001b; Cleland et al., 2002; Johnson et al., 2004a). These established relationships between odorant-evoked spatial patterns of activity and odor perception have involved odorants that are highly related to one another in chemical structure, which very likely increases the exact overlap in activated receptors, sensory neurons, glomeruli, and mitral cells, independently of their location in the bulb.
In the case of ketones and aromatic compounds, the hypotheses diagrammed in Figure 6A–C probably would result in similar odors because the two different odorant classes would likely lead to the activation of the same projection neurons because the same glomeruli are activated, whereas the hypothesis in Figure 6D would result in the activation of distinct mitral cells by the two types of odorants. However, if the spatial location of responses determines the perceived odor independently of whether the same mitral cells are activated (a true spatial code, as opposed to an identity code), then the perceived odors may be similar if the hypothesis in Figure 6D were to apply. Even if ketones and aromatic compounds were not to have similar perceived odors, the spatial proximity of the glomeruli that they activate might lead to unusually strong interactions between the two odorant classes. For example, lateral inhibition by way of local granule cells, periglomerular cells, or short-axon cells might mediate a strong mutual suppression of the two odorant classes were they to be presented in mixtures (Aungst et al., 2003; Linster and Cleland, 2004).
Is the concept of a glomerular module still useful?
As in our previous reports (Johnson et al., 1998; 1999; 2002; 2004a,b; Johnson and Leon, 2000a; Linster et al., 2001a), the analysis of responses in terms of glomerular modules continues to reveal more commonalities across odorants of similar structure than across dissimilar chemicals. This conclusion is true despite the clear exception of modules “c” and “C” in the present study, and despite the fact that the individual glomeruli activated by a given odorant within the module might differ from those activated by a chemically related odorant (e.g., the different regions of modules “b” and “B” activated by different straight-chained odorants in the present study). Many of the modules to which we refer here were defined originally to facilitate the understanding of how responses changed across a series of odorants differing in functional groups but sharing a common hydrocarbon structure (Johnson and Leon, 2000a). As shown in the present study, the changing responses across different functional groups on the background of a related, but different, hydrocarbon structure involved glomeruli within the same boundaries. Homologous series of straight-chained aliphatic odorants differing in carbon number showed chemotopic progressions of 2-DG uptake across the modules previously associated with the appropriate functional group, and the progressions obey the boundaries of the previously defined modules, except that certain modules have needed expansion into previously unmapped glomerular regions to encompass activity evoked by larger members of the series (Johnson et al., 1999; 2004a). Experiments using optical imaging of endogenous signals in mice have replicated the location and response specificities of the glomerular modules that we have described (Uchida et al., 2000; Takahashi et al., 2004), suggesting that the definition of these modules is not dependent on the use of the 2-DG method. It would appear that the spatial clustering of glomeruli of similar specificity is an organizational principle of the mammalian olfactory bulb, and the modular boundaries that we have derived represent our ongoing attempt to characterize how aspects of odorant chemical structure map onto this organization.
The fact that responses to carboxylic acids and ketones cluster in their respective modules regardless of their hydrocarbon structure, while responses to odorants with other functional groups change their modular locations with changes in their hydrocarbon structure, indicates that there appear to be two coding strategies in the olfactory system. The revelation of these two coding strategies underscores the need for a broad and systematic survey of odorant responses across the entire olfactory processing system to enable a real understanding of this sensory code.
Acknowledgments
We thank Joanne Yihan, Tanya Riedel, Linh Hoang, Paige Pancoast, Jennifer Kwok, and Zhe Xu for technical assistance involving odorant exposures, tissue sectioning, and mapping. We also thank Espartaco (Spart) Arguello for software development.
Supported by United States Public Health Service grant DC03545
LITERATURE CITED
- Aungst JL, Heyward PM, Puche AC, Karnup SV, Hayar A, Szabo G, Shipley MT. Centre-surround inhibition among olfactory bulb glomeruli. Nature. 2003;426:623–629. doi: 10.1038/nature02185. [DOI] [PubMed] [Google Scholar]
- Bozza T, Feinstein P, Zheng C, Mombaerts P. Odorant receptor expression defines functional units in the mouse olfactory system. J Neurosci. 2002;22:3033–3043. doi: 10.1523/JNEUROSCI.22-08-03033.2002. [DOI] [PMC free article] [PubMed] [Google Scholar]
- Cleland TA, Morse A, Yue EL, Linster C. Behavioral models of odor similarity. Behav Neurosci. 2002;116:222–231. doi: 10.1037//0735-7044.116.2.222. [DOI] [PubMed] [Google Scholar]
- Curran-Everett D. Multiple comparisons: philosophies and illustrations. Am J Physiol Reg Integr Comp Physiol. 2000;279:R1–R8. doi: 10.1152/ajpregu.2000.279.1.R1. [DOI] [PubMed] [Google Scholar]
- Ferrari CC, Johnson BA, Leon M, Pixley SK. Spatiotemporal distribution of the insulin-like growth factor receptor in the rat olfactory bulb. Neurochem Res. 2003;28:29–43. doi: 10.1023/a:1021639926941. [DOI] [PubMed] [Google Scholar]
- Hornung DE, Mozell MM. Factors influencing the differential sorption of odorant molecules across the olfactory mucosa. J Gen Physiol. 1977;69:343–361. doi: 10.1085/jgp.69.3.343. [DOI] [PMC free article] [PubMed] [Google Scholar]
- Johnson BA, Leon M. Modular glomerular representations of odorants in the rat olfactory bulb and the effects of stimulus concentration. J Comp Neurol. 2000a;422:496–509. doi: 10.1002/1096-9861(20000710)422:4<496::aid-cne2>3.0.co;2-4. [DOI] [PubMed] [Google Scholar]
- Johnson BA, Leon M. Odorant molecular length: one aspect of the olfactory code. J Comp Neurol. 2000b;426:330–338. doi: 10.1002/1096-9861(20001016)426:2<330::aid-cne12>3.0.co;2-5. [DOI] [PubMed] [Google Scholar]
- Johnson BA, Woo CC, Leon M. Spatial coding of odorant features in the glomerular layer of the rat olfactory bulb. J Comp Neurol. 1998;393:457–471. doi: 10.1002/(sici)1096-9861(19980420)393:4<457::aid-cne5>3.0.co;2-#. [DOI] [PubMed] [Google Scholar]
- Johnson BA, Woo CC, Hingco EE, Pham KL, Leon M. Multidimensional chemotopic responses to n-aliphatic acid odorants in the rat olfactory bulb. J Comp Neurol. 1999;409:529–548. [PubMed] [Google Scholar]
- Johnson BA, Ho SL, Xu Z, Yihan JS, Yip S, Hingco EE, Leon M. Functional mapping of the rat olfactory bulb using diverse odorants reveals modular responses to functional groups and hydrocarbon structural features. J Comp Neurol. 2002;449:180–194. doi: 10.1002/cne.10284. [DOI] [PubMed] [Google Scholar]
- Johnson BA, Farahbod H, Xu Z, Saber S, Leon M. Local and global chemotopic organization: general features of the glomerular representations of aliphatic odorants differing in carbon number. J Comp Neurol. 2004a doi: 10.1002/cne.20335. in press. [DOI] [PubMed] [Google Scholar]
- Johnson BA, Farahbod H, Saber S, Leon M. Effects of functional group position on spatial representations of aliphatic odorants in the rat olfactory bulb. J Comp Neurol. 2004b doi: 10.1002/cne.20415. in press. [DOI] [PMC free article] [PubMed] [Google Scholar]
- Kimbell JS, Godo MN, Gross EA, Joyner DR, Richardson RB, Morgan KT. Computer simulation of inspiratory airflow in all regions of the F344 rat nasal passages. Toxicol Appl Pharmacol. 1997;145:388–398. doi: 10.1006/taap.1997.8206. [DOI] [PubMed] [Google Scholar]
- Leon M, Johnson BA. Olfactory coding in the mammalian olfactory bulb. Brain Res Rev. 2003;42:23–32. doi: 10.1016/s0165-0173(03)00142-5. [DOI] [PubMed] [Google Scholar]
- Linster C, Cleland TA. Configurational and elemental odor mixture perception can arise from local inhibition. J Comput Neurosci. 2004;16:39–47. doi: 10.1023/b:jcns.0000004840.87570.2e. [DOI] [PubMed] [Google Scholar]
- Linster C, Johnson BA, Yue E, Morse A, Xu Z, Hingco E, Choi Y, Choi M, Messiha A, Leon M. Perceptual correlates of neural representations evoked by odorant enantiomers. J Neurosci. 2001a;21:9837–9843. doi: 10.1523/JNEUROSCI.21-24-09837.2001. [DOI] [PMC free article] [PubMed] [Google Scholar]
- Linster C, Garcia PA, Hasselmo ME, Baxter MG. Selective loss of cholinergic neurons projecting to the olfactory system increases perceptual generalization between similar, but not dissimilar, odorants. Behav Neurosci. 2001b;115:826–833. doi: 10.1037//0735-7044.115.4.826. [DOI] [PubMed] [Google Scholar]
- Linster C, Johnson BA, Morse A, Yue E, Leon M. Spontaneous versus reinforced olfactory discriminations. J Neurosci. 2002;22:6842–6845. doi: 10.1523/JNEUROSCI.22-16-06842.2002. [DOI] [PMC free article] [PubMed] [Google Scholar]
- Malnic B, Hirono J, Sato T, Buck LB. Combinatorial receptor codes for odors. Cell. 1999;96:713–723. doi: 10.1016/s0092-8674(00)80581-4. [DOI] [PubMed] [Google Scholar]
- Meister M, Bonhoeffer T. Tuning and topography in an odor map on the rat olfactory bulb. J Neurosci. 2001;21:1351–1360. doi: 10.1523/JNEUROSCI.21-04-01351.2001. [DOI] [PMC free article] [PubMed] [Google Scholar]
- Mombaerts P, Wang F, Dulac C, Chao SK, Nemes A, Mendelsohn M, Edmonson J, Axel R. Visualizing an olfactory sensory map. Cell. 1996;87:675–686. doi: 10.1016/s0092-8674(00)81387-2. [DOI] [PubMed] [Google Scholar]
- Potter SM, Zheng C, Koos DS, Feinstein P, Fraser SE, Mombaerts P. Structure and emergence of specific olfactory glomeruli in the mouse. J Neurosci. 2001;21:9713–9723. doi: 10.1523/JNEUROSCI.21-24-09713.2001. [DOI] [PMC free article] [PubMed] [Google Scholar]
- Rawson NE, Eberwine J, Dotson R, Jackson J, Ulrich P, Restrepo D. Expression of mRNAs encoding for two different olfactory receptors in a subset of olfactory receptor neurons. J Neurochem. 2000;75:185–195. doi: 10.1046/j.1471-4159.2000.0750185.x. [DOI] [PubMed] [Google Scholar]
- Ressler KJ, Sullivan SL, Buck LB. Information coding in the olfactory system: Evidence for a stereotyped and highly organized epitope map in the olfactory bulb. Cell. 1994;79:1245–1255. doi: 10.1016/0092-8674(94)90015-9. [DOI] [PubMed] [Google Scholar]
- Schoenfeld TA, Knott TK. NADPH diaphorase activity in olfactory receptor neurons and their axons conforms to a rhinotopically-distinct dorsal zone of the hamster nasal cavity and main olfactory bulb. J Chem Neuroanat. 2002;24:269–285. doi: 10.1016/s0891-0618(02)00070-4. [DOI] [PubMed] [Google Scholar]
- Schoenfeld TA, Knott TK. Evidence for the disproportionate mapping of olfactory airspace onto the main olfactory bulb of the hamster. J Comp Neurol. 2004;476:186–201. doi: 10.1002/cne.20218. [DOI] [PubMed] [Google Scholar]
- Schwob JE, Gottlieb DI. Purification and characterization of an antigen that is spatially segregated in the primary olfactory projection. J Neurosci. 1988;8:3470–3480. doi: 10.1523/JNEUROSCI.08-09-03470.1988. [DOI] [PMC free article] [PubMed] [Google Scholar]
- Treloar HB, Feinstein P, Mombaerts P, Greer CA. Specificity of glomerular targeting by olfactory sensory axons. J Neurosci. 2002;22:2469–2477. doi: 10.1523/JNEUROSCI.22-07-02469.2002. [DOI] [PMC free article] [PubMed] [Google Scholar]
- Uchida N, Takahashi YK, Tanifuji M, Mori K. Odor maps in the mammalian olfactory bulb: domain organization and odorant structural features. Nat Neurosci. 2000;3:1035–1043. doi: 10.1038/79857. [DOI] [PubMed] [Google Scholar]
- Vassar R, Chao SK, Sitcheran R, Nuñez JM, Vosshall LB, Axel R. Topographic organization of sensory projections to the olfactory bulb. Cell. 1994;79:981–991. doi: 10.1016/0092-8674(94)90029-9. [DOI] [PubMed] [Google Scholar]
- Wachowiak M, Cohen LB. Representation of odorants by receptor neuron input to the mouse olfactory bulb. Neuron. 2001;32:723–723. doi: 10.1016/s0896-6273(01)00506-2. [DOI] [PubMed] [Google Scholar]
- Wachowiak M, Denk W, Friedrich RW. Functional organization of sensory input to the olfactory bulb glomerulus analyzed by two-photon calcium imaging. Proc Natl Acad Sci USA. 2004;101:9097–9102. doi: 10.1073/pnas.0400438101. [DOI] [PMC free article] [PubMed] [Google Scholar]
- Yoshihara Y, Kawasaki M, Tamada A, Fujita H, Hayashi H, Kagamiyama H, Mori K. OCAM: a new member of the neural cell adhesion molecule family related to zone-to-zone projection of olfactory and vomeronasal axons. J Neurosci. 1997;17:5830–5842. doi: 10.1523/JNEUROSCI.17-15-05830.1997. [DOI] [PMC free article] [PubMed] [Google Scholar]