

Abstract
The cyclic nucleotide–gated (CNG) channel of retinal rod photoreceptor cells is an allosteric protein whose activation is coupled to a conformational change in the ligand-binding site. The bovine rod CNG channel can be activated by a number of different agonists, including cGMP, cIMP, and cAMP. These agonists span three orders of magnitude in their equilibrium constants for the allosteric transition. We recorded single-channel currents at saturating cyclic nucleotide concentrations from the bovine rod CNG channel expressed in Xenopus oocytes as homomultimers of α subunits. The median open probability was 0.93 for cGMP, 0.47 for cIMP, and 0.01 for cAMP. The channels opened to a single conductance level of 26–30 pS at +80 mV. Using signal processing methods based on hidden Markov models, we determined that two closed and one open states are required to explain the gating at saturating ligand concentrations. We determined the maximum likelihood rate constants for two gating schemes containing two closed (denoted C) and one open (denoted O) states. For the C ↔ C ↔ O scheme, all rate constants were dependent on cyclic nucleotide. For the C ↔ O ↔ C scheme, the rate constants for only one of the transitions were cyclic nucleotide dependent. The opening rate constant was fastest for cGMP, intermediate for cIMP, and slowest for cAMP, while the closing rate constant was fastest for cAMP, intermediate for cIMP, and slowest for cGMP. We propose that interactions between the purine ring of the cyclic nucleotide and the binding domain are partially formed at the time of the transition state for the allosteric transition and serve to reduce the transition state energy and stabilize the activated conformation of the channel. When 1 μM Ni2+ was applied in addition to cyclic nucleotide, the open time increased markedly, and the closed time decreased slightly. The interactions between H420 and Ni2+ occur primarily after the transition state for the allosteric transition.
Keywords: electrophysiology, ion channel gating, kinetics, cyclic GMP, open probability
introduction
Cyclic nucleotide–gated (CNG)1 channels are present at very high density in the plasma membranes of retinal rod photoreceptor cells, where they generate the electrical response to light (Yau and Baylor, 1989). They are activated by the direct binding of cGMP (Fesenko et al., 1985), which occurs at nearly the diffusion-limited rate (Karpen et al., 1988a). With four sites for cooperative binding, low affinity for cyclic nucleotide, and a lack of desensitization in the continued presence of cyclic nucleotide, CNG channels are ideally suited for their role as fast, exquisitely sensitive, molecular switches (Fesenko et al., 1985; Haynes et al., 1986; Zimmerman and Baylor, 1986; Karpen et al., 1988b).
Despite their weak voltage dependence (Karpen et al., 1988a), the primary amino acid sequence of CNG channels is similar to that of voltage-dependent channels (Kaupp et al., 1989; Jan and Jan, 1990). Like the other members of the voltage-dependent channel superfamily, CNG channel subunits are thought to contain six transmembrane domains, including an S4 region (Henn et al., 1995). CNG channels also contain a pore-lining P region linking the S5 and S6 transmembrane domains, which exhibits sequence similarity to the P region of voltage-gated channels (Heginbotham et al., 1992; Goulding et al., 1993). CNG channels are formed as a tetramer of four subunits around a centrally located pore (Gordon and Zagotta, 1995b; Liu et al., 1996; Varnum and Zagotta, 1996). The intracellular carboxyl terminal domain of CNG channels contains a highly conserved stretch of ∼120 amino acids that forms the binding site for cyclic nucleotides. This region has significant sequence similarity to the cyclic nucleotide–binding domains of other cyclic nucleotide– binding proteins, including cGMP- and cAMP-dependent protein kinases and Escherichia coli catabolite gene activator protein (Kaupp et al., 1989).
The activation of CNG channels is thought to involve an allosteric mechanism whereby ligand binding enhances channel opening (Stryer, 1987). In support of this mechanism, Karpen et al. (1988a) observed a voltage-dependent closed–open equilibrium of native channels at saturating concentrations of cGMP, indicating the presence of a closed–open equilibrium after the last cGMP molecule had bound. In addition, spontaneous open probabilities have been measured for CNG channels (Ruiz and Karpen, 1997; Tibbs et al., 1997). Thus it appears that ligand binding is not an obligatory step that must precede channel opening. Rather, the opening conformational change can occur in the absence of cyclic nucleotide and is simply made more favorable by the bound cyclic nucleotide.
The divalent cation Ni2+ has been shown to have a potentiating effect on channel activity when applied to the cytoplasmic side (Ildefonse and Bennett, 1991; Karpen et al., 1993; Gordon and Zagotta, 1995a). In particular, Ni2+ causes an increase in the maximal current, especially for weak agonists, and an increase in the apparent affinity for cyclic nucleotide. The mechanism of action of Ni2+ is thought to involve the coordination of Ni2+ when the channel is in the open conformation by the histidines at position H420 on adjacent subunits of the channel (Gordon and Zagotta, 1995a,b). This mechanism suggests that Ni2+ may be acting as an agonist in that, when bound, it shifts the equilibrium toward the activated conformation.
The goal of this investigation was to determine how the energetics of the allosteric transition are changed by allosteric modulators, including cyclic nucleotides and Ni2+. These experiments provide insights into the mechanism of action of allosteric ligands and the molecular mechanism of the allosteric transition. Our approach was to record steady state single-channel currents from bovine rod (BROD) CNG channels at saturating concentrations of cGMP, cIMP, and cAMP in the presence and absence of Ni2+. We analyzed the stochastic sequence of openings and closings of the channel using a signal processing method based on hidden Markov models to determine the number of states and their conductances and to obtain unbiased estimates of the rate constants. From the rate constants, we determined the energetic effects of the allosteric modulators on the allosteric transition. We argue that the interactions of these allosteric modulators with the channel stabilize the open conformation and are partially formed at the time of the transition state for the allosteric transition.
methods
Expression
Xenopus oocytes were injected with cRNA coding for the α subunit (subunit 1 or CNG1) of the bovine rod channel (Kaupp et al., 1989). Oocyte preparation and cRNA transcription and expression were carried out as previously described (Zagotta et al., 1989). Recordings were typically made 1–10 d after the injection. Initially, the oocytes were stored at 16°C, but once the level of expression was determined to be appropriate for obtaining single-channel recordings, the oocytes were moved to 4°C.
Electrophysiology
The patch-clamp technique (Hamill et al., 1981) was used to record single CNG channel currents from inside-out patches. The patch pipettes, fabricated from borosilicate glass, were coated with Sticky Wax (sds Kerr) and were polished to an initial pipette resistance of 5–20 MΩ. The experiments were carried out at room temperature (20–22°C).
The patch pipettes were filled with 130 mM NaCl, 3 mM HEPES, 0.2 mM EDTA, and 500 μM niflumic acid, pH 7.2. The intracellular solution contained 130 mM NaCl, 3 mM HEPES, pH 7.2, and the indicated concentration of cyclic nucleotide (cGMP, cIMP, or cAMP) with either 0.2 mM EDTA or 1 μM Ni2+ as indicated. Control solutions contained no cyclic nucleotide and either 0.2 mM EDTA or 1 μM Ni2+ as indicated. Intracellular solutions containing cyclic nucleotides were changed using a DAD-12 Superfusion System (ALA Scientific Instruments Inc.) controlled by an MRI MB-8000 PC and modified such that each solution had a separate exit port. The patch was then positioned at the mouth of an exit port when recording the currents in the presence of each solution. All reagents were obtained from Sigma Chemical Co.
The single-channel currents were recorded using an Axopatch 200B patch-clamp amplifier (Axon Instruments). The output of the patch-clamp amplifier was low-pass filtered at 5 kHz through an eight-pole Bessel filter (Frequency Devices Inc.) and digitized at 25 kHz using an ITC-16 computer interface (Instrutech Corp.). The data were acquired using a Quadra 800 Macintosh computer running HEKA Pulse software (Instrutech Corp.).
Half-Amplitude Threshold Criterion Analysis
For an initial analysis, the data were idealized using the half-amplitude threshold detection technique (Colquhoun and Sigworth, 1983) implemented using TAC single-channel analysis software (Bruxton Corp.). In this method, a transition is detected every time the half-amplitude current level was crossed. The amplitude histogram for the cIMP or cGMP trace of a particular experiment was used to set the full-amplitude current level. Minor adjustments to the baseline level were made by eye to correct for baseline drift. From the idealized current reconstruction, the closed and open durations were measured, and closed and open duration histograms were constructed. Dwell-time distributions were plotted with the Sigworth-Sine transformation, which plots the square root of the number of intervals per bin without correcting for the logarithmic increase in bin width with time (Sigworth and Sine, 1987). With this transform, the peaks in the duration histograms fall at the time constants of the major exponential components. The dwell-time histograms were fitted using TacFit software (Bruxton Corp.) to the sums of exponential probability density functions using the maximum likelihood method. The histograms were corrected for the distorting effect of the half-amplitude threshold technique on the durations of events between one and two dead times (Colquhoun and Sigworth, 1995).
Hidden Markov Model Analysis
The half-amplitude threshold method has been the standard for single-channel analysis. However, more rigorous methods for analysis, which use signal processing methods based on hidden Markov models (HMMs), have recently become available for single-channel analysis (Qin et al., 1996, 1997; Venkataramanan et al., 1998a,b; Venkataramanan, 1998). The method we used was developed by Lalitha Venkataramanan and Fred Sigworth (Venkataramanan, 1998; Venkataramanan et al., 1998a,b) and is implemented as part of TAC v. 4.0X software (Bruxton Corp.). Unlike previous HMM methods, the HMM approach we used models the observed current as the sum of two components: (a) a noiseless discrete signal that represents the current levels of conducting states generated as the ion channel makes transitions from one state to another and (b) Gaussian noise. The method distinguishes between actual events and noise in a more sophisticated fashion than is possible with the half-amplitude threshold method, which assumes that every time the half-threshold level has been crossed an event has occurred. The algorithm is an extension of the forward–backward equations and the Baum-Welch method (Baum et al., 1970). The output of the hidden Markov model is “hidden” because the current observed in an experiment does not directly specify the state of the channel because of additive noise and because multiple closed or open states may share the same conductance. The algorithm uses iterative methods to directly estimate the maximum likelihood set of rate constants for a given specified model.
The HMM approach uses inverse filtering to substitute a sharp cut-off filter with corner frequency fixed at 0.4× the sampling frequency for the gradual eight-pole Bessel filter that was used to record the data. Thus, for our experiments recorded with the Bessel filter set at 5 kHz and a sampling frequency of 25 kHz, the effect of inverse filtering was to effectively remove the 5 kHz filter and impose a sharp cutoff filter with a corner frequency of 10 kHz. Because of inverse filtering, the effective bandwidth doubles, making it possible to detect short duration events and obtain estimates for fast rate constants, which were previously missed (see Fig. 11). This improved frequency response is particularly helpful for measuring the short duration openings that were observed with cAMP and for measuring flicker closings. The inverse filtering is based on the step response of the system. We measured the step response of the system by configuring HEKA Pulse (Instrutech Corp.) to output voltage steps, converting the voltage steps into current steps using a voltage-to-current converter (Instrutech Corp.), and directly inputting the current steps into the head stage of the patch-clamp amplifier.
Figure 11.

Comparison of half-amplitude threshold technique to HMM. (A) Representative single-channel currents for the BROD channel in the presence of 16 mM cIMP filtered at 5 kHz and recorded at a sample frequency of 25 kHz. (B) Idealized record of the single-channel currents using a half-amplitude threshold analysis. For the half-amplitude threshold analysis, the data were interpolated at the Nyquist frequency of 12.5 kHz. (C) HMM current reconstruction of the most likely transition state sequence determined by HMM analysis. For the HMM analysis, the data were inverse filtered using the step response of the system. (D) Most likely transition state sequence determined by HMM analysis.
The HMM program was run on a Macintosh PPC 8100 computer (100 MHz) configured with 176 MB of RAM. The program was run in the continuous time mode with four auto-regressive coefficients and a 10−8 level of precision in the log likelihood. A typical data segment was 150,000 points or 6 s of data, which required about 150 iteration cycles or ∼30 min of computation time.
The accuracy of the HMM analysis was confirmed by simulating current records using a QS-1 electronic channel simulator (Instrutech Corp.). The output of the channel simulator was passed through a voltage-to-current converter and fed into the headstage of the patch-clamp amplifier. The simulated recordings were analyzed in a manner identical to the patch-clamp recordings. The simulations were calculated for a C0 ↔ O1 ↔ C2 model with rate constants set to approximately the values determined for the BROD channel when activated by cGMP, cIMP, or cAMP. For simulations with a duration of 10 s, the rate constants determined from the HMM analysis were generally within 10% of the values used in the simulation. The precision of the HMM analysis was determined by simulating 20 different 1-s long segments of data and analyzing each segment individually. The standard deviation of the rate constants due to stochastic variation was between 5 and 30% of the mean value.
Equivalent Sets of Rate Constants
To obtain the set of rate constants for the C0 ↔ O1 ↔ C2 scheme (see Fig. 14), the rate constants determined using HMM for the C0′ ↔ C1′ ↔ O2′ scheme (see Fig. 13) were converted to the equivalent set of rate constants for the C0 ↔ O1 ↔ C2 scheme. An exact conversion is possible because the two schemes share the same eigen values. Using primes to designate the rate constants for the C0′ ↔ C1′ ↔ O2′ scheme, the equations we used were:
 |
 |
 |
Figure 14.
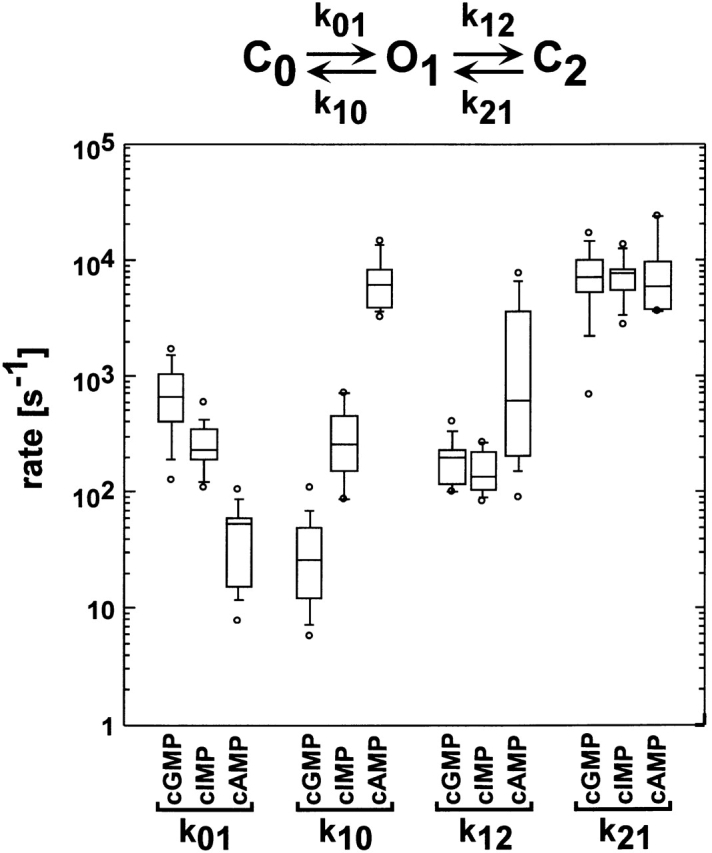
Box plots of rate constants for the C0 ↔ O1 ↔ C2 scheme. Box plots of the k 01, k 10, k 12, and k 21 rate constants for the C0 ↔ O1 ↔ C2 from 14 different patches. Values for the rate constants were determined by HMM analysis. The horizontal line within each box indicates the median of the data, boxes show the 25th and 75th percentiles of the data, and whiskers show the 5th and 95th percentiles. Extreme data points are also indicated.
Figure 13.
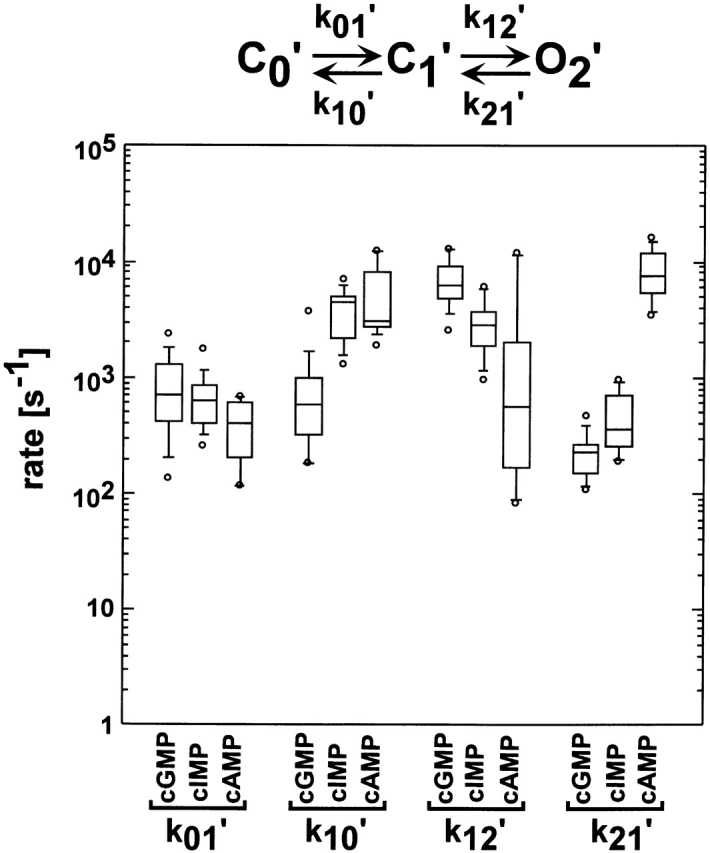
Box plots of rate constants for the C0′ ↔ C1′ ↔ O2′ scheme. Box plots of the k 01′, k 10′, k 12′, and k 21′ rate constants for the C0′ ↔ C1′ ↔ O2′ scheme from 14 different patches. Values for the rate constants were determined by HMM analysis. The horizontal line within each box indicates the median of the data, boxes show the 25th and 75th percentiles of the data, and whiskers show the 5th and 95th percentiles. Extreme data points are also indicated.
and
 |
The rate constants determined from fitting the COC scheme directly were <1% different from the equivalent rate constants converted from the CCO scheme, and the likelihood values for the two schemes were identical (within our precision level of 10−8).
results
Single-Channel Currents at Saturating Cyclic Nucleotide Concentrations
We injected Xenopus oocytes with cRNA encoding the α subunit of the BROD channel and recorded currents through the expressed channels using the inside-out configuration of the patch-clamp technique. By adjusting the amount of cRNA injected, the time after injection, and the diameter of the tip of the pipette, we obtained patches containing only a single CNG channel. A long continuous recording at +80 mV of a typical BROD single-channel patch is shown in Fig. 1. For the duration of the trace, the cytoplasmic face of the patch was bathed continuously with a saturating concentration of cGMP (16 mM), the physiological agonist of BROD CNG channels. This channel showed bimodal behavior, with alternating long-lived quiescent and bursting periods. During the quiescent mode, there were occasional short-lived openings. The quiescent periods were difficult to characterize because their durations varied from patch-to-patch and, within any given patch, only a few were observed. For the following analyses, we focused on the bursting periods by omitting all quiescent periods of duration longer than 200 ms. During the bursting periods, the channels were very highly activated in the presence of 16 mM cGMP, a saturating concentration for BROD channels (Kaupp et al., 1989; Gordon and Zagotta, 1995a). Since the binding of cGMP to the channel is thought to occur at 5 × 10⁷ M−1 s−1 (Karpen et al., 1988b), binding would be expected to occur with a time constant of ∼1 μs at 16 mM cGMP. Since the sample interval in our experiments was 40 μs, the kinetics at saturating cyclic nucleotide concentrations do not reflect the rate constants of binding or unbinding of the cyclic nucleotide. Rather, they reflect gating events occurring after the full complement of ligands have bound to the channel.
Figure 1.
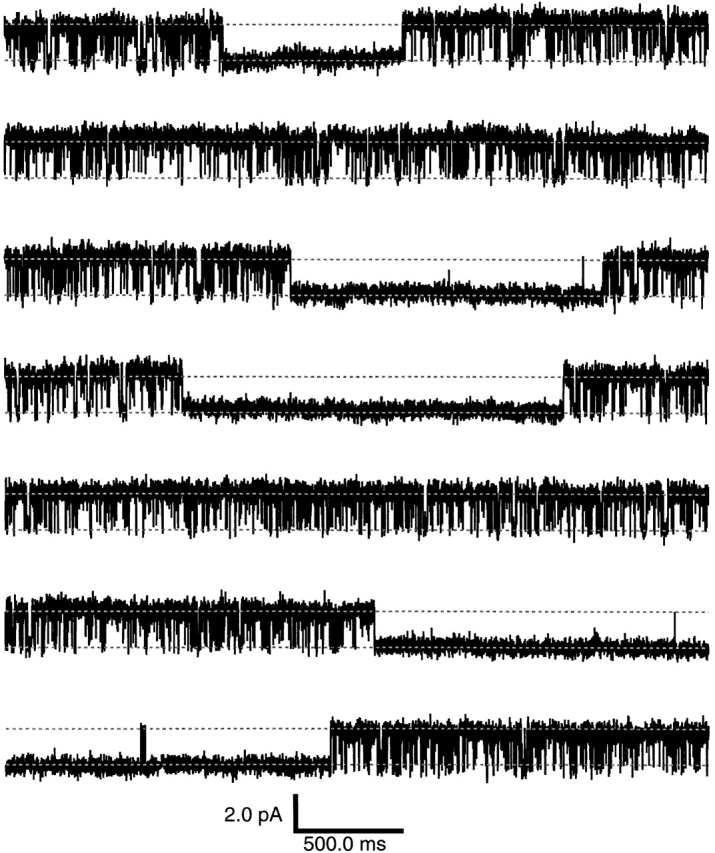
Bimodal single-channel activity. Shown are 23.33 s of a continuous current recording from a patch containing a single BROD CNG channel. The upper and lower dotted lines, separated by 2.1 pA, indicate the open and closed current levels, respectively. The currents were recorded at +80 mV in the inside-out configuration and in the continuous presence of 16 mM cGMP applied to the cytoplasmic face of the patch. The data were filtered at 5 kHz and sampled at 25 kHz.
BROD CNG channels can be activated not only by the physiological agonist cGMP but also by cIMP and cAMP. These agonists are similar in structure (Fig. 2) and bind to the same binding site with similar initial binding affinities but differing abilities to promote channel activation (Varnum et al., 1995). Since these cyclic nucleotides differ in only the most distal portion of their purine ring, interactions between the purine ring and the binding domain must be involved in the allosteric transition. In Fig. 3, current families elicited by voltage steps from 0 mV to between −80 and +80 mV are shown for activation by saturating concentrations of cGMP, cIMP, and cAMP in the absence (A) and presence (B) of 1 μM Ni2+. Since the effect of Ni2+ was not instantaneous, the currents in the presence of Ni2+ were recorded after Ni2+ had been applied for several minutes when the currents were stable. The leak currents in the absence of cyclic nucleotide were subtracted, and all currents were normalized to the current obtained at +80 mV in the presence of 16 mM cGMP + 1 μM Ni2+. In Fig. 3 A, we see that cGMP activated the most current (IcGMP/IcGMP+Ni = 0.96 ± 0.03, mean ± SEM, n = 6), cIMP was intermediate (IcIMP/ IcGMP+Ni = 0.60 ± 0.05, n = 6), and cAMP activated the least (IcAMP/IcGMP+Ni = 0.012 ± 0.005, n = 6). When 1 μM Ni2+ was added, the cGMP-induced currents were largely unaffected, suggesting that the currents were already nearly maximally activated before Ni2+ was applied. The cIMP-induced currents in the presence of Ni2+ became comparable in size to those of cGMP (IcIMP+Ni/IcGMP+Ni = 0.94 ± 0.04, n = 6), and the cAMP currents increased dramatically in size (IcAMP+Ni/ IcGMP+Ni = 0.42 ± 0.11, n = 6). We interpret these results to indicate that cyclic nucleotides and Ni2+ are noncompetitive allosteric modulators and that cIMP and cAMP are partial agonists.
Figure 2.

Structures of cyclic nucleotides.
Figure 3.

Macroscopic current– voltage families. Current families for an inside-out patch were elicited by 16 mM cGMP, 16 mM cIMP, or 16 mM cAMP in the presence (A) or absence (B) of 1 μM Ni2+. Voltage pulses were applied from 0 mV to potentials between −80 and +80 mV in 20-mV steps. Control currents in the absence of cyclic nucleotides were subtracted. The currents were normalized (using the +80-mV trace) to the maximum current in the presence of 16 mM cGMP and 1 μM Ni2+.
To investigate the kinetic basis for the differences in the amounts of current elicited by the three cyclic nucleotides in the presence and absence of Ni2+, we recorded the currents through single CNG channels. Examples of traces and amplitude histograms for a representative single-channel patch are shown in Figs. 4 and 5. The currents were recorded at +80 mV in the continuous presence of the indicated cyclic nucleotide in the absence (Fig. 4) and presence (Fig. 5) of 1 μM Ni2+. In the control traces, there was no evidence for openings in the absence or presence of 1 μM Ni2+, although open probabilities <2 × 10⁻³ would have been missed by the method. Based on the absence of distinguishable intermediate current levels in the traces and the absence of intermediate level peaks in the amplitude histograms, it appears that CNG channels gate primarily between only two conductance levels, open and closed, at saturating concentrations of cyclic nucleotide. From the amplitude histograms, it is apparent that there were differences in the open probabilities elicited by the three cyclic nucleotides and that Ni2+ increased the open probability for each ligand without affecting the single-channel conductance. Thus we conclude that cyclic nucleotides and Ni2+ behave as allosteric modulators and that the open states were indistinguishable based on open channel current level. To investigate this effect quantitatively, we recorded currents from a set of single-channel patches and calculated the open probability from fits of the amplitude histograms with the sums of two Gaussians. Across this set of experiments, the open probability averaged 0.93 ± 0.01 (mean ± SEM, n = 14) for cGMP, 0.49 ± 0.05 (n = 13) for cIMP, 0.008 ± 0.002 (n = 13) for cAMP. In the presence of 1 μM Ni2+, the open probability increased for all three agonists: the open probabilities were 0.94 ± 0.01 (n = 5) for cGMP + Ni2+, 0.95 ± 0.01 (n = 3) for cIMP + Ni2+, and 0.55 ± 0.10 (n = 3) for cAMP + Ni2+. These open probabilities were very similar to the fractional activations measured in the macroscopic current experiments (Fig. 3), indicating that the differences in fractional activations measured in macroscopic current experiments could be entirely accounted for by differences in open probability (see Fig. 16).
Figure 4.

Representative single-channel currents. Single-channel currents were recorded in the presence of 16 mM cGMP, cIMP, or cAMP with the membrane voltage clamped at +80 mV. Each sweep was 200 ms in duration. The upper and lower dotted lines indicate the open and closed levels, respectively, and are separated by 2.3 pA. The amplitude histograms were normalized to unit area and were fit by the sum of two Gaussians with variances σclosed 2 and σopen 2 for the closed and open distributions, respectively. Parameters for amplitude histograms were as follows: control solution: σclosed = 280 fA; 16 mM cGMP: σclosed = 300 fA, P closed = 0.05, μopen = 2.4 pA, σopen = 349 fA, P open = 0.95; 16 mM cIMP: σclosed = 289 fA, P closed = 0.71, μopen = 2.3 pA, σopen = 431 fA, P open = 0.29; 16 mM cAMP: σclosed = 287 fA, P closed = 0.997, μopen = 2.4 pA, σopen = 500 fA, P open = 0.003.
Figure 5.

Representative single-channel currents in the presence of Ni2+. Single-channel currents were recorded in the presence of 16 mM cGMP, cIMP, or cAMP, and 1 μM Ni2+. Data are for the same patch as in Fig. 4. Each sweep was 200 ms in duration. The upper and lower dotted lines indicate the open and closed levels, respectively, and are separated by 2.3 pA. The amplitude histograms were normalized to unit area and were fit by the sum of two Gaussians. Parameters for amplitude histograms were as follows: control solution + 1 μM Ni2+: σclosed = 353 fA; 16 mM cGMP + 1 μM Ni2+: σclosed = 2 pA, P closed = 0.01, μopen = 2.5 pA, σopen = 374 fA, P open = 0.99; 16 mM cIMP + 1 μM Ni2+: σclosed = 236 fA, P closed = 0.03, μopen = 2.5 pA, σopen = 311 fA, P open = 0.97; 16 mM cAMP + 1 μM Ni2+: σclosed = 360 fA, P closed = 0.28, μopen = 2.3 pA, σopen = 457 fA, P open = 0.72.
Figure 16.
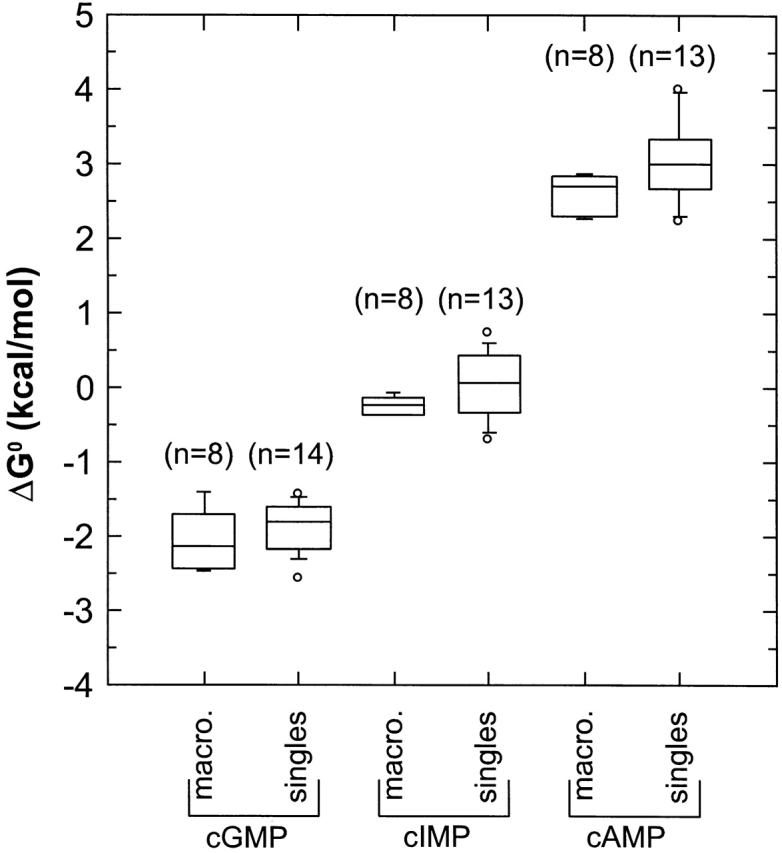
Box plot comparison between the values for ΔG 0 from macroscopic and single-channel experiments. For macroscopic experiments, the free energy change of the allosteric transition ΔG 0 was calculated as ΔG 0 = −RT ln L, where L is the equilibrium constant and was calculated using Ni2+ potentiation. For the single-channel experiments, ΔG 0 was calculated as ΔG 0 = −RT ln k 01/k 10, where k 01 and k 10 are maximum-likelihood rate constants from the HMM analysis for the C0 ↔ O1 ↔ C2 model.
The Effect of Inverse Filtering on Amplitude Histograms
Many of the cAMP-induced openings in the absence of Ni2+ were comparable in duration to the dead time (40 μs) and thus were missed altogether or appeared as transitions of less than the expected full amplitude level (See Fig. 4, 16 mM cAMP). In addition, the open channel peak in the amplitude histogram was not resolved, thus making it difficult to quantify the open probability or the single-channel conductance. Fig. 6 A illustrates that it was possible to resolve an open level peak for cAMP by plotting the amplitude histogram data for a single-channel patch activated by cAMP on log-linear axes. The fit is to the sum of two Gaussians, which appear as parabolas on log-linear axes. The open probability was 0.006, and the peak of the open histogram was centered at 1.5 or 0.7 pA less than the 2.2 pA level measured for cGMP and cIMP in the same experiment. To improve the frequency response, the data were inverse filtered (see methods), and the effect on representative cAMP openings and on the amplitude histogram is shown in Fig. 6 B. After inverse filtering, the data appeared noisier but with faster response time, and the apparent current for the openings was larger. The effect on the amplitude histogram was to increase the apparent single-channel current by ∼0.2–0.6 pA.
Figure 6.

Effects of inverse filtering on cAMP openings. Representative cAMP current traces at +80 mV are shown before (A) and after (B) inverse filtering along with amplitude histograms shown on log-linear axes. The dotted lines on the traces are separated by 2.2 pA. The amplitude histograms were fit by the sum of two Gaussians, which appear as parabolas on log-linear axes. The fit parameters before inverse filtering were: μopen = 1.5 pA, σclosed = 0.29 pA, σopen = 0.65 pA, P open = 0.006. The fit parameters after inverse filtering were μopen = 2.1 pA, σclosed = 0.49 pA, σopen = 0.61 pA, P open = 0.004.
The combination of inverse filtering and log-linear axes for amplitude histograms is useful for studying rare activity modes, such as spontaneous openings and subconductance states. In Fig. 7 is the set of amplitude histograms after inverse filtering for the experiment shown in Figs. 3 and 4. As can be seen in this figure, the single-channel amplitude was approximately the same in each of the conditions, and the amplitude histograms were well fit by the sum of two Gaussians. There was no evidence for substate activity at these saturating concentrations of cyclic nucleotides. In addition, there was no evidence for a resolved spontaneous opening peak in the absence or presence of Ni2+ without cyclic nucleotides. Thus, we conclude that the absence of an observed peak places an upper limit on the spontaneous open probability of 2 × 10⁻³ in the presence or absence of Ni2+. This result is in no way inconsistent with estimates for the spontaneous open probability of 1.25 × 10⁻⁴ (Tibbs et al., 1997) and 1.5 × 10⁻⁵ (Ruiz and Karpen, 1997), as the approximate resolution of our method for measuring small open or closed probabilities is 2 × 10⁻³.
Figure 7.
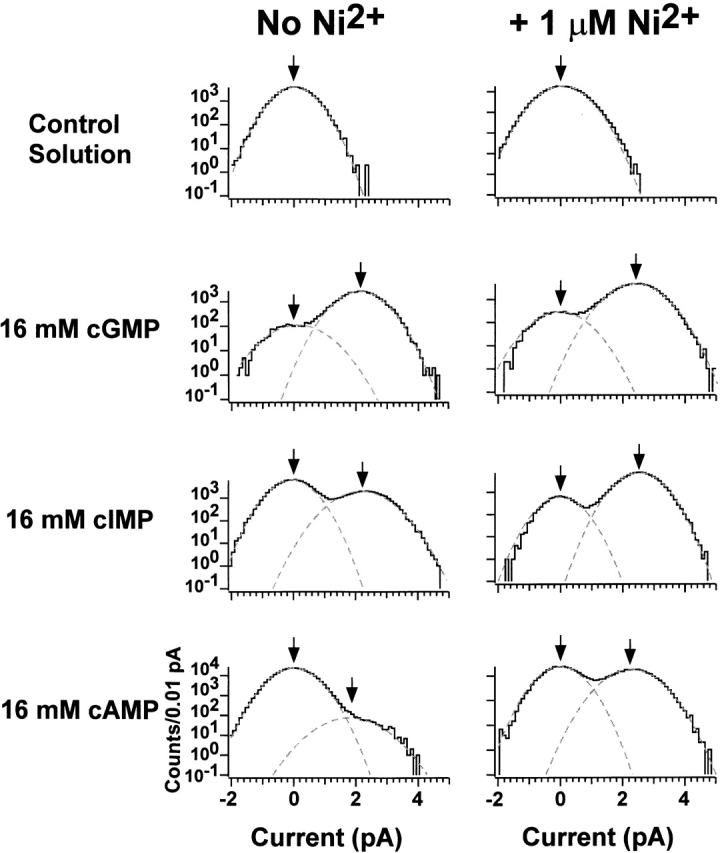
Amplitude histograms on log–linear axes with inverse filtering. The amplitude histograms were fit by the sum of two Gaussians, which appear as parabolas on a log scale. Parameters for the histograms in the absence of Ni2+ were as follows: control solution: σclosed = 480 fA; 16 mM cGMP: σclosed = 580 fA, P closed = 0.045, μopen = 2.2 pA, σopen = 590 fA, P open = 0.955; 16 mM cIMP: σclosed = 490 fA, P closed = 0.71, μopen = 2.2 pA, σopen = 640 fA, P open = 0.286; 16 mM cAMP: σclosed = 500 fA, P closed = 0.989, μopen = 2.0 pA, σopen = 960 fA, P open = 0.011. Parameters for the histograms in the presence of Ni2+ were as follows: control solution + 1 μM Ni2+: σclosed = 520 fA; 16 mM cGMP + 1 μM Ni2+: σclosed = 590 fA, P closed = 0.036, μopen = 2.4 pA, σopen = 600 fA, P open = 0.964; 16 mM cIMP + 1 μM Ni2+: σclosed = 470 fA, P closed = 0.071, μopen = 2.4 pA, σopen = 500 fA, P open = 0.929; 16 mM cAMP + 1 μM Ni2+: σclosed = 510 fA, P closed = 0.525, μopen = 2.2 pA, σopen = 620 fA, P open = 0.475.
To further characterize the single-channel current amplitude, we tabulated the single-channel amplitude across experiments. The results are plotted in Fig. 8. For each experiment, the single-channel current was measured by constructing an amplitude histogram over a short segment of data (to avoid error due to slow baseline drift) and fitting the sum of two Gaussians to the inverse-filtered data. Some variation in the single-channel amplitude across experiments was observed. There are several possible sources for this variation: (a) small voltage offsets, (b) small amounts of baseline drift, and (c) the limited frequency response of the system. For the case of cAMP in the absence of Ni2+, the major source of error was the limited frequency response of the system, which prevented many of the openings from reaching full amplitude, thereby broadening and distorting the open-channel distribution and shifting the open-channel peak toward a smaller amplitude. This error was alleviated for cAMP + Ni2+. For the case of cGMP + Ni2+, the limited frequency response of the system was again the major source of error, but in this case the effect was on the closed-channel peak, as many of the closed durations failed to reach the closed-amplitude level. Despite variation, it is clear that the large differences in the fractional activations measured in macroscopic current experiments are due to difference in open probability, not single-channel conductance.
Figure 8.
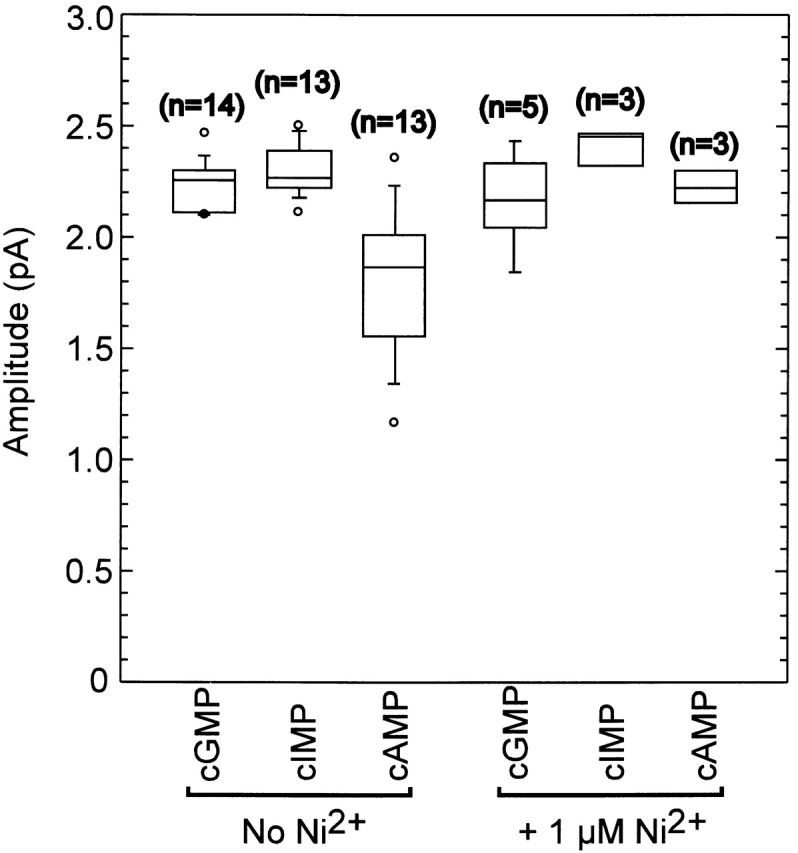
Single-channel amplitude variation across experiments. Box plots of the values for the single-channel amplitude as determined by fitting the sum of two Gaussians to inverse-filtered data. The horizontal line within each box indicates the median of the data; boxes show the 25th and 75th percentiles of the data; whiskers show the 5th and 95th percentiles. Extreme data points are also indicated. The median single-channel conductance was 2.25 pA for cGMP, 2.27 pA for cIMP, 1.87 pA for cAMP, 2.15 pA for cGMP with Ni2+, 2.46 pA for cIMP with Ni2+, and 2.21 pA for cAMP with Ni2+.
Half-Amplitude Threshold Analysis of Kinetics
To obtain a preliminary analysis of the single-channel kinetics, the half-amplitude threshold method was used to measure the open and closed times (see methods). The half-amplitude method requires a high signal-to-noise ratio to avoid noise crossings of the half-threshold level. Thus this analysis was done on noninverse filtered data. Shown in Figs. 9 (without Ni2+) and 10 (with Ni2+) are the duration histograms for the patch illustrated in Figs. 4 and 5. The histograms were corrected for the distorting effect of the half-amplitude technique on event durations between one and two dead times. In Fig. 9, the open duration histograms were generally well fit by single exponential distributions while the closed duration histograms were fit by the sum of two exponentials. The time constants of the short duration component of the closed duration histograms appeared to be independent of cyclic nucleotide. The longer duration component was shortest for cGMP, longer for cIMP, and much longer for cAMP. The open duration was longest for cGMP, intermediate in duration for cIMP, and very short for cAMP. On application of Ni2+ (Fig. 10), the open durations became longer, with the most dramatic effect on cAMP. We have also analyzed a number of records in the absence of cyclic nucleotide (control records) using the half-amplitude threshold-crossing method. In each case, only a handful of threshold-crossing events were obtained over 5–10 s of data, suggesting that unliganded openings are rare (data not shown). From the half-amplitude analysis of the data, it thus appears that the kinetics at saturating ligand concentrations can be described by two closed and one open states. It is also clear that many of the open events in the presence of cAMP without Ni2+ and many of the short duration closed events in the presence of all three ligands both with and without Ni2+ are missed because of the limited frequency response of the recording system.
Figure 9.

Half-amplitude threshold analysis indicates the presence of two closed and one open states. Closed (left) and open (right) duration histograms for single-channel data recorded with 16 mM cGMP, cIMP, or cAMP. Closed durations were fit to a double and open durations to a single exponential distribution. The time constants are indicated by the arrows. Parameters for the closed duration histograms were as follows: 16 mM cGMP: 1,118 events in histogram, τ(short) = 38 μs (weight, 0.85), τ(long) = 581 μs (weight, 0.15); 16 mM cIMP: 128 events in histogram, τ(short) = 24 μs (weight, 0.69), τ(long) = 4.21 ms (weight, 0.31); 16 mM cAMP: 58 events in histogram, τ(short) = 42 μs (weight, 0.34), τ(long) = 46.4 ms (weight, 0.66). Parameters for the open duration histograms were as follows: 16 mM cGMP: 1,118 events, τ = 3.42 ms; 16 mM cIMP:128 events, τ = 2.04 ms; 16 mM cAMP: 58 events, τ = 102 μs.
Figure 10.

Half-amplitude threshold analysis of currents in the presence of Ni2+. Closed (left) and open (right) duration histograms for single-channel data recorded with 16 mM cGMP, cIMP, or cAMP, and 1 μM Ni2+. Closed durations were fit to a double and open durations to a single exponential distribution. The time constants are indicated by the arrows. Parameters for the closed duration histograms were as follows: 16 mM cGMP: 357 events in histogram, τ(short) = 36 μs (weight, 0.85), τ(long) = 548 μs (weight, 0.15); 16 mM cIMP: 407 events in histogram, τ(short) = 36 μs (weight, 0.96), τ(long) = 3.25 ms (weight, 0.04); 16 mM cAMP: 443 events in histogram, τ(short) = 40 μs (weight, 0.84), τ(long) = 6.3 ms (weight, 0.16). Parameters for the open duration histograms were as follows: 16 mM cGMP: 357 events, τ = 3.57 ms; 16 mM cIMP: 407 events, τ = 3.56 ms; 16 mM cAMP: 443 events, τ = 1.46 ms.
Hidden Markov Model Kinetic Analysis
For a more rigorous analysis of the kinetics, we used a signal processing method based on hidden Markov model methods to estimate the most likely transition rate constants for a set of kinetic schemes (see methods). The HMM approach we used has a number of useful features for the analysis of single-channel data: (a) it extracts the rate constants from single-channel data, even with a poor signal-to-noise ratio; (b) it automatically corrects for baseline drift and periodic noise; (c) it does not require idealization of the single-channel data; (d) it naturally takes into account missed open and closed events due to the limited frequency response of the recording system; (e) it considers the sequence of events that occurs (information that is lost in binned duration histograms); (f) it provides a maximum likelihood value for discriminating among models; and (g) it extends, through the use of inverse filtering, the frequency response of the recorded system, enabling fast rate constants to be estimated more accurately (Venkataramanan, 1998; Venkataramanan et al., 1998a,b). Many of these features, in various combinations, are offered by other single-channel analysis methods. The main disadvantage of the HMM analysis is that it is restricted (at present) to relatively small amounts of data because of the extensive computer time required.
The HMM approach directly optimizes the rate constants for a specified scheme without idealizing the data. It considers all possible state sequences to account for the data, not just the most likely sequence. However, a current and level reconstruction that represents the most likely state sequence can be helpful for comparing the HMM method to the half-amplitude threshold method. Fig. 11 A shows a short segment of data recorded in the presence of 16 mM cIMP and an analysis using the two methods. With the half-amplitude threshold technique, an event is detected every time the half-amplitude level is crossed (Fig. 11 B). The HMM method provides a current reconstruction and a predicted state sequence. Shown are the predicted current (Fig. 11 C) and state sequence (D) for the C0 ↔ O1 ↔ C2 scheme. This comparison reveals that the HMM method predicts events that are missed by the half-amplitude method. The ability of the HMM method to extend the effective frequency response is a result of inverse filtering and the HMM algorithm.
The HMM approach provides two outputs: (a) the most likely set of rate constants for a particular gating scheme and (b) the maximum likelihood of the data given the scheme. By comparing the maximum likelihood values for each of a number of different schemes, the HMM approach can be used to determine the minimal scheme that captures the major features of the gating kinetics. To minimize the number of models that we needed to test, we used generic uncoupled models (Rothberg and Magleby, 1998). These schemes are considered uncoupled because every closed state is connected directly to every open state. Such uncoupled schemes were selected because, theoretically, they provide the maximum likelihood of the data given the model for any scheme with the same number of closed and open states (Rothberg and Magleby, 1998). A table of log likelihood ratios relative to the likelihood of the C ↔ O model for channels activated by cGMP, cIMP, and cAMP is shown in Fig. 12. As can been seen in this figure, the log likelihood ratio increased with increasing model complexity for each of the cyclic nucleotides. The addition of a second open state caused only a moderate increase in log likelihood. However, the addition of a second closed state caused a large increase in the log likelihood, suggesting that two closed and one open states are absolutely required to describe the gating kinetics. Similar results were seen for two other patches. Based on the Asymptotic Information Criterion (Akaike, 1974), the increase in likelihood observed with the models containing two closed and one open states is significant for all cyclic nucleotides for all patches analyzed. For models more complicated than two closed and one open states, there were small improvements in the maximum likelihood. These much smaller increases in likelihood were not consistently significant for all cyclic nucleotides or for all patches. In addition, the rate constants for these more complex models were poorly determined and inconsistent between patches. These small increases may signify that the underlying gating is more complicated than two closed and one open states, or may arise from slight differences in noise or nonstationary behavior between recordings. Thus, we focused our analysis on schemes containing two closed and one open states.
Figure 12.
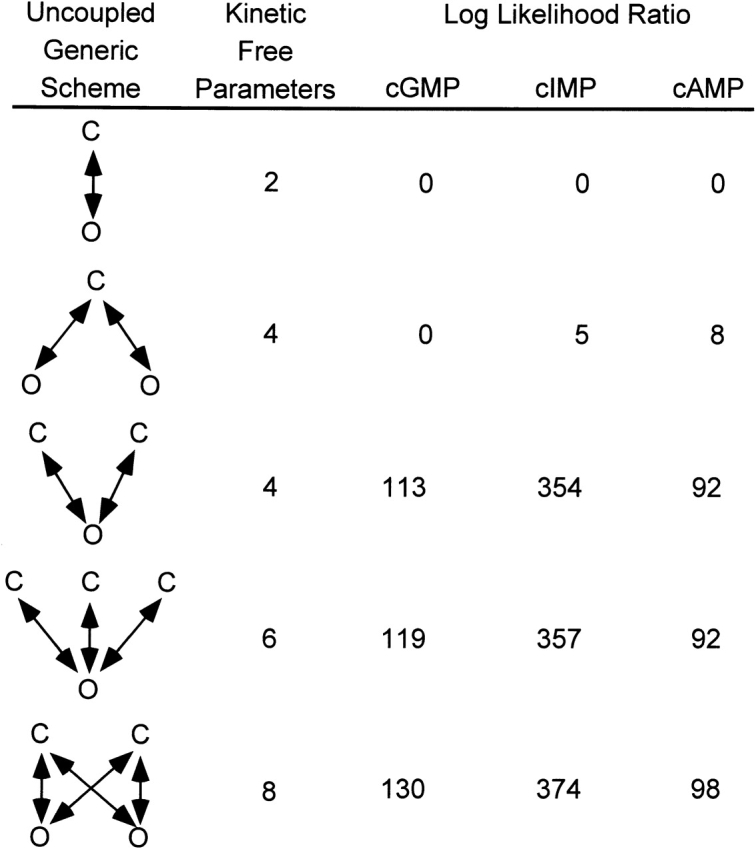
Model discrimination. Log likelihood ratios from an HMM analysis with five uncoupled generic schemes of single channel data recorded with 16 mM cGMP, cIMP, or cAMP. A convergence criterion of 10−8 was used. The log-likelihoods obtained from the analysis were normalized by subtracting the log-likelihoods obtained for the two-state C ↔ O scheme.
With two closed and one open states, there is the possibility of two linear schemes (C0′ ↔ C1′ ↔ O2′ and C0 ↔ O1 ↔ C2) and of a cyclic three-state scheme. Since the cyclic three-state scheme has an additional free parameter but is computationally no more likely, we focused on the two linear schemes. Despite the computational equivalence of the C0′ ↔ C1′ ↔ O2′ and C0 ↔ O1 ↔ C2 schemes, the physical interpretations of these two schemes are quite different. In particular, the C0′ ↔ C1′ ↔ O2′ scheme could, for example, describe the activation of a channel composed of two functional dimers, both of which would have to enter the activated conformation for the channel to open. Such a model has recently been proposed for the BROD channel (Liu et al., 1998). In contrast, in the C0 ↔ O1 ↔ C2 scheme, a single concerted conformational change could underlie the C0 ↔ O1 transition, while open-channel block or the closing of a secondary gate could underlie the O1 ↔ C2 transition.
We analyzed the kinetics for a number of different experiments in terms of the C0′ ↔ C1′ ↔ O2′ and C0 ↔ O1 ↔ C2 schemes. The experiments analyzed included eight single-channel experiments and six multichannel (two or three channels) with significant (>0.5 s) periods during which only one channel was activated at a time. As before, we performed a burst analysis by rejecting any quiescent periods of duration exceeding 200 ms from analysis. For the multichannel experiments, we viewed the records by eye and rejected any periods during which there were two or more simultaneous openings. For cAMP, this may have occasionally resulted in our analyzing short segments of data containing two channels. However, no systematic differences between the rate constants for cAMP for single-channel and multichannel patches were observed. The median duration of data selected for each cyclic nucleotide in an experiment was 6 s, ranging from 0.66 to 10 s.
A summary of the rate constants for the C0′ ↔ C1′ ↔ O2′ scheme is shown in Fig. 13. As can be seen in this figure, there was cyclic nucleotide dependence in the rate constants for the C0′ ↔ C1′ transition (k 01′ and k 10′) and for the C1′ ↔ O2′ transition (k 12′ and k 21′). For both transitions, the forward rate constants (k 01′ and k 12′) were fastest for cGMP, intermediate for cIMP, and slowest for cAMP. Conversely, the reverse rate constants (k 10′ and k 21′) were fastest for cAMP, intermediate for cIMP, and slowest for cGMP. Based on a Student's t test, all four rate constants were significantly different between cGMP and cAMP (P < 0.05). Our observation that the rate constants for both transitions were cyclic nucleotide dependent indicates that both conformational changes involve interactions of the channel with the cyclic nucleotide. Mechanistically, the C0′ ↔ C1′ ↔ O2′ scheme could describe two coupled conformational changes occurring during channel activation. Recently, it has been proposed that BROD channels exist as functional dimers and that the activation process could involve independent conformational changes in each of the two dimer pairs (Liu et al., 1998). If these conformational changes are independent, then the k 01′ rate constant would be expected to be 2 × k 12′. Similarly, the k 21′ rate constant would be expected to be 2 × k 10′. Comparing the median values for these rate constants for each of the cyclic nucleotides, we found that k 01′ was 2–10-fold slower than k 12′. The k 21′ rate constant ranged from 2-fold faster to 17-fold slower than k 10′. Thus, our results are not quantitatively consistent with a mechanism involving two independent conformational changes during activation. Rather, a mechanism involving cooperative interactions between the dimers would be predicted.
Shown in Fig. 14 are the rate constants for the C0 ↔ O1 ↔ C2 scheme. These rate constants were calculated by converting the rate constants we obtained for the C0′ ↔ C1′ ↔ O2′ scheme to the equivalent set of rate constants for the C0 ↔ O1 ↔ C2 scheme (see methods). For the C0 ↔ O1 ↔ C2 scheme, we observed cyclic nucleotide dependence in both rate constants for the C0 ↔ O1 transition (k 01 and k 10). Based on a Student's t test, both rate constants associated with the first transition were significantly different for all three cyclic nucleotides (P < 0.05). Thus, interactions between the places where the three cyclic nucleotides differ (the purine rings) and the channel are formed during the first transition. Since there was cyclic nucleotide dependence in both rate constants, these interactions were partially formed at the time of the transition state for the transition. In contrast, aside from the large range in values for the k 12 rate constant for cAMP, the O1 ↔ C2 transition was cyclic nucleotide independent. The large range in values for k 12 for cAMP reflects the fact that this rate constant was not well determined since, when activated by cAMP, the channels spent only a small fraction of the time open and thus made very few transitions to the C2 state. The lack of cyclic nucleotide dependence in the second transition suggests that interactions between the cyclic nucleotide and the channel are not involved in this transition. Rather it appears that activation involves interactions between the cyclic nucleotide and the channels but that, once activated, the channels are capable of undergoing a second closed–open transition outside of the activation process. This second transition could involve the closing of a secondary gate or the block of the channel pore, but at the present time we have no direct evidence in support of either mechanism.
To investigate the errors in the determination of the rate constants by the HMM approach, we mapped the curvatures of the likelihood surfaces for each of the rate constants and the amplitude. The results are shown in Fig. 15 for the C0′ ↔ C1′ ↔ O2′ (A) and C0 ↔ O1 ↔ C2 (B) schemes. These maps show how sensitive the log likelihood is to the exact value of each parameter. This analysis was performed on a short segment of data (0.73 s or 18,198 sample points) from an experiment in which a single channel was observed in the patch and for which currents were elicited by cGMP. The maximum likelihood estimate was determined with all parameters allowed to vary. The curvature of the likelihood surface for each parameter was determined by calculating the variation in the log likelihood with small deviations in the value of the parameter away from its maximum likelihood value. Specifically, while holding a parameter constant at values a few percent above or below the optimal value, the log likelihood was maximized again, allowing all the parameters except the parameter under investigation to vary freely. The resulting log likelihood values were plotted as the difference in log likelihood from the maximum likelihood versus the percent change from optimal value, as shown. The curves were fit by the equation:
 |
1 |
Figure 15.
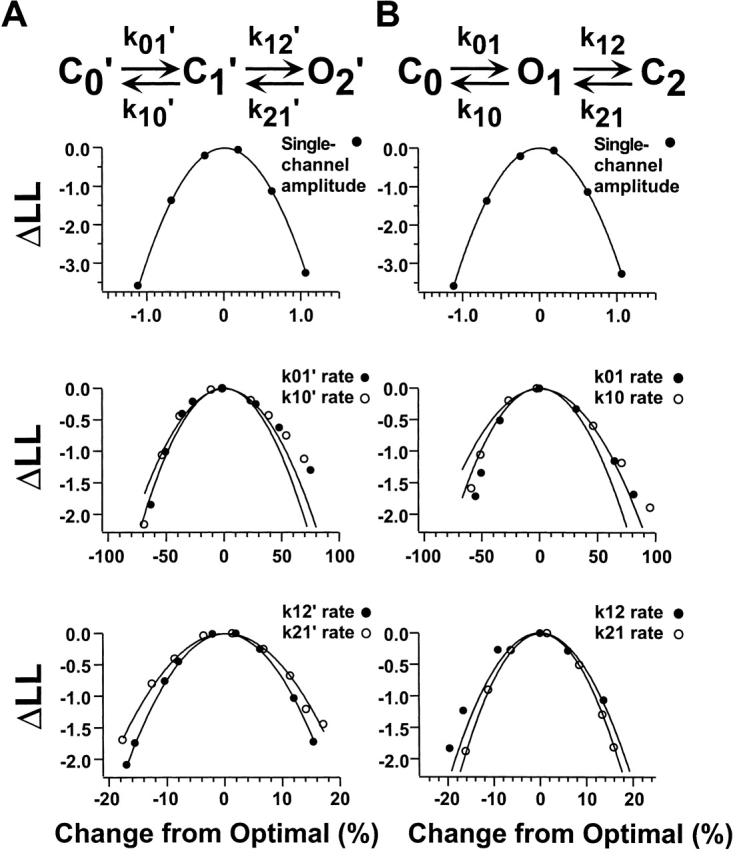
Errors in the determination of the rate constants and single-channel amplitude from HMM analysis. For this analysis, a 0.73-s segment (or 18,198 sample points) from a single-channel patch activated by cGMP was tested to determine the errors in the determination of the rate constants due to the method (see methods). The approach was applied separately for the (A) C0′ ↔ C1′ ↔ O2′ and (B) C ↔ O ↔ C schemes. The abscissa is the percent change in the value of the parameter away from the maximum-likelihood rate. The ordinate is the change in log likelihood from the maximum-likelihood value. The curves were fit by Eq. 1.
where ΔLL is the difference in the log likelihood from its maximum likelihood value, x is the percent change in the parameter under investigation, and s is the 1-SD confidence limit on the estimated rate constant (Colquhoun and Sigworth, 1995) in units of percent. The values for s were 0.4% for the single-channel amplitude, 35% for k 01′, 37% for k 10′, 8.3% for k 12′, 9.7% for k 21′, 36% for k 01, 42% for k 10, 9.2% for k 12, and 8.3% for k 21. For this analysis, we see that the errors in the two rate constants for a particular transition were similar. In addition, because there were more transitions to the C2 state than to the C0 state for the case of cGMP activation, the errors in the measurements of the rate constants for the O1 ↔ C2 transition were smaller than for the C0 ↔ O1 transition. In general, we expect that the errors estimated here are likely to be larger than typical, as errors decrease with duration of record, and the segment of data selected for this analysis was shorter than for most experiments. Even so, in all cases for cGMP, the rate constants for the O1 ↔ C2 transition would be expected to be better determined than for the C0 ↔ O1. For cIMP, the rate constants for both equilibria would be expected to be well determined. For cAMP, the rate constants for the first transition of C0 ↔ O1 ↔ C2 would be expected to be better determined than for the second transition because the majority of events would be between C0 and O1. For cAMP, we had the additional problem of not being certain as to the number of activated channels in the patch. We believe that any error in the determination of the number of channels present in a cAMP trace could be responsible for at most a threefold (reflecting the maximum number of channels in a patch that was analyzed) effect on the k 01 rate and would have a negligible effect on the k 10 rate.
To compare the variation across experiments with our confidence limits on the measurement, we compared the standard deviations in the rate constants for the 14 experiments with the confidence intervals determined above. The results for cGMP are shown in Table I. For every rate constant, there is considerably more variation across experiments than our confidence limits on the measurement can explain. In addition, we have analyzed the amount of stochastic variation expected by analyzing 20 different 1-s long segments of simulated data (see methods). The standard deviation of the rate constants due to stochastic variation was between 5 and 30% of the mean value, once again suggesting that there is considerably more variability across experiments than can be explained by stochastic variation. This result indicates that there is heterogeneity in the channels. There are several possible sources of this heterogeneity: (a) tyrosine dephosphorylation (Molokanova et al., 1997); (b) serine/threonine phosphorylation (Gordon et al., 1992); (c) possible differences across oocytes, such as the level of glycosylation, lipid composition, or changes in the levels of accessory proteins that interact with the channel; and (d) small temperature differences.
Table I.
Summary of Confidence Limits on Rate Constants
| Scheme | Parameter | Mean | Standard deviation | Confidence interval on HMM rate | Units | |||||
|---|---|---|---|---|---|---|---|---|---|---|
| Amplitude | A | 2.25 | 0.11 | 0.01 | pA | |||||
| CCO | k 01′ | 897 | 657 | 314 | s−1 | |||||
| CCO | k 10′ | 919 | 1032 | 340 | s−1 | |||||
| CCO | k 12′ | 7026 | 3205 | 583 | s−1 | |||||
| CCO | k 21′ | 236 | 109 | 89 | s−1 | |||||
| COC | k 01 | 750 | 486 | 270 | s−1 | |||||
| COC | k 10 | 34 | 31 | 14 | s−1 | |||||
| COC | k 12 | 202 | 93 | 18 | s−1 | |||||
| COC | k 21 | 8092 | 3984 | 671 | s−1 |
Summary of confidence limits on rate constants estimated by the standard deviations and HMM analysis for single-channel currents activated by cGMP. The mean value and standard deviation were determined from the HMM analysis of 14 experiments. The confidence intervals on HMM rates were determined by fitting the likelihood surfaces to parabolas, as described in the text, and multiplying the value s by the mean value for the parameter. Amplitude refers to the single-channel amplitude as determined by HMM analysis.
The Effect of Ni2+ on the Kinetics
The transition metal divalent Ni2+ has been shown to potentiate rod CNG channel currents when applied in the presence of cyclic nucleotides (Ildefonse et al., 1992; Karpen et al., 1993; Gordon and Zagotta, 1995a). Ni2+ potentiation has been used previously to estimate the equilibrium constant L for the allosteric transition from macroscopic current experiments (Gordon and Zagotta, 1995a). To test the validity of this method, we compared the values for ΔG 0 = −RT ln (k 01/k 10) determined for the allosteric transition of the C0 ↔ O1 ↔ C2 scheme from the set of single-channel experiments to the values for ΔG 0 = −RT ln L measured from a set of macroscopic current experiments, where L = I/(I max − I), I is the current measured in a macroscopic current experiment, and I max was estimated using Ni2+ potentiation, R is the universal gas constant, and T is the absolute temperative. While we could not discriminate between the C0 ↔ O1 ↔ C2 and C0′ ↔ C1′ ↔ O2′ schemes based on likelihood, we prefer the C0 ↔ O1 ↔ C2 scheme because there was cyclic nucleotide dependence in only the first transition of the C0 ↔ O1 ↔ C2 scheme. Also, the C0 ↔ O1 ↔ C2 scheme has the simple physical interpretation of the first transition being the allosteric transition and the second transition being to a flicker closed state out of the activation pathway. Fig. 16 shows that there were excellent correspondences between the values for ΔG 0 for the two methods, partially validating our assumption of a C0 ↔ O1 ↔ C2 scheme and indicating that the single-channel behavior is representative of what is observed in macroscopic current experiments.
To determine the effects of Ni2+ on the gating at saturating concentrations of cyclic nucleotide, we analyzed the gating in the presence of 1 μM Ni2+ in terms of the C0 ↔ O1 ↔ C2 scheme and compared the rate constants we obtained to the rate constants we obtained in the absence of Ni2+. The effects of Ni2+ on the single-channel kinetics at saturating cIMP are summarized in Fig. 17. As can be seen in this figure, the k 10 rate constant was 25-fold slower in the presence of Ni2+. The median k 01 rate constant was 1.6× faster, although this is not a significant effect. The k 12 and k 21 rate constants were largely unchanged. The overall effect on the C0 ↔ O1 transition was a 2.1-kcal/mol stabilization of the allosteric transition by Ni2+. Fig. 17 B shows a comparison of the values for ΔG 0 obtained from single-channel experiments to the values for ΔG 0 obtained from macroscopic experiments. This comparison reveals that there was a fairly good correspondence between the macroscopic and single-channel experiments. For cAMP, the effect of Ni2+ is summarized in Fig. 18. In this case, Ni2+ sped up the k 01 rate 5-fold and slowed down the k 10 rate 30-fold. The combination of these two effects translates into a 2.9-kcal/mol more favorable allosteric transition. Comparing the values for ΔG 0 obtained from single-channel experiments to the values for ΔG 0 obtained from macroscopic experiments, again the correspondence was good. For cGMP with Ni2+, the k 12 and k 21 rate constants were largely unchanged, but we obtained considerable variation in the values for the k 01 and k 10 rate constants (data not shown). The most likely source of this variation was the fact that the open probability in the presence of cGMP and Ni2+ was so high that there were so few transitions to the C0 level and the HMM algorithm was not able to measure the k 01 and k 10 rate constants with any precision. Quantitatively, this was an expected finding as, for cGMP without Ni2+, the median value for the k 10 rate was 26/s. Assuming that Ni2+ slowed this rate 25–30-fold as it did for cIMP and cAMP, then the expected value of the k 10 rate constant for cGMP plus Ni2 would be 1/s, which is too slow a rate for us to determine in our experiments. Focusing on the results for cAMP and cIMP with Ni2+, we conclude that Ni2+ acts like the cyclic nucleotides in that its primary effect is on the C0 ↔ O1 allosteric transition and not on the O1 ↔ C2 transition. This finding suggests that Ni2+ is a weak noncompetitive agonist of BROD channels.
Figure 17.

The effect of Ni2+ on HMM rate constants for cIMP. (A) Comparison of rate constants for cIMP with and without Ni2+. Values for the rate constants were determined by HMM analysis. The horizontal line within each box indicates the median of the data, boxes show the 25th and 75th percentiles of the data, and whiskers show the 5th and 95th percentiles. Extreme data points are also indicated. (B) Comparison of values for ΔG 0 for activation by cIMP in the presence of Ni2+ between macroscopic and single-channel experiments.
Figure 18.

The effect of Ni2+ on HMM rate constants for cAMP. (A) Comparison of rate constants for cAMP with and without Ni2+. Values for the rate constants were determined by HMM analysis. The horizontal line within each box indicates the median of the data, boxes show the 25th and 75th percentiles of the data, and whiskers show the 5th and 95th percentiles. Extreme data points are also indicated. (B) Comparison of values for ΔG 0 for activation by cAMP in the presence of Ni2+ between macroscopic and single-channel experiments.
discussion
Here we have investigated the gating kinetics of single CNG channels at saturating concentrations of different cyclic nucleotides in the presence and absence of the transition metal divalent Ni2+. We found that a simple two-state C ↔ O scheme is not sufficient to explain the kinetics. Rather, an additional closed state is required. Adding this additional closed state to the C ↔ O model, either on the opposite side of the open state (as in C ↔ O ↔ C) or on the same side of the open state (as in C ↔ C ↔ O) improved the description of the kinetics at saturating ligand concentrations. Although these two schemes are equivalent on the basis of their likelihood values, their interpretations are quite dif-ferent.
Concerted Transition or Multiple Conformational Changes during Activation?
Monod et al. (1965) proposed a mechanism for the activation of allosteric proteins known as the Monod- Wyman-Changeux (MWC) model. The major tenet of their hypothesis was that activation involves a single concerted conformational change. Previously it has been suggested that CNG channels might conform to a MWC model (Stryer, 1987; Tibbs et al., 1995; Varnum and Zagotta, 1996). However, recently it has been suggested that the activation of CNG channels is inconsistent with models in which the four subunits activate in a single concerted step (MWC model) (Ruiz and Karpen, 1997; Liu et al., 1998). Multiple open states with different conductance levels have been observed in channels containing covalently attached ligands (Ruiz and Karpen, 1997). However no substate activity was apparent in our recordings at saturating concentrations of either full or partial agonists (see Fig. 4). In addition, it has been suggested that the four subunits may associate and activate as two independent dimers (Liu et al., 1998). It has also been shown that the underlying gating at saturating cyclic nucleotide concentrations is consistent not only with a single concerted step but also with two or three consecutive conformational changes (Varnum and Zagotta, 1996). Based on these precedents, the C ↔ C ↔ O scheme, which could describe two coupled conformational changes in different subunits or dimers, seems plausible. However, the difference in the cyclic nucleotide dependence of k 01′ and k 12′ (Fig. 13) argues against this possibility.
Alternatively, we have found that the C0 ↔ O1 ↔ C2 scheme has significant cyclic nucleotide dependence in only one of the two transitions. We interpret the first transition of C0 ↔ O1 ↔ C2 to be the allosteric transition. Because the rate constants for the second transition of C0 ↔ O1 ↔ C2 were cyclic nucleotide independent, this transition is unlikely to be a part of the allosteric transition. Rather, it may represent the closing of a secondary gate or a pore blocking state. A rapid flickery proton block has been described in CNG channels (Root and MacKinnon, 1994; Goulding et al., 1992). While the underlying mechanism is undoubtedly more complex than two closed and one open states, this mechanism adequately describes our data and provides a physical interpretation of the results. The qualitative conclusions concerning the effects of cyclic nucleotide and Ni2+ on the stability of the open and transition states should still be valid in more complex models. These conclusions are based on the effects of these allosteric modulators on the open and closed durations and are not dependent on any particular model.
As shown in Fig. 16, the overall ΔG 0 for the allosteric transition ranges was between −2 and 3 kcal/mol for cGMP and cAMP, respectively. Since these cyclic nucleotides differ in only the most distal portion of their purine ring, we conclude that the cyclic nucleotide–binding domain interacts with the purine ring of the cyclic nucleotides differently during the allosteric transition. The energetics for these favorable cyclic nucleotide– binding domain interactions must therefore be determinants of the stability of the open state. Since the cyclic nucleotides affected both the opening and closing rate constants, these interactions can affect the energetic determinants of both the opening and closing conformational changes. If there is a single high energy transition state that determines both the opening and closing rates, these results suggest the interactions between the purine ring and the cyclic nucleotide– binding domain are partially formed at the time of the transition state and serve to reduce the energetic barrier for activation. Alternatively, if the opening and closing rates are determined by a number of low energy transitions, these results suggest that these interactions can be formed before channel opening, and broken before channel closing.
The effects of Ni2+ on the free energy of the allosteric transition was 2–3 kcal/mol (compare Figs. 16–18). The mechanism of action of Ni2+ has previously been shown to involve the coordination of Ni2+ when the channel is in the open conformation by histidines at position H420 on adjacent subunits of the channel (Gordon and Zagotta, 1995a,b). This mechanism suggests that, during the allosteric transition, there is a rearrangement of H420 from neighboring subunits permitting Ni2+ to bind with 2–3 kcal/mol greater affinity to open than to closed channels. Here we show that Ni2+ affected both the opening and closing rate constants (Figs. 17 and 18), suggesting that the interactions between Ni2+ and H420 are partially formed at the time of the transition state for the allosteric transition or can be formed before channel opening, and broken before channel closing. Interpreted in terms of the Monod-Wyman-Changeux model, this result suggests that Ni2+ should be considered as an allosteric ligand of BROD channels. Ni2+ does not merely hold the channel open, rather it induces and stabilizes the allosteric transition.
If Ni2+ is an agonist, then Ni2+ would be expected to be capable of activating BROD channels in the absence of cyclic nucleotide. Yet, we were unable to observe a peak in the amplitude histogram for our control traces in the presence of Ni2+. Would we have expected to see an open-channel peak in this histogram? The spontaneous opening probability has been reported to be 1.25 × 10⁻⁴ (Tibbs et al., 1997) or 1.5 × 10⁻⁵ (Ruiz and Karpen, 1997). If Ni2+ promotes the allosteric transition by the same amount in the absence as in the presence of cyclic nucleotide (40–150-fold), we would expect that the open probability in the presence of Ni2+ would be between 6 × 10⁻⁴ and 1.9 × 10⁻² based on these estimates for the spontaneous opening probability. Since an open probability of 1.9 × 10⁻² is similar to the value for cAMP activation, we believe that we would have observed openings in the presence of Ni2+ if the open probability were that high. Our inability to do so down to a resolution of 2 × 10⁻³ suggests that Ni2+ is a weaker agonist than cAMP. Alternatively, the lack of apparent spontaneous openings by Ni2+ could indicate that Ni2+ only promotes the opening of liganded channels. This would suggest that the conformational change involved in the spontaneous openings is different from the conformational change involved in the ligand-induced openings, at least with reference to the movement of H420. Perhaps, due to some compliance in the gating machinery, the gate can spontaneously open without the movement of the entire C-linker region between the S6 transmembrane segment and the cyclic nucleotide–binding domain. This mechanism might also explain the recent finding of other alterations in the C-linker that do not affect spontaneous openings (Paoletti et al., 1999).
Conclusion
The kinetics at saturating cyclic nucleotide concentrations are described by a model with two closed and one open states. The allosteric transition involves the formation of stabilizing interactions between the cyclic nucleotide and the channel, and these interactions are partially formed at the time of the transition state for the allosteric transition. In the presence of cyclic nucleotides, Ni2+ acts like an agonist of the BROD channel, suggesting that Ni2+, like cyclic nucleotides, should be considered an allosteric modulator of the channel.
Acknowledgments
We thank Heidi Utsugi and Kevin Black for technical assistance, Fred Sigworth and Lalitha Venkataramanan for helpful discussions, and Richard W. Aldrich, Anita Zimmerman, and Jie Zheng for comments on the manuscript.
This work was supported by the Howard Hughes Medical Institute and by a grant from the National Eye Institute (EY10329) to W.N. Zagotta. W.N. Zagotta is an investigator of the Howard Hughes Medical Institute.
Abbreviations used in this paper
- BROD
bovine rod
- CNG
cyclic nucleotide–gated
- HMM
hidden Markov model
references
- Akaike H. A new look at the statistical model identification. IEEE Trans Automatic Control. 1974;19:716–723. [Google Scholar]
- Baum LE, Petrie T, Soules G, Weiss N. A maximization technique occurring in the statistical analysis of probabilistic Markov chains. The Annals of Mathematical Statistics. 1970;41:164–171. [Google Scholar]
- Colquhoun, D., and F.J. Sigworth. 1995. Fitting and statistical analysis of single-channel records. In Single-Channel Recording. B. Sakmann and E. Neher, editors. Plenum Publishing Corp., New York. 483–588.
- Colquhoun, D., and F.J. Sigworth. 1983. Fitting and statistical analysis of single-channel records. In Single-Channel Recording. B. Sakmann and E. Neher, editors. Plenum Publishing Corp., New York. 191–264.
- Fesenko EE, Kolesnikov SS, Lyubarsky AL. Induction by cyclic GMP of cationic conductance in plasma membrane of retinal rod outer segment. Nature. 1985;313:310–313. doi: 10.1038/313310a0. [DOI] [PubMed] [Google Scholar]
- Gordon SE, Brautigan DL, Zimmerman AL. Protein phosphatases modulate the apparent agonist affinity of the light-regulated ion channel in retinal rods. Neuron. 1992;9:739–748. doi: 10.1016/0896-6273(92)90036-d. [DOI] [PubMed] [Google Scholar]
- Gordon SE, Zagotta WN. A histidine residue associated with the gate of the cyclic nucleotide–activated channels in rod photoreceptors. Neuron. 1995a;14:177–183. doi: 10.1016/0896-6273(95)90252-x. [DOI] [PubMed] [Google Scholar]
- Gordon SE, Zagotta WN. Subunit interactions in coordination of Ni2+in cyclic nucleotide–gated channels. Proc Natl Acad Sci USA. 1995b;92:10222–10226. doi: 10.1073/pnas.92.22.10222. [DOI] [PMC free article] [PubMed] [Google Scholar]
- Goulding EH, Ngai J, Kramer RH, Colicos S, Axel R, Siegelbaum SA, Chess A. Molecular cloning and single-channel properties of the cyclic nucleotide–gated channel from catfish olfactory neurons. Neuron. 1992;8:45–58. doi: 10.1016/0896-6273(92)90107-o. [DOI] [PubMed] [Google Scholar]
- Goulding EH, Tibbs GR, Liu D, Siegelbaum SA. Role of H5 domain in determining pore diameter and ion permeation through cyclic nucleotide–gated channels. Nature. 1993;364:61–64. doi: 10.1038/364061a0. [DOI] [PubMed] [Google Scholar]
- Hamill OP, Marty A, Neher E, Sakmann B, Sigworth FJ. Improved patch-clamp techniques for high-resolution current recording from cells and cell-free membrane patches. Pflügers Arch. 1981;391:85–100. doi: 10.1007/BF00656997. [DOI] [PubMed] [Google Scholar]
- Haynes LW, Kay AR, Yau KW. Single cyclic GMP-activated channel activity in excised patches of rod outer segment membrane. Nature. 1986;321:66–70. doi: 10.1038/321066a0. [DOI] [PubMed] [Google Scholar]
- Heginbotham L, Abramson T, MacKinnon R. A functional connection between the pores of distantly related ion channels as revealed by mutant K+channels. Science. 1992;258:1152–1155. doi: 10.1126/science.1279807. [DOI] [PubMed] [Google Scholar]
- Henn DK, Baumann A, Kaupp UB. Probing the transmembrane topology of cyclic nucleotide–gated ion channels with a gene fusion approach. Proc Natl Acad Sci USA. 1995;92:7425–7429. doi: 10.1073/pnas.92.16.7425. [DOI] [PMC free article] [PubMed] [Google Scholar]
- Ildefonse M, Bennett N. Single-channel study of the cGMP-dependent conductance of retinal rods from incorporation of native vesicles into planar lipid bilayers. J Membr Biol. 1991;123:133–147. doi: 10.1007/BF01998084. [DOI] [PubMed] [Google Scholar]
- Ildefonse M, Crouzy S, Bennett N. Gating of retinal rod cation channel by different nucleotides: comparative study of unitary currents. J Membr Biol. 1992;130:91–104. doi: 10.1007/BF00233741. [DOI] [PubMed] [Google Scholar]
- Jan LY, Jan YN. A superfamily of ion channels. Nature. 1990;345:672. doi: 10.1038/345672a0. [DOI] [PubMed] [Google Scholar]
- Karpen JW, Brown RL, Stryer L, Baylor DA. Interactions between divalent cations and the gating machinery of cyclic GMP–activated channels in salamander retinal rods. J Gen Physiol. 1993;101:1–25. doi: 10.1085/jgp.101.1.1. [DOI] [PMC free article] [PubMed] [Google Scholar]
- Karpen JW, Zimmerman AL, Stryer L, Baylor DA. Gating kinetics of the cyclic-GMP–activated channel of retinal rods: flash photolysis and voltage-jump studies. Proc Natl Acad Sci USA. 1988a;85:1287–1291. doi: 10.1073/pnas.85.4.1287. [DOI] [PMC free article] [PubMed] [Google Scholar]
- Karpen JW, Zimmerman AL, Stryer L, Baylor DA. Molecular mechanics of the cyclic-GMP–activated channel of retinal rods. Cold Spring Harbor Symp Quant Biol. 1988b;1:325–332. doi: 10.1101/sqb.1988.053.01.039. [DOI] [PubMed] [Google Scholar]
- Kaupp UB, Niidome T, Tanabe T, Terada S, Bonigk W, Stühmer W, Cook NJ, Kangawa K, Matsuo H, Hirose T, et al. Primary structure and functional expression from complementary DNA of the rod photoreceptor cyclic GMP–gated channel. Nature. 1989;342:762–766. doi: 10.1038/342762a0. [DOI] [PubMed] [Google Scholar]
- Liu DT, Tibbs GR, Paoletti P, Siegelbaum SA. Constraining ligand-binding site stoichiometry suggests that a cyclic nucleotide–gated channel is composed of two functional dimers. Neuron. 1998;21:235–248. doi: 10.1016/s0896-6273(00)80530-9. [DOI] [PubMed] [Google Scholar]
- Liu DT, Tibbs GR, Siegelbaum SA. Subunit stoichiometry of cyclic nucleotide–gated channels and effects of subunit order on channel function. Neuron. 1996;16:983–990. doi: 10.1016/s0896-6273(00)80121-x. [DOI] [PubMed] [Google Scholar]
- Molokanova E, Trivedi B, Savchenko A, Kramer RH. Modulation of rod photoreceptor cyclic nucleotide–gated channels by tyrosine phosphorylation. J Neurosci. 1997;17:9068–9076. doi: 10.1523/JNEUROSCI.17-23-09068.1997. [DOI] [PMC free article] [PubMed] [Google Scholar]
- Monod J, Wyman J, Changeux JP. On the nature of allosteric transitions: a plausible model. J Mol Biol. 1965;12:88–118. doi: 10.1016/s0022-2836(65)80285-6. [DOI] [PubMed] [Google Scholar]
- Paoletti P, Young EC, Siegelbaum SA. C-linker of cyclic nucleotide–gated channels controls coupling of ligand binding to channel gating. J Gen Physiol. 1999;113:17–34. doi: 10.1085/jgp.113.1.17. [DOI] [PMC free article] [PubMed] [Google Scholar]
- Qin F, Auerbach A, Sachs F. Estimating single-channel kinetic parameters from idealized patch-clamp data containing missed events. Biophys J. 1996;70:264–280. doi: 10.1016/S0006-3495(96)79568-1. [DOI] [PMC free article] [PubMed] [Google Scholar]
- Qin F, Auerbach A, Sachs F. Maximum likelihood estimation of aggregated Markov processes. Proc R Soc Lond B Biol Sci. 1997;264:375–383. doi: 10.1098/rspb.1997.0054. [DOI] [PMC free article] [PubMed] [Google Scholar]
- Root MJ, MacKinnon R. Two identical noninteracting sites in an ion channel revealed by proton transfer. Science. 1994;265:1852–1856. doi: 10.1126/science.7522344. [DOI] [PubMed] [Google Scholar]
- Rothberg BS, Magleby KL. Kinetic structure of large-conductance Ca2+-activated K+channels suggests that the gating includes transitions through intermediate or secondary states. A mechanism for flickers. J Gen Physiol. 1998;111:751–780. doi: 10.1085/jgp.111.6.751. [DOI] [PMC free article] [PubMed] [Google Scholar]
- Ruiz ML, Karpen JW. Single cyclic nucleotide–gated channels locked in different ligand-bound states. Nature. 1997;389:389–392. doi: 10.1038/38744. [DOI] [PubMed] [Google Scholar]
- Sigworth FJ, Sine SM. Data transformations for improved display and fitting of single-channel dwell time histograms. Biophys J. 1987;52:1047–1054. doi: 10.1016/S0006-3495(87)83298-8. [DOI] [PMC free article] [PubMed] [Google Scholar]
- Stryer L. Visual transduction: design and recurring motifs. Chem Scr. 1987;27:161–171. [Google Scholar]
- Tibbs GR, Goulding EH, Siegelbaum SA. Spontaneous opening of cyclic nucleotide–gated channels supports an allosteric model of activation. Biophys J. 1995;68:A253. . (Abstr.) [Google Scholar]
- Tibbs GR, Goulding EH, Siegelbaum SA. Allosteric activation and tuning of ligand efficacy in cyclic-nucleotide-gated channels. Nature. 1997;386:612–615. doi: 10.1038/386612a0. [DOI] [PubMed] [Google Scholar]
- Varnum MD, Black KD, Zagotta WN. Molecular mechanism for ligand discrimination of cyclic nucleotide–gated channels. Neuron. 1995;15:619–625. doi: 10.1016/0896-6273(95)90150-7. [DOI] [PubMed] [Google Scholar]
- Varnum MD, Zagotta WN. Subunit interactions in the activation of cyclic nucleotide–gated channels. Biophys J. 1996;70:2667–2679. doi: 10.1016/S0006-3495(96)79836-3. [DOI] [PMC free article] [PubMed] [Google Scholar]
- Venkataramanan, L. 1998. Hidden Markov Modeling of Ion Channel Currents. Ph.D. dissertation. Yale University, New Haven, CT.
- Venkataramanan L, Kuc R, Sigworth FJ. Identification of hidden Markov models for ion channel currents. Part II: State-dependent excess noise. IEEE Trans Signal Process. 1998a;46:1916–1929. [Google Scholar]
- Venkataramanan L, Walsh JL, Kuc R, Sigworth FJ. Identification of hidden Markov models for ion channel currents. Part I: Colored background noise. IEEE Trans Signal Process. 1998b;46:1901–1915. [Google Scholar]
- Yau KW, Baylor DA. Cyclic GMP–activated conductance of retinal photoreceptor cells. Annu Rev Neurosci. 1989;12:289–327. doi: 10.1146/annurev.ne.12.030189.001445. [DOI] [PubMed] [Google Scholar]
- Zagotta WN, Hoshi T, Aldrich RW. Gating of single Shaker potassium channels in Drosophila muscle and in Xenopus oocytes injected with ShakermRNA. Proc Natl Acad Sci USA. 1989;86:7243–7247. doi: 10.1073/pnas.86.18.7243. [DOI] [PMC free article] [PubMed] [Google Scholar]
- Zimmerman AL, Baylor DA. Cyclic GMP–sensitive conductance of retinal rods consists of aqueous pores. Nature. 1986;321:70–72. doi: 10.1038/321070a0. [DOI] [PubMed] [Google Scholar]