

Abstract
Using patch voltage-clamp techniques, we find there are two components to the voltage-gated potassium current (IKv) in rat brown adipocytes. The components differ in their gating and responses to purinergic stimulation, but not their pharmacology. IKv-A recovers from inactivation at physiological membrane potentials, while IKv-B inactivation recovers at more negative potentials. Both currents are >90% blocked by similar concentrations of quinine and tetraethylammonium, but not by β-dendrotoxin, charybdotoxin, or apamin. The two current components are differentially modulated by extracellular ATP. ATP shifts the voltage dependence of IKv-A inactivation negative by 38 ± 5 mV (n = 35, ±SEM) and shifts activation by −14 ± 2 mV in whole-cell experiments. ATP did not affect the steady state inactivation voltage dependence of IKv-B, but did apparently convert IKv-A into IKv-B. The pharmacology of the inactivation shift is consistent with mediation by a P2 purinergic receptor. Purinergic stimulation of perforated-patch clamped cells causes hyperpolarizing shifts in the window current of IKv-A by shifting inactivation −18 ± 4 mV and activation −7 ± 2 mV (n = 16). Since perforated-patch recordings will most closely resemble in vivo cell responses, this ATP-induced shift in the window current may facilitate IKv activation when the cell depolarizes. IKv activity is necessary for the proliferation and differentiation of brown adipocytes in culture (Pappone, P.A., and S.I. Ortiz-Miranda. 1993. Am. J. Physiol. 264:C1014–C1019) so purinergic modulation of IKv may be important in altering adipocyte growth and development.
Keywords: adenosine triphosphate, pharmacology; brown fat, physiology; electrophysiology; potassium channels, physiology; receptors, purinergic, metabolism
introduction
Brown adipocytes have a voltage-dependent K+ current (IKv)1 that activates with membrane depolarization (Lucero and Pappone, 1989; Russ et al., 1993). Brown adipocyte IKv is similar to delayed rectifier potassium currents in other nonexcitable cells. IKv activates rapidly with depolarizations positive to approximately −35 mV, inactivates slowly, and deactivates rapidly when the cell is returned to the holding potential (Lucero and Pappone, 1989). The current is blocked by quinine, verapamil, 4-aminopyridine, and high tetraethyl ammonium concentrations, but not by apamin or charybdotoxin (Lucero and Pappone, 1989; Pappone and Ortiz-Miranda, 1993).
Sympathetic nerve stimulation potently regulates brown fat cell function. Acute adrenergic stimulation activates membrane conductances, elevates cytosolic calcium, and increases thermogenesis by activating lipolysis and mitochondrial uncoupling (Nedergaard and Lindberg, 1982; Girardier and Schneider-Picard, 1983; Horowitz et al., 1983; Lee et al., 1993). Chronic sympathetic stimulation promotes hyperplasia, hypertrophy, and differentiation of brown fat, resulting in increased thermogenic capacity (Geloen et al., 1988; Himms-Hagen, 1989; Bronnikov et al., 1992). Norepinephrine released by sympathetic nerve activity stimulates both α- and β-adrenergic receptors to depolarize brown adipocytes, potentially activating IKv. α-Adrenergic stimulation activates a depolarizing Ca2+-dependent Cl− conductance (ICl,Ca) (Dasso et al., 1990; Pappone and Lee, 1995). β-Adrenergic stimulation activates a nonselective cation conductance (Horwitz et al., 1989; Lucero and Pappone, 1990). In addition, cell swelling activates a second depolarizing Cl− conductance (Pappone and Lee, 1995). These sympathetically induced membrane depolarization events could activate IKv.
IKv is important for brown adipocyte function. IKv is necessary for proliferation of brown adipocytes in culture (Pappone and Ortiz-Miranda, 1993), but not for norepinephrine-activated heat production (Pappone and Lucero, 1992). The mechanism of IKv's effects on brown adipocyte growth are not known. Possibly sympathetic activation of IKv is important for cell volume regulation or Ca2+ responses required for cell proliferation. Simultaneous sympathetic activation of ICl,Ca and IKv in brown fat cells could result in loss of KCl from the cell and decrease cell volume, as in lymphocytes, epithelial cells, and hepatocytes (Cahalan and Lewis, 1988; Felipe et al., 1993; Strange, 1994; Graf and Haussinger, 1996). IKv activation could also facilitate Ca2+ entry into the brown adipocyte by increasing the Ca2+ electrochemical gradient, akin to the mechanism described in lymphocytes (Lin et al., 1993).
The effects of adrenergic stimulation in vitro do not fully explain the effects that cold exposure or overfeeding have on brown adipose tissue in vivo (Geloen et al., 1988; Yamashita et al., 1994), suggesting that additional agents may contribute to sympathetic actions. Norepinephrine and ATP are colocalized within sympathetic nerve terminals and may be released simultaneously with sympathetic neuronal activity (Lagercrantz, 1976; Westfall et al., 1990). Moreover, brown adipocytes respond to extracellular ATP. P2 receptor stimulation increases cytosolic Ca2+ and increases membrane turnover and membrane conductances, but does not alter norepinephrine-elicited thermogenesis (Pappone and Lee, 1996; Lee and Pappone, 1997a).
Channel activity in other cell types can be modulated by extracellular ATP. P2 receptor stimulation decreases the activity of voltage-gated K+ currents in hippocampal neurons (Nakazawa and Inoue, 1994) and enhances delayed rectifier K+ current activity in atrial myocytes (Matsuura et al., 1996b; Matsuura and Ehara, 1997). Structurally related voltage-gated Ca2+ currents are inhibited by purinergic stimulation in ventricular myocytes (Qu et al., 1993a,b; Von zur Muhlen et al., 1997) and potentiated in hippocampal neurons (Dave and Mogul, 1996). We therefore examined whether extracellular ATP affects IKv in rat brown adipocytes. We find that brown adipocyte IKv has two components with different gating properties. One component (IKv-A) is activated at physiological membrane potentials, while the other (IKv-B) is inactive under normal conditions. Extracellular ATP modulates the gating of IKv-A, and converts IKv-A into IKv-B. A preliminary account of this work has been presented (Wilson and Pappone, 1996).
materials and methods
Cells
Brown adipocytes were isolated from the interscapular fat pads of 1–14-d-old Sprague-Dawley rat pups by collagenase digestion and plated on collagen-coated glass coverslips as previously described (Lucero and Pappone, 1989). Cells were incubated at 37°C and 5% CO2 in Dulbecco's modified Eagle's medium supplemented with 5% fetal calf/horse serum, 0.2 U/ml insulin, 100 μg/ml penicillin, 0.1 mg/ml streptomycin, and 0.25 μg/ml amphotericin B. Cells were maintained in culture for 1–14 d before patch clamping. Mature brown adipocytes for voltage clamp experiments were identified by their many fat droplets.
Electrophysiology
Voltage clamp currents were measured using nystatin perforated-patch (Horn and Marty, 1988) or standard whole-cell patch clamp techniques (Hamill et al., 1981) as previously described (Lucero and Pappone, 1989, 1990). Thick-walled borosilicate capillaries (Sutter Instruments, Inc.) were used to manufacture pipettes with resistances of 3–4 Mohm. Typically, 50% of the 7–10-Mohm access resistance was compensated at the clamp amplifier. The voltage offset between the patch pipette and the bath solution was nulled immediately before patch formation. Membrane currents were recorded, filtered through a four-pole bessel filter at 5 kHz, and membrane capacity currents nulled with the patch clamp amplifier (3900; Dagan Corp., or Axopatch 200A; Axon Instruments) connected to a computer via a TL-1 (Axon Instruments) or ITC-16 (Instrutech) interface. Unstimulated cell capacitance ranged from 20 to 40 pF. Resting membrane potentials measured in current clamp were −20 to −40 mV.
Several different voltage protocols were used. The voltage dependence of activation was determined from currents during step depolarizations from the −60-mV holding potential (HP) or after a 3-s conditioning prepulse to −100 mV. The depolarizations ranged from −50 or −60 to +60 mV in 10-mV increments and were 400-ms long. The time course of ATP action was determined from currents during depolarizations to +40 mV. These 400-ms depolarizing steps were repeated every 20 s or 1 min from the −60 mV HP or −100 mV prepulse potential. Peak instantaneous tail current amplitude was determined from currents recorded during repolarization from a +40 mV, 400-ms depolarization. The cell was repolarized to potentials from +40 to −60 mV in 10-mV increments. The voltage dependence of steady state inactivation was determined from currents during depolarizations after 3- or 6-s conditioning prepulses from 0 to −120 mV. Linear leak and membrane capacitative currents were subtracted using a P/4 or P/5 procedure (Armstrong and Bezanilla, 1974; Lucero and Pappone, 1989) in the activation, time course, and tail current protocols. Pulse protocols were delivered and data collected and analyzed using either pClamp, version 6 (Axon Instruments) or Pulse, version 8.07 (Instrutech) software.
Solutions
Cells for patch clamp experiments were placed in a 0.5-ml chamber and continuously perfused with either bicarbonate-buffered Krebs solution equilibrated with 95% O2 /5% CO2 at a rate of ≈1 ml/min or, in most perforated-patch experiments, a low-chloride Ringer's solution with 500 nM apamin, to eliminate Ca2+-activated K+ and Cl− currents (ICl,Ca and IK,Ca). The Krebs solution contained (mM): 120 NaCl, 4.5 KCl, 0.5 MgCl2, 2 CaCl2, 0.7 Na2HPO4, 1.3 NaH2PO4, 25 NaHCO3, 10 glucose, pH 7.4. The low-chloride solution contained (mM): 135 Na-aspartate, 4 KCl, 2 CaCl2, 0.5 MgCl2, 10 HEPES, pH 7.4. In some experiments, a Ringer's solution was used (mM): 135 NaCl, 4 KCl, 2 CaCl2, 0.5 MgCl2, 10 HEPES, pH 7.4. The pipette solution for whole-cell experiments usually contained (mM): 100 K-aspartate, 25 KCl, 10 NaCl, 1 CaCl2, 10 EGTA, 10 MOPS, titrated to pH 7.2 with KOH. For perforated-patch experiments, the internal pipette solution usually contained (mM): 115 K-aspartate, 25 KCl, 10 NaCl, 10 MOPS, ≈0.25 mg/ml nystatin, and 0.1% pluronic F127, titrated to pH 7.2 with KOH. In some whole-cell experiments, 1 mM ATP and 0.5 mM MgCl2 were added to the pipette solution. The cytosolic Ca2+ concentration was calculated to be ≈20 nM for the whole-cell pipette solution with Patchers Power Tools (F. Mendez, Göttingen, Germany). Osmolarities of the solutions ranged from 273 to 310 mosM. All chemicals applied to cells were mixed with the bath solution from thawed frozen stock solutions immediately before application. ATP, 2-methylthio ATP (2-MeSATP), α,β methylene ATP (α,β MeATP), ADP, and adenosine were made up as 1–100-mM stock solutions in H2O. Nystatin (50 mg/ml) and pluronic F127 (0.2 g/ml) stock solutions were made up in DMSO.
Chemicals
2-Methylthio ATP and α,β methylene ATP were from Research Biochemicals Int. or Calbiochem, pluronic F127 was from Molecular Probes, Inc. Nystatin dihydrate was from Fluka Biochemical. Apamin, charybdotoxin, β-dendrotoxin, quinine sulfate, and tetraethylammonium were from Alamone Labs. All other chemicals were from Sigma Chemical Co.
Analysis
Peak conductances (G) were calculated from peak current values for the voltage dependence of K+ current activation at each potential assuming that the reversal potential was equal to E K. The conductance values were fitted with the Boltzmann relation:
 |
1 |
where G max was the maximum conductance value, E 1/2 the half-maximal activation voltage, E m the membrane voltage, and k the slope factor of the voltage dependence. The voltage dependence of steady state inactivation was described by fitting peak currents (I) during depolarizations from different prepulse potentials with the sum of two Boltzmann relations:
 |
 |
2 |
where I max was the maximum current, E 1/2 the half-maximal inactivation voltage, E m the membrane voltage, and k the slope factor of voltage dependence. Values in tables are given as the mean ± SEM. Student's t test was performed using a P < 0.05 criterion to test for significance. Either Statview version 4.5 (SAS Institute) or Excel version 5 (Microsoft Corp.) software was used for statistical analysis.
results
Brown Adipocytes Have Two Voltage-gated K+ Currents
The two components of the voltage-gated K+ current can be differentiated in brown adipocytes based on their voltage dependence of inactivation. Fig. 1 A shows whole-cell currents recorded during depolarizations to +40 mV after 3-s conditioning pulses from 0 to −120 mV in 10-mV increments. There are clearly two components to the current recovered by the increasingly more negative conditioning pulses. One component recovers from inactivation completely with conditioning pulses negative to −50 mV. Additional current is recovered with conditioning pulses negative to −70 mV. This second current component requires hyperpolarizations negative to −100 mV for complete recovery.
Figure 1.

IKv can be divided into two components based on the voltage dependence of inactivation. (A) Currents used to measure steady state inactivation. IKv was measured during 400-ms test pulses to +40 mV after 3-s prepulses from 0 to −120 mV in 10-mV increments, applied every 20 s, from −60 mV. (B) Peak current amplitude during the test pulse at each prepulse potential for the same cell. The curve is the sum of two Boltzmann relations (Eq. 2) fit to the data. IKv-A E 1/2 = −23 mV, and IKv-B E 1/2 = −83 mV. k = −6 mV for both current components. IKv-B is 53% of the total IKv.
Although their inactivation differs, the two current components share other similarities. Both current components are carried by K+. The combined current is highly selective for K+ ions, showing a shift in the reversal potential of 56 ± 6 mV (n = 3) per 10-fold change in extracellular K+ concentration. In addition, the two components show similar pharmacology. Both are blocked more than 90% by 50 mM tetraethylammonium (n = 5) or 100 μM quinine sulfate (n = 2), but are unaffected by 100 nM β-dendrotoxin (n = 3), 100 nM charybdotoxin (n = 3), or 500 μM apamin (n = 17).
The steady state inactivation-voltage relation for these two voltage-gated K+ currents can be fit by the sum of two Boltzmann distributions (Eq. 2), as shown in Fig. 1 B. We have termed the component activated from a −60-mV HP IKv-A. The current component inactivating at more negative potentials is IKv-B. IKv-B inactivates at potentials that average 60–70 mV more negative than IKv-A, as summarized in Table I. Our previous studies of IKv (Lucero and Pappone, 1989) were confined to more physiological potential ranges, and so failed to activate this second component of IKv.
Table I.
Voltage Dependence of Steady State Inactivation
| Perforated patch | Whole-cell w/o ATPin | Whole-cell w/ATPin | ||||||||||||||||
|---|---|---|---|---|---|---|---|---|---|---|---|---|---|---|---|---|---|---|
| E1/2 | k | n | E1/2 | k | n | E1/2 | k | n | ||||||||||
| IKv-A | −20 ± 1.7 mV | −5 ± 0.3 mV | 20 | −30 ± 1.1 mV* | −6 ± 0.3 mV | 52 | −29 ± 0.2 mV* | −6 ± 0.2 mV | 21 | |||||||||
| IKv-B | −88 ± 2.0 mV‡ | −9 ± 0.9 mV | 20 | −90 ± 0.8 mV‡ | −7 ± 0.2 mV* | 52 | −87 ± 1.4 mV‡ | −8 ± 0.8 mV | 21 | |||||||||
The sum of two Boltzmann distributions was fit to steady state inactivation–voltage relations as shown in Fig. 1 B. E 1/2 is the voltage at which one half of the current is inactivated, k is the slope factor. Whole-cell w/o ATPin denotes whole-cell recording with a nucleotide-free pipette solution. Whole-cell w/ATPin denotes whole-cell experiments with a pipette solution containing 1 mM ATP and 0.5 mM Mg2+. Numbers are the mean ± SEM.
Significant difference between perforated-patch and whole-cell experiments using an unpaired t test (P < 0.01).
Significant difference between IKv-A and IKv-B using a paired t test (P < 0.001).
The voltage dependence for activation of IKv-A and IKv-B also differ. Fig. 2, A and B, shows IKv activated from holding potentials of −60 and −100 mV, respectively. Since IKv-A is fully recovered at a holding potential of −60 mV, but IKv-B is inactivated at this potential, Fig. 2 A presents IKv-A in isolation. Fig. 2 B shows IKv-A and IKv-B combined since both are fully recovered from inactivation at −100 mV. IKv-B (Fig. 2 C) was isolated by subtracting IKv-A (Fig. 2 A) from the combined current (Fig. 2 B). The conductance–voltage relations for IKv-A and IKv-B can be fit by Boltzmann distributions (Eq. 1), as shown in Fig. 2 D. IKv-B activates at more negative membrane potentials than IKv-A as shown in Fig. 2 D and summarized in Table II. The difference in activation voltage dependence between IKv-A and IKv-B averaged 21 mV, much less than the 60–70 mV difference seen in inactivation voltage dependence. The apparent difference in IKv-B activation voltage dependence is in the wrong direction to be caused by a Cole-Moore–type shift induced by the −100-mV prepulse (Cole and Moore, 1960).
Figure 2.

Activation of IKv-A and IKv-B. (A) IKv-A currents in isolation. Currents were recorded every 5 s during 400-ms depolarizations from −60 to +60 mV in 10-mV increments from −60 mV. The potential was returned to −60 mV after each test pulse. Linear currents were subtracted using a P/4 protocol. (B) Currents from the same cell recorded during depolarizations after a 3-s conditioning pulse to −100 mV applied every 15 s. The potential returned to −100 mV for 100 ms after each test pulse. (C) IKv-B currents isolated by subtracting the currents in A from those in B. (D) Normalized conductance– voltage relations determined from these records for IKv-A (•) and IKv-B (○). For IKv-A (solid line), E 1/2 = 7 mV, k = 10 mV; for IKv-B (dashed line), E 1/2 = −7 mV, k = 18 mV (Eq. 1). For this cell, G max = 20 nS for IKv-A and 15 nS for IKv-B.
Table II.
Voltage Dependence of Activation
| Perforated patch | Whole-cell w/o ATPin | Whole-cell w/ATPin | ||||||||||||||||
|---|---|---|---|---|---|---|---|---|---|---|---|---|---|---|---|---|---|---|
| E1/2 | k | n | E1/2 | k | n | E1/2 | k | n | ||||||||||
| IKv-A | 9 ± 1.0 mV | 13 ± 0.5 mV | 32 | 6 ± 0.7 mV* | 11 ± 0.4 mV | 55 | 5 ± 1.0 mV* | 12 ± 0.3 mV | 46 | |||||||||
| IKv-B | — | — | −17 ± 1.5 mV‡ | 11 ± 0.8 mV | 55 | −13 ± 4.0 mV‡ | 14 ± 2.0 mV‡ | 12 | ||||||||||
E 1/2 and k were determined by fitting Boltzmann distributions to the peak conductances of IKv-A and IKv-B, isolated as shown in Fig. 2. E 1/2 is the voltage at which one half of the current is activated, k is the slope factor. Whole-cell w/o ATPin denotes whole-cell recording with a nucleotide-free pipette solution. Whole-cell w/ATPin denotes whole-cell experiments with a pipette solution containing 1 mM ATP and 0.5 mM Mg2+. Numbers are the mean ± SEM.
Significant difference between perforated-patch and whole-cell experiments using an unpaired t test (P < 0.05).
Significant difference between IKv-A and IKv-B using a paired t test (P < 0.05).
Table I shows that the inactivation voltage dependence of IKv-A, but not IKv-B, depends on the recording configuration. The midpoint for IKv-A inactivation averaged 10 mV more positive in perforated-patch than in whole-cell recordings. Neither IKv-B inactivation nor IKv-A activation (Table II) showed similar shifts in voltage dependence. Thus, the shift in IKv inactivation is unlikely to be caused by a diffusion potential or general surface potential difference between the two recording methods. It is more likely that the difference in IKv-A voltage dependence result from dialysis of some cytosolic component in whole-cell recordings. The missing component is not ATP. In whole-cell experiments, the midpoints of IKv-A inactivation and activation were similar, with or without internal ATP (Tables I and II). The proportion of IKv carried by IKv-A and IKv-B also differed in whole-cell and perforated-patch experiments. IKv-A and IKv-B each comprise ≈50% of total IKv on average in whole-cell experiments as shown in Table III. However, the distribution between IKv-A and IKv-B varied widely from cell to cell, with 0–85% of total IKv carried by IKv-B. Table III also shows that the distribution of IKv between IKv-A and IKv-B changes with the recording condition. The apparent redistribution was due to a 2.5-fold increase in IKv-B magnitude in whole-cell compared with perforated-patch recordings. Neither the total K+ current nor the relative proportions of IKv-A and IKv-B varied with cell size or the culture age of the cell.
Table III.
Voltage-dependent K+ Current Amplitudes
| Perforated patch | Whole-cell w/o ATPin | Whole-cell w/ATPin | ||||||||||||||||
|---|---|---|---|---|---|---|---|---|---|---|---|---|---|---|---|---|---|---|
| Current | Percent total | n | Current | Percent total | n | Current | Percent total | n | ||||||||||
| Total IKv | 1.2 ± 0.14 nA | 21 | 2.0 ± 0.2 nA* | 51 | 1.8 ± 0.2 nA | 19 | ||||||||||||
| IKv-A | 0.8 ± 0.09 nA‡ | 69 ± 8% | 0.8 ± 0.1 nA‡ | 45 ± 2%* ‡ | 0.9 ± 0.1 nA | 55 ± 4%§ | ||||||||||||
| IKv-B | 0.4 ± 0.08 nA | 31 ± 7% | 1.1 ± 0.1 nA* | 55 ± 2%* | 0.9 ± 0.2 nA* | 45 ± 4%§ | ||||||||||||
Amplitudes of IKv-B and IKv-A were determined from Boltzmann relations fit to steady state inactivation current–voltage relations, as shown in Fig. 1 B. Whole-cell w/o ATPin denotes whole-cell recording with a nucleotide-free pipette solution. Whole-cell w/ATPin denotes whole-cell experiments with a pipette solution containing 1 mM ATP and 0.5 mM Mg2+. Numbers are the mean ± SEM.
Significant difference between perforated-patch and whole-cell experiments using an unpaired t test (P < 0.05).
Significant difference between IKv-A and IKv-B using a paired t test (P < 0.05).
Significant difference between whole-cell recordings with and without internal ATP using an unpaired t test (P < 0.05).
Purinergic Receptor Stimulation Modulates the Gating Properties of IKv-A
P2 receptor activation dramatically decreases the amplitude of IKv-A in whole-cell experiments. Fig. 3 A shows IKv-A activated during bath application of the P2 receptor agonist 2-MeSATP. 0.05 μM 2-MeSATP decreased IKv-A amplitude without much change in current kinetics. Peak IKv-A declined rapidly within 180 s after the solution change. Fig. 3 B shows the time course of the 2-MeSATP effects. The decrease in peak current was sustained after agonist washout and did not recover with 5 min of wash in this experiment, or in up to 30 min in other whole-cell experiments. Holding currents at −60 mV were not affected by 2-MeSATP, suggesting that P2 stimulation does not directly activate ion channels.
Figure 3.

P2 receptor agonist exposure decreases IKv in a whole-cell experiment. (A) IKv-A currents recorded during depolarizations to +40 mV from the −60-mV HP at the cell times indicated. 0.05 μM 2-MeSATP was added at 1,080 s to the bathing solution. (B) Peak IKv-A at +40 mV (•) and holding current at −60 mV (⋄) amplitudes measured every 20 s. 0.025 or 0.05 μM 2-MeSATP was present during the times shown by the bars. Linear currents were subtracted from the +40-mV records using a P/4 protocol. The pipette contained a solution with K-aspartate with ≈18 nM Ca2+.
The decrease in IKv-A with ATP is the result of a hyperpolarizing shift in the voltage dependence of steady state inactivation. Fig. 4 A shows steady state inactivation measurements before ATP in a whole-cell experiment. In this cell a −60-mV conditioning pulse fully recovered IKv-A, while a −100-mV prepulse fully recovered IKv-B. Fig. 4 B shows that after exposure to 0.3 μM ATP both IKv-A and IKv-B inactivation were still fully recovered with the −60- and −100-mV prepulses, respectively, although the midpoint for IKv-A inactivation was shifted 10 mV negative. After a subsequent exposure to 0.7 μM ATP (Fig. 4 C), IKv-A was shifted even more, and the two current components could no longer be distinguished. In general, repeated applications of ATP caused IKv-A inactivation to shift to more and more negative potentials. The shifts in IKv-A seemed to depend continuously on stimulus duration and intensity, with no sign of discrete intermediate states. In addition, there was no end point to the shift apparent in the achievable range of membrane potentials (i.e., as much or more than −120 mV).
Figure 4.

ATP induces hyperpolarizing shifts in the voltage dependence of inactivation in a whole-cell recording. (A) Currents used to measure steady state inactivation before ATP. The currents were measured as described in Fig. 1. (B) Currents measured with the same protocol after 11 min of exposure to 0.3 μM ATP. (C) Currents after a 10 min exposure to 0.7 μM ATP. (D) Peak current amplitudes versus prepulse potential before (○), after 0.3 μM ATP (•), and 0.7 μM ATP (♦) in this cell. Smooth curves are the sum of two Boltzmann relations (Eq. 2). Before ATP (solid line), IKv-A E 1/2 = −26 mV and IKv-B E 1/2 = −81 mV. After 0.3 μM ATP (dashed line), IKv-A E 1/2 = −36 mV and IKv-B E 1/2 = −76 mV. After 0.7 μM ATP (dotted line), IKv-A E 1/2 = −61 mV and IKv-B E 1/2 = −89 mV. k was fixed at −5 mV throughout. This pipette solution contained K-aspartate, 1 mM ATP, and ≈18 nM Ca2+.
The steady state inactivation–voltage relation for the currents before and after ATP can be well fit by the sum of two Boltzmann relations (Eq. 2), as shown in Fig. 4 D. The data in Fig. 4 D suggest that ATP selectively shifts the midpoint for IKv-A inactivation without affecting its steepness. 0.3 μM ATP shifted the midpoint for IKv-A inactivation 10 mV negative compared with control currents, while 0.7 μM ATP shifted the IKv-A midpoint 35 mV more negative than control currents. Corresponding shifts in E 1/2 for IKv-B were only −5 and −8 mV, comparable with shifts sometimes seen in whole-cell recordings without purinergic stimulation over a similar time course.
P2 receptor stimulation caused smaller shifts in the activation voltage dependence of IKv-A in whole-cell experiments. Fig. 5 shows that the threshold for detectable IKv-A activation was shifted by approximately −10 mV and the midpoint of the conductance–voltage relation shifted by −13 mV in a cell exposed to 0.02 μM ATP for 10 min. IKv-A activation shifts with ATP were consistently approximately one third the magnitude of inactivation shifts in whole-cell recordings. IKv-B activation voltage dependence was not determined, since both IKv-A and IKv-B components were recovered at the −100-mV conditioning potential after ATP and they could no longer be separated.
Figure 5.

ATP shifts IKv-A activation voltage dependence in a whole-cell recording. (A) IKv-A currents before ATP. Leak subtracted currents were recorded every 5 s during 400-ms voltage steps from −50 to +60 mV in 10-mV increments, applied from the −60-mV HP. (B) Currents after a 10-min exposure to 0.02 μM ATP in the same cell. (C) Peak current–voltage relationship for IKv-A before (○) and after (•) ATP. Threshold for IKv-A activation was −20 mV before and −30 mV after ATP. IKv-A amplitude at +60 mV decreased ≈50% after ATP. (D) Normalized conductance–voltage relationship before (○) and after (•) ATP in this cell. Boltzmann relations (Eq. 1) fit to the data gave IKv-A E 1/2 = +5 mV, k = 12 mV before ATP (solid line) and IKv-A E 1/2 = −8 mV, k = 15 mV after ATP (dotted line). The pipette contained a solution with K-aspartate with ≈100 nM Ca2+.
P2 receptor stimulation affects IKv-A currents in perforated-patch clamped cells, but the effects are more complicated than in whole-cell recordings. IKv-A currents were both increased and decreased by ATP in cells with an intact cytoplasm. In addition, 10–100-fold greater concentrations of ATP were required to modulate IKv-A in perforated-patch than were effective in whole-cell recordings. Fig. 6 A shows peak IKv-A amplitude in a perforated-patch recording during bath applications of ATP. A 30-s application of 5 μM ATP slightly increased peak IKv-A. ATP increased IKv-A in the cell in Fig. 6 A by shifting the voltage dependence of activation approximately −15 mV. IKv-A inactivation shifted less (−10 mV) than activation with ATP, in contrast to whole-cell experiments. Thus, the overall effect of the initial ATP application was to make more IKv-A activatable at +40 mV, without appreciably affecting the amount of inactivation present at −60 mV, resulting in greater IKv-A during depolarization. Initial 30-s exposures to 5 μM ATP caused similar IKv-A increases in 10 of 14 cells. IKv-A decreased in three cells and one cell showed no change in IKv-A amplitude. Repeated exposures to ATP decreased IKv-A in 12 of 14 perforated-patch recordings, as in the example of Fig. 6 A. A second 30-s exposure to 5 μM ATP decreased IKv-A slightly, while a third, 1-min exposure resulted in an ≈60% decrease in IKv-A amplitude. ATP transiently increased the leak current measured at −55 mV also. This could be due to stimulation of Ca2+-activated conductances, since neither Ca2+-activated Cl− or K+ conductances were controlled. Alternatively, a nonselective cation conductance may have been activated by ATP (Lee and Pappone, 1997a). However, this is unlikely because in other perforated-patch experiments where the Ca2+-activated K+ and Cl− conductances were blocked, ATP effects on IKv-A were not necessarily associated with increases in leak currents. Fig. 6 B shows superimposed IKv-A currents during depolarization to +40 mV, before and after ATP. The initial exposure to ATP increased the rates of both activation and inactivation. Moreover, as shown in Fig. 6, C and D, ATP shifted the potential for maximal steady state IKv-A (window current) to more hyperpolarized potentials. The potential of the peak window current was shifted negative by 18 mV, through a −25-mV shift in inactivation and a −23-mV shift in activation. Thus, the effects of ATP on IKv-A in perforated-patch clamped cells are qualitatively similar to those in whole-cell experiments in that the voltage dependence of IKv-A gating is shifted negative. However, there are differences in the time course, concentration dependence, and magnitude of ATP's effects with recording configuration.
Figure 6.

Effects of ATP on IKv-A in a perforated-patch recording. (A) Peak IKv-A (•) measured during depolarizations to +40 mV from the −60-mV holding potential, and linear leak current (▿) amplitudes measured during P/4 depolarizations to −55 mV from the −80-mV leak holding potential. 5 μM ATP was present during the times shown by the bars. Numbered time points 3 (control), 4, and 7 (after ATP) correspond to current traces in B, 1 and 2 to control normalized conductance–voltage measurements shown in C, and 5 and 6 to the conductance–voltage relations after ATP shown in D. (B) IKv-A measured at the times shown in A. 3 indicates control, 4 and 7 are after one and three exposures to ATP. (C) Normalized activation (g) and steady state inactivation (h∞) conductance–voltage relations before ATP. Boltzmann relations (Eq. 1) fitted to the data collected at the times indicated in A. Before ATP activation E 1/2 = 18 mV, and steady state inactivation E 1/2 = −17 mV. (D) Normalized activation (g) and steady state inactivation (h∞) conductance–voltage relations after ATP. Boltzmann relations (Eq. 1) gave activation E 1/2 = −5 mV and steady state inactivation E 1/2 = −32 mV. k was fixed at 6 mV for activation and for steady state inactivation was fixed at −14 mV. Shaded areas in C and D show voltage range for steady state IKv-A (window current). Dashed line shows potential of the peak window current in C and D, which shifted 18 mV negative after ATP.
The summarized data in Fig. 7 A show that the effects of ATP on steady state inactivation depend on the recording configuration. ATP (0.01–100 μM for 30 s to 10 min) shifted E 1/2 for IKv-A inactivation an average of 38 ± 5 mV more negative in nucleotide-free whole-cell and 18 ± 4 mV more negative in perforated-patch experiments. Over equivalent time periods (i.e., 30 min), E 1/2 for IKv-A and IKv-B inactivation shifted −9 mV (n = 8) in control whole-cell recordings. Hence, the 38-mV hyperpolarizing shift of IKv-A inactivation with ATP was significantly greater than controls, but the 5-mV hyperpolarizing shift in IKv-B in ATP-treated cells was not. In the same control whole-cell recordings the slope for IKv-A and IKv-B inactivation decreased, and the slope variable, k, increased by 2–6 mV over the 30 min. Thus, the 0–4-mV increase in k after ATP for IKv-A and IKv-B was not different from controls. Overall, the results show that ATP selectively shifts the voltage dependence of IKv-A steady state inactivation, and this effect is greater in whole-cell than in perforated-patch recordings.
Figure 7.
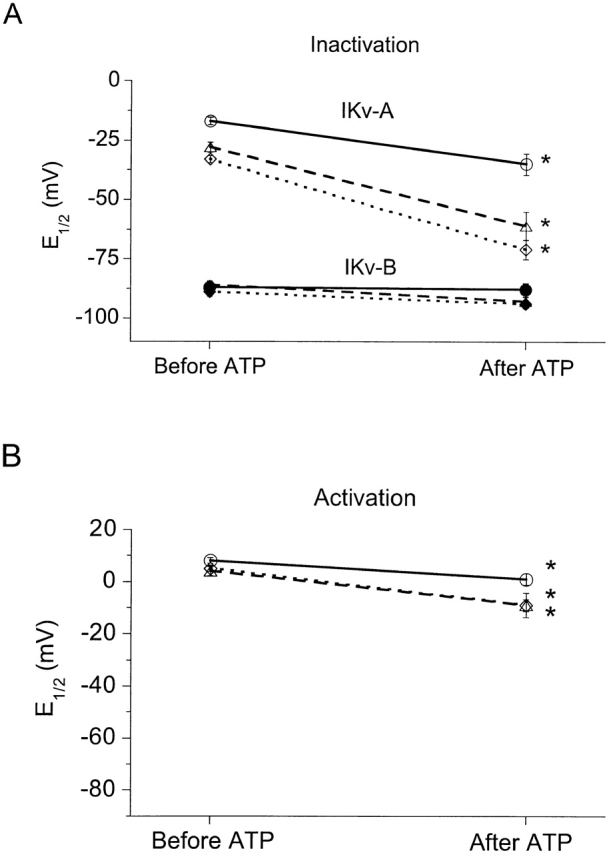
ATP affects IKv-A activation and inactivation in whole-cell and perforated-patch clamp experiments. (A) Effects of ATP on E 1/2 for IKv-A and IKv-B steady state inactivation. Average E 1/2s for steady state inactivation are shown for IKv-A (open symbols) and IKv-B (filled symbols) from 16 perforated-patch (circles), 35 whole-cell nucleotide free (diamonds), and 23 whole-cell with internal MgATP (triangles) experiments before and after ATP. (B) Effects of ATP on E 1/2 for IKv-A activation. Shown is the average E 1/2 for activation from 16 perforated-patch (○), 35 whole-cell nucleotide free (⋄), and 16 whole-cell with internal MgATP (▵) experiments before and after ATP. Error bars represent ±SEM. For some conditions, the error is smaller than the symbol. *Significant difference between control and ATP-exposed conditions based on a paired t test (P < 0.05).
The effects of ATP on the activation voltage relation for IKv-A also depend on the recording configuration. As summarized in Fig. 7 B, ATP shifts E 1/2 for IKv-A activation −14 ± 2 mV in nucleotide-free whole-cell recordings and −7 ± 2 mV in perforated-patch experiments. In whole-cell experiments not stimulated with ATP, E 1/2 for activation only shifted −2 ± 2 mV in 30 min. The slope variable, k, was not affected by ATP. In both control and ATP-stimulated whole-cell recordings, k decreased by 1–3 mV in 30 min.
IKv-A and IKv-B May Represent Two States of the Same Channel
Purinergic stimulation may convert IKv-A into IKv-B in whole-cell experiments. The total amount of IKv did not change significantly with purinergic stimulation, but the relative contributions of IKv-A and IKv-B to the total IKv did change. After ATP total IKv decreased 4 ± 4% in 11 whole-cell experiments and increased 20 ± 10% in 12 perforated-patch experiments. The decrease in IKv in the whole-cell recordings is similar to current run down without ATP exposure. Fig. 8 A shows steady state inactivation voltage relations before and after ATP in a whole-cell recording. Maximum IKv-A was reduced by 0.5 nA after ATP, and maximum IKv-B increased by 0.5 nA, leaving total IKv unchanged. In whole-cell recordings in which the two current components were clearly identifiable after ATP, such as that in Fig. 8 A, there was a correlation between the decrease in IKv-A and increase in IKv-B induced by ATP as shown in Fig. 8 B. The correlation was strongest in cells exposed to ATP in the whole-cell configuration. In perforated-patch experiments, total IKv increased after ATP, and in many cells this was due to an increase in IKv-A amplitude without any change in IKv-B.
Figure 8.
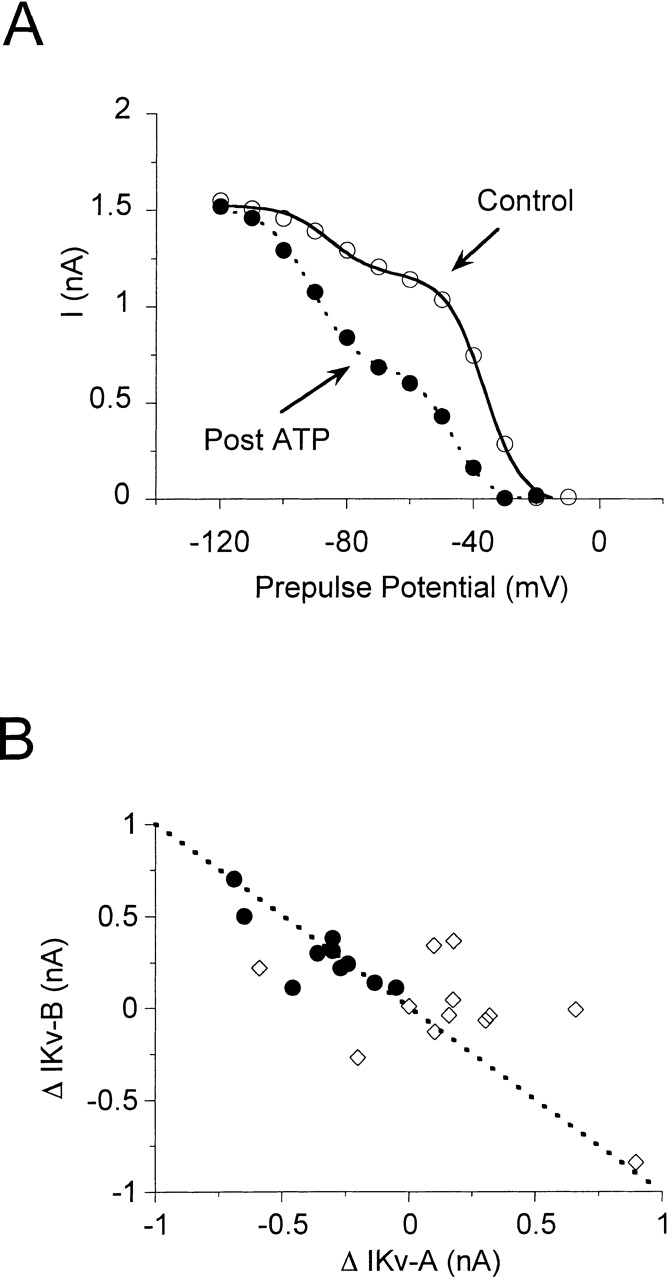
ATP may convert IKv-A into IKv-B. (A) Steady state inactivation before (○) and after (•) exposure to 350 nM ATP in a whole-cell experiment. Curves are the sum of two Boltzmann relations (Eq. 2) fit to the data. Before ATP (solid line), I max for IKv-A was 1,200 pA and for IKv-B was 360 pA. IKv-A E 1/2 = −36 mV and IKv-B E 1/2 = −85 mV, k = −6 mV for both components. After ATP (dotted line), I max for IKv-A was 680 pA and for IKv-B was 840 pA. IKv-A E 1/2 = −47 mV and IKv-B E 1/2 = −91 mV, k = −6 mV for both current components. (B) Correlation between ATP induced IKv-A decrease and IKv-B increase in whole-cell (•) and perforated-patch (⋄) experiments. The dashed line shows the relation expected if the decrease in IKv-A was equal to the increase in IKv-B. Only those cells that had two clearly identifiable current components after ATP were chosen for analysis.
Purinergic Signaling Pathways Involved in IKv-A Modulation
The potency order for purinergic agonist effects on IKv-A is consistent with activation of a P2 purinergic receptor, although our experiments cannot unequivocally distinguish the particular P2 receptor involved. The minimum purine nucleotide concentration sufficient to decrease the peak amplitude of IKv-A in whole-cell experiments was used to assess agonist potency. The agonist potency order found was: 2-MeSATP (0.05–0.1 μM, n = 3) ≥ ATP (0.02–1 μM, n = 78) > ADP (10–100 μM, n = 5) ≥ α,β MeATP (100 μM, n = 3). Bath application of adenosine (100–1,000 μM, n = 3), UTP (40 μM, n = 4), or the P2X7 agonist BzATP (2′-3′-O-[4-benzoylbenzoyl]-ATP) (Lee and Pappone, unpublished observation) did not decrease the peak amplitude of IKv-A. Thus, the agonist sensitivity is consistent with modulation by P2Y1 or any of several P2X receptors, but not the P2X7 receptor (Rassendren et al., 1997). The concentration of ATP required to affect IKv-A depended on the recording configuration. In perforated-patch recordings, 5–10-fold higher ATP concentrations (1–5 μM, n = 21) were required compared with whole-cell experiments, and ATP had to be applied two to three times to cause similar decreases in IKv-A amplitude.
The P2 receptor signaling of IKv modulation has unusual properties. P2Y1 receptors normally act through G proteins, but the P2 receptor-mediated decrease in IKv-A in whole-cell recordings was not altered by standard manipulations of G protein function. Internal exposure to 1 mM GTPγS (guanosine 5′-O-[3-thiotriphosphate]; n = 6), AlF4, GDPβS (guanosine 5′-O-[2-thiodiphosphate]), pretreatment with pertussis toxin, or ATP-free solutions did not affect IKv-A or its response to externally applied ATP (Lee and Pappone, manuscript submitted for publication). P2X receptors usually act as ion channels and can trigger intracellular signals by carrying Ca2+ influx. However, in whole-cell experiments where extracellular Ca2+ was removed and intracellular Ca2+ was buffered with EGTA to <20 nM (n = 6), ATP stimulated IKv-A decreases similar to those seen when external Ca2+ was present and internal Ca2+ was unbuffered (n = 10). Thus, the signaling pathway does not fit nicely into either the G protein– linked P2Y or the channel-forming P2X family of P2 receptor.
Activation of membrane receptors often initiates phosphorylation, phospholipid degradation, or alters cytoskeletal function, but manipulations to these pathways failed to mimic or affect the ATP-stimulated decrease in IKv-A in whole-cell recordings. 10-fold lower ATP concentrations were effective in decreasing IKv-A in whole-cell as compared with perforated-patch experiments, whether or not the internal solution contained ATP. Activation of protein kinase A with 1 mM 8-bromo-cAMP (n = 3) or 5 μM forskolin (n = 4) in perforated-patch recordings, or protein kinase C with 1.6 nM PMA (n = 13) in whole-cell experiments did not decrease IKv-A amplitude. Induction of nitric oxide production with Na-nitroprusside or a pipette solution containing cGMP (Lee and Pappone, unpublished observations) were also ineffective. In whole-cell recordings, the phospholipase products phosphatidic acid (Lee and Pappone, unpublished observation) or 1–100 μM arachidonic acid (n = 6) failed to mimic the ATP-induced decrease in IKv amplitude. Altering cytoskeletal function by pretreatment with cytochalasin or phalloidin (Lee and Pappone, unpublished observations) also did not affect the ATP-mediated decrease in IKv in whole-cell recordings. While negative results are not conclusive, the inadequacy of these many agents in affecting IKv modulation by ATP suggests that the signaling may occur through an unusual pathway.
discussion
Our results demonstrate that P2 receptor stimulation modulates both voltage-gated K+ current components, IKv-A and IKv-B, present in rat brown adipocytes, as summarized in Table IV. Extracellular ATP causes negative shifts in the voltage dependence of inactivation and activation of IKv-A, the component activated by membrane depolarizations in the physiological range. ATP also seems to convert IKv-A into IKv-B, the component that is inactive under normal conditions. These effects of ATP on voltage-gated K+ current gating are large, consistent, irreversible, and activated by nanomolar concentrations of ATP in whole-cell recordings. In perforated-patch recordings, ATP causes qualitatively similar changes in IKv-A and IKv-B, but the effects are smaller, more variable, and require micromolar ATP. The characteristics of the ATP response in perforated-patch recordings are such that in vivo ATP could promote or reduce activation of IKv by membrane depolarization, depending on the strength and frequency of the stimulation.
Table IV.
Summary of ATP Effects on IKv
| Whole cell | Perforated patch | |||
|---|---|---|---|---|
| Voltage dependence | ||||
| IKv-A Inactivation | Large negative shift | Small negative shift | ||
| Activation | Large negative shift | Small negative shift | ||
| IKv-B Inactivation | No effect | No effect | ||
| Percent IKv-A | Decrease | Increase | ||
| IKv at E Cl- (−20 mV) | Decrease | Increase or decrease |
See text for details.
Possible Mechanism of IKv Modulation
ATP causes both a hyperpolarizing shift in IKv-A voltage dependence, without a change in steepness, as well as an apparent conversion of IKv-A into IKv-B. ATP causes both the conductance–voltage relation and voltage dependence of inactivation for IKv-A to move continuously along the voltage axis, with the extent of the negative shift dependent on the stimulus strength. ATP also causes the amounts of IKv-A and IKv-B to change without producing discernible intermediate components. If a single process were responsible for the hyperpolarizing shift in IKv-A inactivation and IKv interconversion, then the hyperpolarizing shift in inactivation would be the result of a conversion of IKv-A to IKv-B. The expectation would be that the voltage dependence of IKv-A would not change as the current interconverted. Instead, the data show that the hyperpolarizing shifts in the voltage dependence of IKv-A can be graded and accompanied with significant current interconversion (Figs. 4 and 8), indicating that ATP modulates the hyperpolarizing shift in IKv-A and the interconversion through different processes.
The continuous hyperpolarizing shift in the voltage dependence of IKv-A inactivation without any change in slope cannot be explained by a mechanism where ATP modulates only a few sites. A simple model, with four modulatory sites, each causing a −20-mV shift in inactivation voltage dependence, predicts that Kv current components with intermediate voltage dependence would be seen, and that the slope of voltage dependence would flatten. Neither occurred, indicating that the process controlling the IKv-A inactivation shift by ATP involves more than a few modulatory sites and/ or is quite complex. It is also unlikely that the hyperpolarizing shift in voltage dependence can be explained by ATP-dependent phosphorylation or dephosphorylation of the channel protein, since the hyperpolarizing shifts in IKv gating are similar with or without ATP in the pipette. Possibly the ATP-induced hyperpolarizing shift in IKv-A voltage dependence arises from changes in channel interactions with the cytoskeleton (Johnson et al., 1997), changes in the membrane lipid composition (Ji et al., 1993), or altered association of the channel with regulatory subunits (Jan and Jan, 1997). Cytoskeletal elements can modulate Ca2+ currents through phosphorylation-dependent pathways (Johnson et al., 1997) and fatty acids can bind to and affect the function of the cytoskeleton (Packham et al., 1991; Exton, 1997). ATP dramatically increases brown adipocyte membrane trafficking, resulting in up to a doubling of membrane capacitance (Pappone and Lee, 1996). The incorporation of new membrane may cause changes in the plasma membrane lipid composition, involve remodeling of the cytoskeleton, or insert subunits that modify IKv gating behavior. Increases in membrane trafficking could also change the number and type of IKv channels present in the membrane. ATP does not alter total IKv in whole-cell preparations but does in perforated-patch recordings. The increase in total IKv could be explained by an increase in the number of Kv channels, since exocytosis is more robust in perforated-patch than whole-cell recordings (Lee and Pappone, manuscript submitted for publication). P2 receptor stimulation can also activate phospholipases in other cell types (Boyer et al., 1989; el-Moatassim and Dubyak, 1992; Wang et al., 1992; Humphreys and Dubyak, 1996) and the generated fatty acids can cause hyperpolarizing shifts in the voltage dependence of voltage-sensitive K+ current gating (Honore et al., 1994).
In contrast to the shift in voltage dependence, the apparent conversion of IKv-A into IKv-B by ATP could be explained by a mechanism involving only a single site. Since the conversion is more prominent in whole-cell than in perforated-patch experiments, the conversion from IKv-A to IKv-B may depend on immobile factors while the conversion of IKv-B to IKv-A may depend on soluble components. One possibility is that purinergic stimulation may lead to a change in the gating mode of IKv-A by modifying interactions with regulatory β subunits, as seen in Na+ channels (Ji et al., 1994) and Maxi K+ channels (reviewed in Jan and Jan, 1997).
Potential Signaling Pathways
The potency order of different purinergic receptor agonists in decreasing IKv-A is consistent with stimulation of any of several P2 receptor types (Barnard et al., 1997; Burnstock, 1997). Brown adipocytes have several different P2 receptors (Lee and Pappone, manuscript submitted for publication) that cause increases in cytosolic Ca2+, membrane turnover, and conductance (Pappone and Lee, 1996; Lee and Pappone, 1997a). The increases in brown adipocyte cytosolic Ca2+ by ATP are consistent with G protein activation of phospholipase C, while the increases in membrane trafficking are resistant to G protein manipulations (Pappone and Lee, 1996; Lee and Pappone, 1997a; Lee and Pappone, manuscript submitted for publication). The purinergic receptor(s) active in modulating IKv show similar insensitivity to activation or inhibition of G protein function and to the absence of cytosolic ATP. The agonist sensitivity of IKv modulation is consistent with mediation by a P2Y1 receptor or any of several of the P2X receptors (Barnard et al., 1997; Burnstock, 1997). Although P2Y receptor actions usually involve G proteins, a G protein–independent pathway has been reported for heterologously expressed P2Y1 receptors (O'Grady et al., 1996). Signaling via a P2X receptor seems less likely. P2X receptors usually form ligand gated cation channels (Bean, 1992; Surprenant et al., 1995), but the changes in IKv function by ATP were not accompanied by increases in membrane conductance in whole-cell experiments or in perforated-patch recordings with Ca2+-sensitive conductances blocked. Nonionotropic mechanisms have been described for the P2X7 receptor (el-Moatassim and Dubyak, 1992; Humphreys and Dubyak, 1996; Zou et al., 1997). However, the potent P2X7 receptor agonist BzATP (Rassendren et al., 1997) is ineffective in modulating IKv in brown adipocytes (Lee and Pappone, unpublished observation). Thus, we cannot yet draw any conclusions as to which P2 receptor regulates IKv.
Our whole-cell results show that neither the ATP-induced shift in IKv-A voltage dependence nor the conversion of IKv-A into IKv-B require soluble factors, suggesting the signaling components for these effects are immobile. However, in perforated-patch recordings, the shifts in IKv voltage dependence are attenuated, suggesting that mobile components are involved in signaling the recovery reactions. A similar lack of Ca2+ or cytosolic ATP dependence of P2 receptor modulation of ionic currents has been observed previously (Qu et al., 1993a; Thomas and Hume, 1993; Matsuura and Ehara, 1996; Matsuura et al., 1996a). P2 receptor activation of muscarinic K+ currents in heart (Matsuura et al., 1996a) and K+ currents in skeletal muscle (Thomas and Hume, 1993) involve membrane delimited pathways. It will be interesting to determine whether new signaling pathways underlie the modulation of brown fat IKv by P2 receptor activation.
Possible Functions of IKv Modulation
Voltage-gated K currents are important for regulating cell proliferation, volume regulation, and Ca2+ signaling in a variety of nonexcitable cells (Nilius and Wohlrab, 1992; Deutsch and Chen, 1993; Lin et al., 1993). In brown adipocytes, IKv is necessary for proliferation of cultured cells (Pappone and Ortiz-Miranda, 1993), but not for norepinephrine-induced thermogenesis (Pappone and Lucero, 1992), suggesting that IKv may have a specific functional role in brown adipocyte growth and development. Proliferation of brown adipocytes is promoted by P2 receptor stimulation (Barsoum et al., 1998; Wilson, Barsoum, Wilson, and Pappone, manuscript submitted for publication), suggesting that modulation of IKv by ATP may be linked to the proliferative responses. As occurs in other cell types, IKv in brown adipocytes could be linked to mitogenesis or differentiation through volume regulatory pathways (Deutsch, 1990), or Ca2+ signaling (Lin et al., 1993; Verheugen et al., 1997). Thus, ATP modulation of IKv gating may regulate either cell volume responses or agonist-activated extracellular Ca2+ entry in brown adipocytes, and these changes in cell volume or cytosolic Ca2+ could be involved in the ATP effects on cell proliferation.
Potential Sources of ATP
There are several potential sources of purine nucleotides in brown fat, all of which may be activated with sympathetic stimulation. During periods of high sympathetic nerve activity, as occurs with cold exposure or overfeeding, ATP may be released with norepinephrine (Lagercrantz, 1976; Ellis and Burnstock, 1989; Westfall et al., 1990). Mast cells are abundant in brown fat tissue and possibly also release ATP (Rothwell et al., 1984; Osipchuk and Cahalan, 1992; Desautels et al., 1994). Lastly, sympathetic activation of metabolism or subsequent hypoxia may cause brown fat cells themselves to release ATP, as has been described for hepatocytes and epithelial cells (Abraham et al., 1993; Reisin et al., 1994; Prat et al., 1996; Wang et al., 1996). Extracellular ATP levels in brown fat are not known, but our results suggest that nanomolar concentrations of ATP could evoke significant responses.
Relation to White Fat
Recent findings indicate that brown adipocytes and white adipocytes have very similar functions, gene expression, and cell signaling systems. Both cell types can store, release, or waste metabolic energy. The main difference between the tissues is whether energy storage or wasting predominates (reviewed in Himms-Hagen, 1992; Lonnroth and Smith, 1992). The conductance properties and P2 receptor responses of white adipocytes have not been as well characterized as those of brown fat cells. However, to the extent that they are known, white fat resembles brown fat. Similar IKv is present in white fat, and ATP causes similar changes in IKv and activates membrane exocytosis as in brown adipocytes (Lee and Pappone, 1997b). Thus, purinergic stimulation may also regulate the function of white adipocytes.
Summary
We find that P2 receptor activation modulates the amount and voltage dependence of activatable voltage-gated K+ currents in brown adipocytes. Extracellular ATP is likely to be increased with sympathetic stimulation of brown fat and could either augment or reduce the available IKv, depending on the stimulus strength and duration. Since IKv is known to be essential for brown adipocyte proliferation, modulation of IKv by extracellular ATP could be an important component of sympathetic regulation of adipocyte number. P2 receptors and K+ channels could prove to be effective sites for pharmacological manipulation of adipocyte growth and development.
Acknowledgments
The authors thank Dr. Sherwin Lee for helpful discussions and manuscript review, Drs. Martin Wilson and Martha O'Donnell for critical review of the manuscript, Ken Kunisaki, Jeff Pham, Joel Isaac Barthelow, and Christina Stroup for culturing cells, and Jock Hamilton for technical assistance.
This work was supported by National Institutes of Health grant GM-44840.
Abbreviations used in this paper
- HP
holding potential
- IKv
voltage-dependent K+ current
Footnotes
Dr. Wilson's current address is Department of Physiology & Cell Biology/351, University of Nevada School of Medicine, Reno, NV 89557.
references
- Abraham EH, Prat AG, Gerweck L, Seneveratne T, Arceci RJ, Kramer R, Guidotti G, Cantiello HF. The multidrug resistance (mdr1) gene product functions as an ATP channel. Proc Natl Acad Sci USA. 1993;90:312–316. doi: 10.1073/pnas.90.1.312. [DOI] [PMC free article] [PubMed] [Google Scholar]
- Armstrong CM, Bezanilla F. Charge movement associated with the opening and closing of the activation gates of the Na channels. J Gen Physiol. 1974;63:533–552. doi: 10.1085/jgp.63.5.533. [DOI] [PMC free article] [PubMed] [Google Scholar]
- Barnard EA, Simon J, Webb TE. Nucleotide receptors in the nervous system: an abundant component using diverse transduction mechanisms. Mol Neurobiol. 1997;15:103–129. doi: 10.1007/BF02740631. [DOI] [PubMed] [Google Scholar]
- Barsoum M, Wilson S, Wilson B, Pappone P. Purine nucleotides modulate pre-brown adipocyte proliferation. FASEB J. 1998;12:A636. doi: 10.1046/j.1365-2184.1999.32230131.x. . (Abstr.) [DOI] [PMC free article] [PubMed] [Google Scholar]
- Bean BP. Pharmacology and electrophysiology of ATP-activated ion channels. Trends Pharmacol Sci. 1992;13:87–90. doi: 10.1016/0165-6147(92)90032-2. [DOI] [PubMed] [Google Scholar]
- Boyer JL, Downes CP, Harden TK. Kinetics of activation of phospholipase C by P2Y purinergic receptor agonists and guanine nucleotides. J Biol Chem. 1989;264:884–890. [PubMed] [Google Scholar]
- Bronnikov G, Houstek J, Nedergaard J. Beta-adrenergic, cAMP-mediated stimulation of proliferation of brown fat cells in primary culture. Mediation via beta 1 but not via beta 3 adrenoceptors. J Biol Chem. 1992;267:2006–2013. [PubMed] [Google Scholar]
- Burnstock G. The past, present and future of purine nucleotides as signalling molecules. Neuropharmacology. 1997;36:1127–1139. doi: 10.1016/s0028-3908(97)00125-1. [DOI] [PubMed] [Google Scholar]
- Cahalan MD, Lewis RS. Role of potassium and chloride channels in volume regulation by T lymphocytes. Soc Gen Physiol Ser. 1988;43:281–301. [PubMed] [Google Scholar]
- Cole KS, Moore JW. Potassium ion current in the squid giant axon: dynamic characteristic. Biophys J. 1960;1:1–14. doi: 10.1016/s0006-3495(60)86871-3. [DOI] [PMC free article] [PubMed] [Google Scholar]
- Dasso L, Connolley E, Nedergaard J. α1-Adrenergic stimulation of Cl−efflux in isolated brown adipocytes. FEBS Lett. 1990;262:25–28. doi: 10.1016/0014-5793(90)80144-8. [DOI] [PubMed] [Google Scholar]
- Dave S, Mogul DJ. ATP receptor activation potentiates a voltage-dependent Ca channel in hippocampal neurons. Brain Res. 1996;715:208–216. doi: 10.1016/0006-8993(95)01588-4. [DOI] [PubMed] [Google Scholar]
- Desautels M, Wollin A, Halvorson I, Muralidhara DV, Thornhill J. Role of mast cell histamine in brown adipose tissue thermogenic response to VMH stimulation. Am J Physiol. 1994;266:R831–R837. doi: 10.1152/ajpregu.1994.266.3.R831. [DOI] [PubMed] [Google Scholar]
- Deutsch C. K+channels and mitogenesis. Prog Clin Biol Res. 1990;334:251–271. [PubMed] [Google Scholar]
- Deutsch C, Chen LQ. Heterologous expression of specific K+channels in T lymphocytes: functional consequences for volume regulation. Proc Natl Acad Sci USA. 1993;90:10036–10040. doi: 10.1073/pnas.90.21.10036. [DOI] [PMC free article] [PubMed] [Google Scholar]
- el-Moatassim C, Dubyak GR. A novel pathway for the activation of phospholipase D by P2z purinergic receptors in BAC1.2F5 macrophages. J Biol Chem. 1992;267:23664–23673. [PubMed] [Google Scholar]
- Ellis JL, Burnstock G. Angiotensin neuromodulation of adrenergic and purinergic co-transmission in the guinea-pig vas deferens. Br J Pharmacol. 1989;97:1157–1164. doi: 10.1111/j.1476-5381.1989.tb12574.x. [DOI] [PMC free article] [PubMed] [Google Scholar]
- Exton JH. Phospholipase D: enzymology, mechanisms of regulation, and function. Physiol Rev. 1997;77:303–320. doi: 10.1152/physrev.1997.77.2.303. [DOI] [PubMed] [Google Scholar]
- Felipe A, Snyders DJ, Deal KK, Tamkun MM. Influence of cloned voltage-gated K+ channel expression on alanine transport, Rb+uptake, and cell volume. Am J Physiol. 1993;265:C1230–C1238. doi: 10.1152/ajpcell.1993.265.5.C1230. [DOI] [PubMed] [Google Scholar]
- Geloen A, Collet AJ, Guay G, Bukowiecki LJ. Beta-adrenergic stimulation of brown adipocyte proliferation. Am J Physiol. 1988;254:C175–C182. doi: 10.1152/ajpcell.1988.254.1.C175. [DOI] [PubMed] [Google Scholar]
- Girardier L, Schneider-Picard G. Alpha and beta-adrenergic mediation of membrane potential changes and metabolism in rat brown adipose tissue. J Physiol (Lond) 1983;335:629–641. doi: 10.1113/jphysiol.1983.sp014555. [DOI] [PMC free article] [PubMed] [Google Scholar]
- Graf J, Haussinger D. Ion transport in hepatocytes: mechanisms and correlations to cell volume, hormone actions and metabolism. J Hepatol. 1996;24:53–77. [PubMed] [Google Scholar]
- Hamill OP, Marty A, Neher E, Sakmann B, Sigworth FJ. Improved patch-clamp techniques for high-resolution current recording from cells and cell-free membrane patches. Pflügers Arch. 1981;391:85–100. doi: 10.1007/BF00656997. [DOI] [PubMed] [Google Scholar]
- Himms-Hagen J. Brown adipose tissue thermogenesis and obesity. Prog Lipid Res. 1989;28:67–115. doi: 10.1016/0163-7827(89)90009-x. [DOI] [PubMed] [Google Scholar]
- Himms-Hagen, J. 1992. Brown adipose tissue metabolism. In Obesity. P. Björntorp and B.N. Brodoff, editors. J.B. Lippincott Co., Philadelphia. 15–34.
- Honore E, Barhanin J, Attali B, Lesage F, Lazdunski M. External blockade of the major cardiac delayed-rectifier K+channel (Kv1.5) by polyunsaturated fatty acids. Proc Natl Acad Sci USA. 1994;91:1937–1941. doi: 10.1073/pnas.91.5.1937. [DOI] [PMC free article] [PubMed] [Google Scholar]
- Horn R, Marty A. Muscarinic activation of ionic currents measured by a new whole-cell recording method. J Gen Physiol. 1988;92:145–159. doi: 10.1085/jgp.92.2.145. [DOI] [PMC free article] [PubMed] [Google Scholar]
- Horowitz JM, Hamilton J, Horwitz BA. Catecholamine-induced changes in transmembrane potential and temperature in normal and dystrophic hamster brown adipose tissue. Life Sci. 1983;32:725–731. doi: 10.1016/0024-3205(83)90305-3. [DOI] [PubMed] [Google Scholar]
- Horwitz, B., J.S. Hamilton, M.T. Lucero, and P.A. Pappone. 1989. Catecholamine-induced changes in activated brown adipocytes. In Colloque Inserm (National Institute of Health and Medical Research) Colloquium, Vol. 193. Living in the Cold); Second International Symposium, Le Hohwald, France, April 23–29, 1989. A. Malan and B. Canguilhem, editors. John Libbey Eurotext. Paris. 377–386.
- Humphreys BD, Dubyak GR. Induction of the P2z/ P2X7 nucleotide receptor and associated phospholipase D activity by lipopolysaccharide and IFN-gamma in the human THP-1 monocytic cell line. J Immunol. 1996;157:5627–5637. [PubMed] [Google Scholar]
- Jan LY, Jan YN. Ways and means for left shifts in the MaxiK channel. Proc Natl Acad Sci USA. 1997;94:13383–13385. doi: 10.1073/pnas.94.25.13383. [DOI] [PMC free article] [PubMed] [Google Scholar]
- Ji S, Sun W, George AL, Jr, Horn R, Barchi RL. Voltage-dependent regulation of modal gating in the rat SkM1 sodium channel expressed in Xenopusoocytes. J Gen Physiol. 1994;104:625–643. doi: 10.1085/jgp.104.4.625. [DOI] [PMC free article] [PubMed] [Google Scholar]
- Ji S, Weiss JN, Langer GA. Modulation of voltage-dependent sodium and potassium currents by charged amphiphiles in cardiac ventricular myocytes. Effects via modification of surface potential. J Gen Physiol. 1993;101:355–375. doi: 10.1085/jgp.101.3.355. [DOI] [PMC free article] [PubMed] [Google Scholar]
- Johnson BD, Brousal JP, Peterson BZ, Gallombardo PA, Hockerman GH, Lai Y, Scheuer T, Catterall WA. Modulation of the cloned skeletal muscle L-type Ca2+channel by anchored cAMP-dependent protein kinase. J Neurosci. 1997;17:1243–1255. doi: 10.1523/JNEUROSCI.17-04-01243.1997. [DOI] [PMC free article] [PubMed] [Google Scholar]
- Lagercrantz H. On the composition and function of large dense cored vesicles in sympathetic nerves. Neuroscience. 1976;1:81–92. doi: 10.1016/0306-4522(76)90002-6. [DOI] [PubMed] [Google Scholar]
- Lee SC, Nuccitelli R, Pappone PA. Adrenergically activated Ca2+ increases in brown fat cells: effects of Ca2+, K+, and K channel block. Am J Physiol. 1993;264:C217–C228. doi: 10.1152/ajpcell.1993.264.1.C217. [DOI] [PubMed] [Google Scholar]
- Lee SC, Pappone PA. Effects of P2 purinergic receptor stimulation in brown adipocytes. Am J Physiol. 1997a;273:C679–C686. doi: 10.1152/ajpcell.1997.273.2.C679. [DOI] [PubMed] [Google Scholar]
- Lee SC, Pappone PA. Membrane responses to extracellular ATP in rat isolated white adipocytes. Pflügers Arch. 1997b;434:422–428. doi: 10.1007/s004240050416. [DOI] [PubMed] [Google Scholar]
- Lin CS, Boltz RC, Blake JT, Nguyen M, Talento A, Fischer PA, Springer MS, Sigal NH, Slaughter RS, Garcia ML, et al. Voltage-gated potassium channels regulate calcium-dependent pathways involved in human T lymphocyte activation. J Exp Med. 1993;177:637–645. doi: 10.1084/jem.177.3.637. [DOI] [PMC free article] [PubMed] [Google Scholar]
- Lonnroth, P., and U. Smith. 1992. Intermediary metabolism with an emphasis on lipid metabolism, adipose tissue, and fat cell metabolism: a review. In Obesity. P. Björntorp and B.N. Brodoff, editors. J.B. Lippincott Co., Philadelphia. 3–14.
- Lucero MT, Pappone PA. Voltage-gated potassium channels in brown fat cells. J Gen Physiol. 1989;93:451–472. doi: 10.1085/jgp.93.3.451. [DOI] [PMC free article] [PubMed] [Google Scholar]
- Lucero MT, Pappone PA. Membrane responses to norepinephrine in cultured brown fat cells. J Gen Physiol. 1990;95:523–544. doi: 10.1085/jgp.95.3.523. [DOI] [PMC free article] [PubMed] [Google Scholar]
- Matsuura H, Ehara T. Modulation of the muscarinic K+channel by P2-purinoceptors in guinea-pig atrial myocytes. J Physiol (Lond) 1996;497:379–393. doi: 10.1113/jphysiol.1996.sp021775. [DOI] [PMC free article] [PubMed] [Google Scholar]
- Matsuura H, Ehara T. Selective enhancement of the slow component of delayed rectifier K+current in guinea-pig atrial cells by external ATP. J Physiol (Lond) 1997;503:45–54. doi: 10.1111/j.1469-7793.1997.045bi.x. [DOI] [PMC free article] [PubMed] [Google Scholar]
- Matsuura H, Sakaguchi M, Tsuruhara Y, Ehara T. Activation of the muscarinic K+channel by P2-purinoceptors via pertussis toxin-sensitive G proteins in guinea-pig atrial cells. J Physiol (Lond) 1996a;490:659–671. doi: 10.1113/jphysiol.1996.sp021175. [DOI] [PMC free article] [PubMed] [Google Scholar]
- Matsuura H, Tsuruhara Y, Sakaguchi M, Ehara T. Enhancement of delayed rectifier K+current by P2-purinoceptor stimulation in guinea-pig atrial cells. J Physiol (Lond) 1996b;490:647–658. doi: 10.1113/jphysiol.1996.sp021174. [DOI] [PMC free article] [PubMed] [Google Scholar]
- Nakazawa K, Inoue K. ATP reduces voltage-activated K+current in cultured rat hippocampal neurons. Pflügers Arch. 1994;429:143–145. doi: 10.1007/BF02584042. [DOI] [PubMed] [Google Scholar]
- Nedergaard J, Lindberg O. The brown fat cell. Int Rev Cytol. 1982;74:187–286. doi: 10.1016/s0074-7696(08)61173-0. [DOI] [PubMed] [Google Scholar]
- Nilius B, Wohlrab W. Potassium channels and regulation of proliferation of human melanoma cells. J Physiol (Lond) 1992;445:537–548. doi: 10.1113/jphysiol.1992.sp018938. [DOI] [PMC free article] [PubMed] [Google Scholar]
- O'Grady SM, Elmquist E, Filtz TM, Nicholas RA, Harden TK. A guanine nucleotide-independent inwardly rectifying cation permeability is associated with P2Y1 receptor expression in Xenopusoocytes. J Biol Chem. 1996;271:29080–29087. doi: 10.1074/jbc.271.46.29080. [DOI] [PubMed] [Google Scholar]
- Osipchuk Y, Cahalan M. Cell-to-cell spread of calcium signals mediated by ATP receptors in mast cells. Nature. 1992;359:241–244. doi: 10.1038/359241a0. [DOI] [PubMed] [Google Scholar]
- Packham MA, Guccione MA, Bryant NL, Livne A. Incorporation of lipids labeled with various fatty acids into the cytoskeleton of aggregating platelets. Lipids. 1991;26:485–491. doi: 10.1007/BF02536590. [DOI] [PubMed] [Google Scholar]
- Pappone PA, Lee SC. α-Adrenergic stimulation activates a calcium-sensitive chloride current in brown fat cells. J Gen Physiol. 1995;106:231–258. doi: 10.1085/jgp.106.2.231. [DOI] [PMC free article] [PubMed] [Google Scholar]
- Pappone PA, Lee SC. Purinergic receptor stimulation increases membrane trafficking in brown adipocytes. J Gen Physiol. 1996;108:393–404. doi: 10.1085/jgp.108.5.393. [DOI] [PMC free article] [PubMed] [Google Scholar]
- Pappone PA, Lucero MT. Potassium channel block does not affect metabolic responses of brown fat cells. Am J Physiol. 1992;262:C678–C681. doi: 10.1152/ajpcell.1992.262.3.C678. [DOI] [PubMed] [Google Scholar]
- Pappone PA, Ortiz-Miranda SI. Blockers of voltage-gated K channels inhibit proliferation of cultured brown fat cells. Am J Physiol. 1993;264:C1014–C1019. doi: 10.1152/ajpcell.1993.264.4.C1014. [DOI] [PubMed] [Google Scholar]
- Prat AG, Reisin IL, Ausiello DA, Cantiello HF. Cellular ATP release by the cystic fibrosis transmembrane conductance regulator. Am J Physiol. 1996;270:C538–C545. doi: 10.1152/ajpcell.1996.270.2.C538. [DOI] [PubMed] [Google Scholar]
- Qu Y, Campbell DL, Strauss HC. Modulation of L-type Ca2+current by extracellular ATP in ferret isolated right ventricular myocytes. J Physiol (Lond) 1993a;471:295–317. doi: 10.1113/jphysiol.1993.sp019902. [DOI] [PMC free article] [PubMed] [Google Scholar]
- Qu Y, Campbell DL, Whorton AR, Strauss HC. Modulation of basal L-type Ca2+current by adenosine in ferret isolated right ventricular myocytes. J Physiol (Lond) 1993b;471:269–293. doi: 10.1113/jphysiol.1993.sp019901. [DOI] [PMC free article] [PubMed] [Google Scholar]
- Rassendren F, Buell GN, Virginio C, Collo G, North RA, Surprenant A. The permeabilizing ATP receptor, P2X7. Cloning and expression of a human cDNA. J Biol Chem. 1997;272:5482–5486. doi: 10.1074/jbc.272.9.5482. [DOI] [PubMed] [Google Scholar]
- Reisin IL, Prat AG, Abraham EH, Amara JF, Gregory RJ, Ausiello DA, Cantiello HF. The cystic fibrosis transmembrane conductance regulator is a dual ATP and chloride channel. J Biol Chem. 1994;269:20584–20591. [PubMed] [Google Scholar]
- Rothwell NJ, Stock MJ, Wyllie MG. Effects of histamine antagonists on noradrenaline-stimulated blood flow and oxygen consumption of brown adipose tissue in the rat. Pflügers Arch. 1984;402:325–329. doi: 10.1007/BF00585518. [DOI] [PubMed] [Google Scholar]
- Russ U, Ringer T, Siemen D. A voltage-dependent and a voltage-independent potassium channel in brown adipocytes of the rat. Biochim Biophys Acta. 1993;1153:249–256. doi: 10.1016/0005-2736(93)90412-s. [DOI] [PubMed] [Google Scholar]
- Strange, K. 1994. Cellular and molecular physiology of cell volume regulation. CRC Press, Boca Raton, FL. 400 pp.
- Surprenant A, Buell G, North RA. P2X receptors bring new structure to ligand-gated ion channels. Trends Neurosci. 1995;18:224–229. doi: 10.1016/0166-2236(95)93907-f. [DOI] [PubMed] [Google Scholar]
- Thomas SA, Hume RI. Single potassium channel currents activated by extracellular ATP in developing chick skeletal muscle: a role for second messengers. J Neurophysiol. 1993;69:1556–1566. doi: 10.1152/jn.1993.69.5.1556. [DOI] [PubMed] [Google Scholar]
- Verheugen JA, Le Deist F, Devignot V, Korn H. Enhancement of calcium signaling and proliferation responses in activated human T lymphocytes. Inhibitory effects of K+channel block by charybdotoxin depend on the T cell activation state. Cell Calc. 1997;21:1–17. doi: 10.1016/s0143-4160(97)90092-0. [DOI] [PubMed] [Google Scholar]
- Von zur Muhlen F, Gonska BD, Kreuzer H. Inhibition of the voltage-dependent calcium current by extracellular ATP in hamster ventricular cardiomyocytes. Am J Physiol. 1997;273:H250–H256. doi: 10.1152/ajpheart.1997.273.1.H250. [DOI] [PubMed] [Google Scholar]
- Wang DJ, Huang NN, Heppel LA. Extracellular ATP and ADP stimulate proliferation of porcine aortic smooth muscle cells. J Cell Physiol. 1992;153:221–233. doi: 10.1002/jcp.1041530202. [DOI] [PubMed] [Google Scholar]
- Wang Y, Roman R, Lidofsky SD, Fitz JG. Autocrine signaling through ATP release represents a novel mechanism for cell volume regulation. Proc Natl Acad Sci USA. 1996;93:12020–12025. doi: 10.1073/pnas.93.21.12020. [DOI] [PMC free article] [PubMed] [Google Scholar]
- Westfall DP, Sedaa KO, Shinozuka K, Bjur RA, Buxton IL. ATP as a cotransmitter. Ann NY Acad Sci. 1990;603:300–310. doi: 10.1111/j.1749-6632.1990.tb37681.x. [DOI] [PubMed] [Google Scholar]
- Wilson SM, Pappone PA. Purinergic modulation of a voltage gated potassium channel in rat brown adipocytes. Biophys J. 1996;70:A72. . (Abstr.) [Google Scholar]
- Yamashita H, Sato Y, Kizaki T, Oh S, Nagasawa J, Ohno H. Basic fibroblast growth factor (bFGF) contributes to the enlargement of brown adipose tissue during cold acclimation. Pflügers Arch. 1994;428:352–356. doi: 10.1007/BF00724518. [DOI] [PubMed] [Google Scholar]
- Zou H, Ugur M, Walsh JV, Singer JJ. Extracellular ATP increases the activity of a fatty acid- and stretch-activated K+channel: possible role for fatty acids as second messengers. Biophys J. 1997;72:A264. . (Abstr.) [Google Scholar]