

Abstract
OBJECTIVES
The goal of this study was to experimentally evaluate a novel noninvasive electrocardiographic imaging modality during intramural reentrant ventricular tachycardia (VT).
BACKGROUND
Myocardial infarction and subsequent remodeling produce abnormal electrophysiologic substrates capable of initiating and maintaining reentrant arrhythmias. Existing noninvasive electrocardiographic methods cannot characterize abnormal electrophysiologic substrates in the heart or the details of associated arrhythmias. A noninvasive method with such capabilities is needed to identify patients at risk of arrhythmias and to guide and evaluate therapy.
METHODS
A dog heart with a four-day-old infarction was suspended in a human shaped torso-tank. Measured body surface potentials were used to noninvasively compute epicardial potentials, electrograms and isochrones. Accuracy of reconstruction was evaluated by direct comparison to measured data. Reconstructions were performed during right atrial pacing and nine cycles of VT.
RESULTS
Noninvasively reconstructed potential maps, electrograms and isochrones identified: 1) the location of electrophysiologically abnormal infarct substrate; 2) the epicardial activation sequences during the VTs; 3) the locations of epicardial breakthrough sites; and 4) electrophysiologic evidence for activation of the Purkinje system and septum during the reentrant beats.
CONCLUSIONS
Electrocardiographic imaging can noninvasively reconstruct electrophysiologic information on the epicardium during VT with intramural reentry, provide information about the location of the intramural components of reentry and image abnormal electrophysiologic substrates associated with infarction.
Abnormal electrophysiologic substrates associated with myocardial infarction (MI) and subsequent remodeling are highly arrhythmogenic (1). Current noninvasive methods for assessing abnormal electrophysiologic substrates and arrhythmias rely on body surface electrocardiograms (ECG), which do not have the necessary spatial resolution to provide sufficient information about the substrate or arrhythmic activation sequence in the heart. Electrocardiographic imaging (ECGI) is a noninvasive functional imaging method for reconstructing electrophysiologic information on the surface of the heart from body surface measurements (2). Our previous studies (3,4) have demonstrated that ECGI can noninvasively locate epicardial sites of ectopic activation, reconstruct epicardial electrograms and isochrones and provide information on intramural myocardial activation. More recently, we used a combination of experimental and modeling approaches to demonstrate the ability of ECGI to identify and locate abnormal electrophysiologic substrates associated with infarction (5) and to reconstruct the sequence of reentrant activation during ventricular tachycardia (VT) (6). In the previous studies (5,6), epicardial potentials were recorded from an open chest dog and were used to compute body surface potentials on a computer model of the human torso. These potentials, contaminated by signal noise and geometric errors in an effort to realistically simulate measured body surface data (5), were used as the input for ECGI reconstruction of epicardial information. Also, the reentry circuit during VT was epicardial, in the thin border zone of the infarct (6). This study advances the previous work in two important ways: 1) Epicardial and body surface potentials are measured simultaneously using an isolated dog heart suspended in a human torso-tank. Thus, measured (rather than computed) body surface potentials constitute the input data for ECGI (more closely representing the clinical situation), with the measured epicardial potentials serving as a gold standard for evaluating the ECGI performance. 2) The reentry circuit during VT is not limited to the epicardium and includes a major and essential intramural component, as typical for clinical VT associated with MI (1,7,8).
METHODS
The experimental protocol was approved by the University of Utah Institutional Care and Use Committee (Protocol 97-0007). The ECGI methodology was carefully validated using a human torso-shaped tank experimental setup, as previously described (3). The tank was molded from the torso of a 10-year-old boy, filled with electrolytic solution and contained an isolated dog heart (modified Langendorff preparation) suspended in the proper anatomic position. Potentials were recorded from 256 body surface electrodes, 256 electrodes on rods that projected from the body surface toward the heart and 490 electrodes in a nylon sock that was placed over the heart. The 184 rods at the heart level were pushed inward, placing the electrodes at their tips close to, but not touching, the epicardium (distance <1 cm), creating an effective epicardial envelope around the heart (3). A 1,024-amplifier mapping system simultaneously recorded unipolar potentials from the torso surface, epicardial surface and the epicardial envelope. As in previous studies (3,4,9), the recorded torso potentials provided the input for the noninvasive ECGI reconstruction of potentials on the epicardial envelope. These potentials were evaluated through direct comparison with potentials measured by electrodes at the 184-rod tips. The epicardial sock potentials were not used for ECGI reconstruction verification because the exact geometry of the sock and its electrodes could not be obtained. However, they were used to verify that the rod tip potentials reflected accurately the epicardial recordings.
The heart in the torso-tank contained a large MI surgically produced four days before the experiment through ligation of the left anterior descending coronary artery (LAD) just distal to the first diagonal branch, with two additional distant branches ligated to prevent collateral flow (10). Potentials were recorded in the torso-tank during right atrial (RA) pacing to simulate sinus rhythm and to characterize the extent and location of the infarction (5). Recordings were also made during several runs of VT induced through programmed stimulation. Upon termination of the study, the heart was embedded in Jeltrate, and the ventricles were cut parallel to the atrioventricular sulcus into approximately 8-mm thick slices that were incubated at 37°C for 5 to 7 min in buffered triphenyltetrazolium chloride (TTC) solution. The basal surface of each slice was photographed, with infarcted tissue showing as light brown. Ventricular tachycardia was successfully induced and reconstructions performed in two different isolated hearts in the torso-tank. Here we present detailed results from one heart in which reentry was not confined to an epicardial thin rim. In the second heart, reentry was completely epicardial, a morphology (10) that we have investigated previously in a model using epicardial data from an open chest dog (5,6).
Epicardial potentials were noninvasively reconstructed from the electrocardiographic torso potentials over the entire surface of the heart and throughout the cardiac cycle, using previously developed and validated ECGI mathematical methodology (3-6,9,11). Data during RA pacing and three consecutive reentry cycles of an intramural monomorphic VT are presented in detail as representative results. Reconstructions were also computed and evaluated for six additional reentrant cycles with slightly different morphologies. In addition to spatial epicardial potential maps, epicardial electrograms were reconstructed at 200 evenly distributed epicardial envelope sites (184 rod tip sites plus 16 sites added to create a uniform epicardial envelope) and were used to construct isochronal maps describing the sequence of epicardial activation during the arrhythmia. The accuracy of reconstructions was evaluated by direct comparison with data measured simultaneously on the epicardial envelope (a known gold standard). Activation times were determined as the time of maximum negative derivative (-dV/dtmax) in the epicardial electrograms (4). If the -dV/dtmax was smaller than 0.3 mV/ms for the measured data or 0.2 mV/ms for the reconstructed data, then no local activation times were assigned for that site. The lower threshold for the reconstructed data was arrived at based on a 30% reduction in -dV/dtmax previously observed in ECGI reconstructed electrograms (6). Information from neighboring electrograms was used to edit activation times in a small number (<5%) of electrograms with multiple large negative derivatives.
RESULTS
Epicardial electrograms recorded and noninvasively reconstructed during RA pacing were evaluated to estimate the location and extent of the abnormal electrophysiologic substrate. Figure 1A shows estimates of the substrate location based on the presence of Q-wave electrograms. Regions with pure Q-wave electrograms are outlined with solid lines and regions with Q-wave electrograms containing superimposed sharp deflections are outlined with dashed lines. The estimates based on measured electrograms show the presence of infarcted substrate over a large portion of the left ventricle (LV) that contains two regions: 1) a region of pure Q-wave electrograms around and inferior to the LAD, indicating the presence of inexcitable tissue in the underlying septum and anterior wall; and 2) the adjoining regions with Q-wave electrograms containing sharp deflections, indicating the presence of inexcitable infarcted tissue (reflected in the Q-wave morphology) and islands of viable tissue that generate the sharp deflections reflecting local activation (5). Comparison of the measured and reconstructed regions (and the electrograms in these regions) shows that ECGI correctly identifies the location and extent of the abnormal electrophysiologic substrate associated with the infarct. Note that the smoothing associated with ECGI reconstruction leads to a smaller region of Q-wave electrograms containing local deflections compared with the measured data. Electrograms recorded by unipolar epicardial-sock electrodes and rod-tip electrodes from approximately corresponding positions are presented in Figure 1B to verify that the rod tips record activity similar to the epicardial electrodes. Importantly, the unipolar rod electrodes faithfully record small sharp deflections where local activation of surviving myocardium occurs. They also reflect lack of excitation in pure Q-waves that correspond well to the sock recordings obtained in direct contact with the epicardium. Figure 2 shows a myocardial tissue slice approximately at the level of the horizontal dashed line in Figure 1 (top panel). The infarcted myocardium (light brown region) is clearly visible across the left anterolateral LV and septum. Measured and noninvasively reconstructed electrograms during RA pacing are shown for sites estimated to correspond with this tissue slice. The measured (red) and reconstructed (blue) electrograms at sites G to J show pure Q-wave morphologies, indicating the presence of transmural infarction at these locations. However, inspection of the stained tissue slice shows regions of noninfarcted tissue (red) below recording sites that show no local electrophysiologic activity, possibly indicating the presence of stunned or hibernating myocardium. Electrograms at the remaining sites around the heart show a typical morphology associated with electrograms recorded over viable myocardium during sinus rhythm. The time course and general morphologies of the noninvasively reconstructed electrograms resemble the directly measured ones, with attenuation of amplitudes in most cases.
Figure 1.

(A) Estimated location and extent of electrophysiologically abnormal substrate due to infarction. The epicardium is displayed in three partially overlapping views, viewed from the right posterolateral, anterior and left posterolateral aspects of the torso. The right ventricle (RV) and left ventricle (LV) are labeled. The left anterior descending coronary artery (LAD) and posterior descending coronary artery (PDC) are shown as thick black lines. Gray regions outlined by solid lines define regions with pure Q-wave electrograms during right atrial (RA) pacing. Gray regions outlined by dashed lines define regions with Q-wave electrograms containing superimposed sharp deflections indicating islands of local activation. Representative electrograms during RA pacing are shown on the heart to illustrate the electrogram morphologies in each region. The horizontal dashed black line marks the estimated level of the tissue slice presented in Figures 2 and 4. Top row shows measured data. Bottom row shows noninvasively reconstructed data. (B) Shows electrograms from approximately corresponding locations measured by epicardial-sock electrodes in direct contact with the epicardium (left) and by rod-tip electrodes on the epicardial envelope (right). Numbers correspond to the numbered locations on the heart views in (A).
Figure 2.
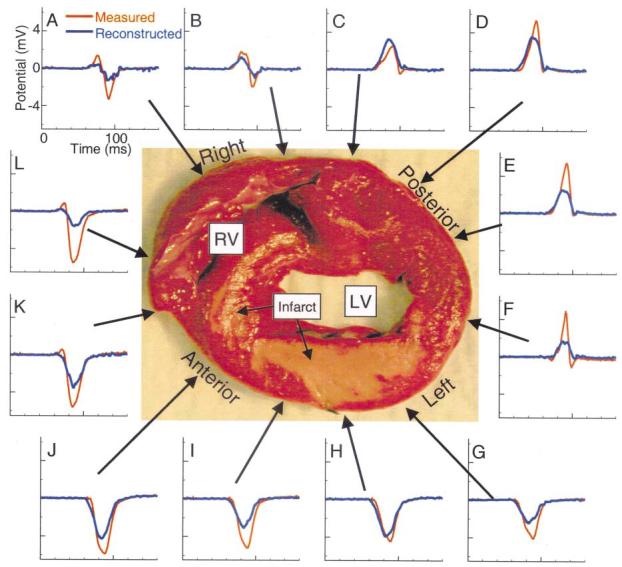
Epicardial electrograms during right atrial pacing. A stained tissue slice is shown to orient sites A to L, where epicardial electrograms were directly measured and noninvasively reconstructed. The anterior, left, posterior and right labels are in reference to the heart oriented in the torso. The locations of the right ventricle (RV), left ventricle (LV) and infarct (light brown) are indicated. Measured electrograms are plotted in red and noninvasively reconstructed electrograms in blue.
Nine different reentrant cycles were reconstructed. Accuracy of reconstruction was similar for all cycles, with the following average correlation coefficients between reconstructed and measured electrograms and epicardial potential maps: correlation coefficient (CC) (electrograms) = 0.90; CC (potential maps) = 0.82. Activation isochrones from three consecutive cycles of VT are shown in Figure 3. In cycle 1 (panel A), activation first appears as a broad wavefront originating from two epicardial breakthroughs that merge together on the anterior right ventricle (RV) aligned with the LAD. The initial wavefront forms two branches, with one propagating to the right across the RV and the other to the left towards the basal portion of the LV. As the RV wavefront approaches the posterior septum (approximately located below the posterior descending coronary artery), it slows (crowded isochrones, 50 to 90 ms). The two wavefronts collide over the left posterolateral LV (110 ms). Within 20 ms of their collision, a new wavefront emerges onto the RV from a single RV epicardial breakthrough site to begin cycle 2 (panel B), followed by cycle 3, both of which follow the same general pathway as cycle 1. Comparison of the noninvasively reconstructed and directly measured isochrones for all three cycles shows that ECGI correctly captures the epicardial activation sequence during VT, including the earliest activation sites of the epicardial component of the reentry circuit (epicardial breakthroughs), the crowding of isochrones associated with slowed conduction near the posterior septum and the wavefront collisions over the left posterolateral LV.
Figure 3.

Activation isochrones for three consecutive cycles of ventricular tachycardia (VT). Isochrones are presented for each cycle, with the color legend (time in ms) displayed below (earliest activation is dark blue). White arrows indicate direction of wavefront propagation. Regions where no activation times were assigned because of small magnitude maximum negative derivative are shown as gray. Electrocardiogram lead II is shown with vertical blue lines indicating the time frames displayed for each cycle. (A) Isochrones from VT cycle 1. Top row shows measured isochrones. Bottom row shows noninvasively reconstructed isochrones. (B) Isochrones from VT cycle 2. (C) Isochrones from VT cycle 3. LAD = left anterior descending coronary artery; PDC = posterior descending coronary artery.
Figure 4 shows epicardial electrograms around a cross-section during the VT of Figure 3A. The tissue slice and format are similar to Figure 2. Earliest epicardial activation occurs near site K (horizontal bars on the electrograms indicate local activation times), over the anterior RV near the septum. The electrograms at sites G to J, which showed pure Q-wave morphologies during RA pacing (Fig. 2), have a subthreshold -dV/dtmax indicating no local activation and are not assigned activation times during the VT. Epicardial sock electrograms (green) from sites corresponding to rod tip sites G to J verify that no local epicardial activity is observed over the infarcted LV. Analysis of the progression of activation times shows the wavefront propagating in a clockwise direction from site K, around the RV and posterior LV and blocking over the infarcted LV beyond site F. At all sites, the noninvasively reconstructed electrograms (blue) closely match their directly measured counterparts (red) in morphology and activation times but with noticeable differences in amplitude. The reconstructed activation times at each site are within 10 ms of the measured activation times. The data of Figure 3 (anterior location of earliest epicardial activation site and posterior region of slowed conduction above the septum) suggest that septal activation progresses from posterior to anterior.
Figure 4.
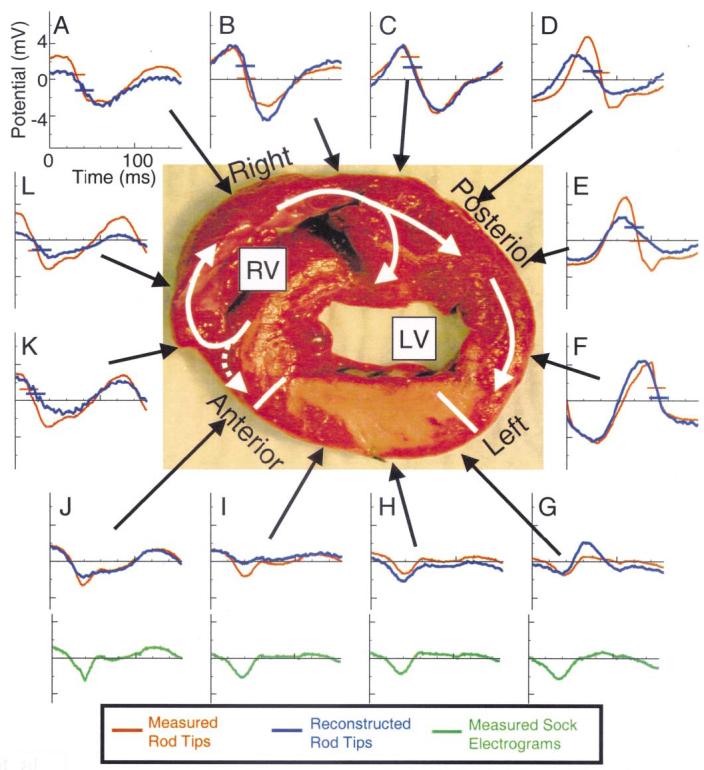
Epicardial electrograms during reentry; same format as Figure 2. White arrows indicate direction of proposed wavefront propagation. Horizontal bars on electrograms mark activation times at each site for the measured (red) and noninvasively reconstructed (blue) signals. Green electrograms at the bottom are recorded from the epicardial sock at about the same locations as rod-tip electrograms G to J. LV = left ventricle; RV = right ventricle.
The broad initial wavefront observed in cycle 1 of the VT (Fig. 3A) emerged from two nearly simultaneous epicardial breakthrough sites that are clearly distinguished in the potential maps of Figure 5B. These breakthrough sites occur at the same locations as epicardial breakthroughs 2 and 3 during RA pacing (Fig. 5A), suggesting at least partial activation of the conduction system during this reentrant cycle. The breakthrough sites observed during VT cycles 2 and 3 are shown in Figure 5, C and D, respectively, with their locations corresponding to breakthrough site 1 of RA pacing. This suggests a somewhat different conduction system involvement compared with cycle 1. Panels E to G of Figure 5 show breakthrough sites for three additional VT cycles. The locations of the breakthroughs in each case correspond to one of the RA pacing breakthroughs. Distances between measured and reconstructed breakthrough locations are provided in Figure 5. On average, ECGI reconstructed the epicardial breakthroughs within 8.69 mm of their actual location, providing a quantitative estimate of the spatial resolution of ECGI that agrees well with the ≤10 mm error observed by Oster et al. (3) when locating ventricular pacing sites.
Figure 5.
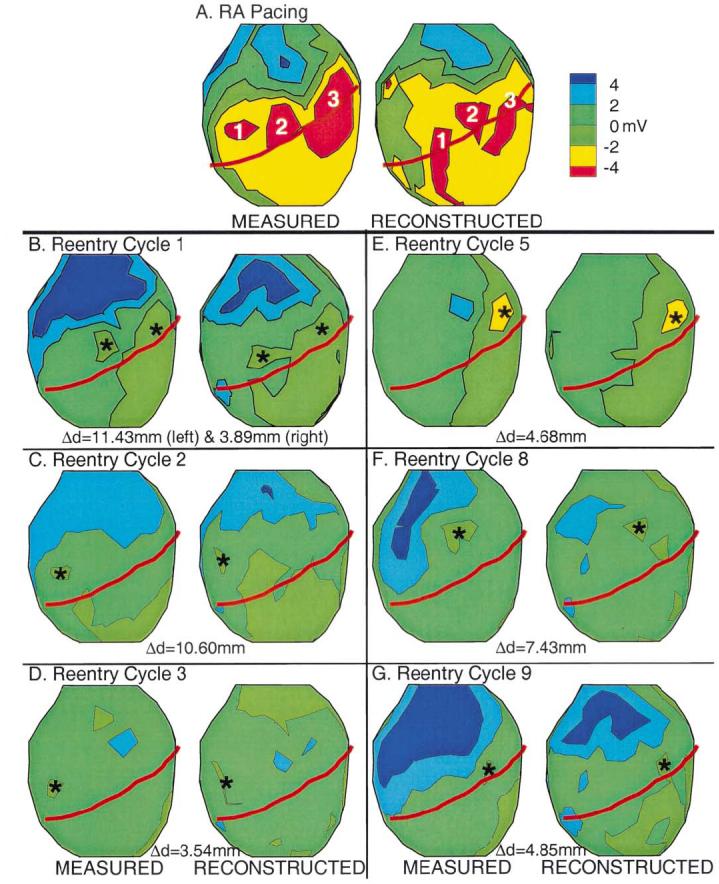
Epicardial potential maps during epicardial breakthrough. Potentials are displayed as color-coded maps. In each panel, measured potentials are on the left, and noninvasively reconstructed potentials are on the right. (A) Potentials corresponding to right atrial (RA) pacing (simulated sinus rhythm). The numbers mark the locations of the three epicardial breakthroughs. (B to G) Potentials corresponding to ventricular tachycardia (VT) cycles 1, 2, 3, 5, 8 and 9, respectively. Asterisks indicate locations of epicardial breakthroughs for each VT cycle. The distances between the measured and reconstructed breakthrough sites (Δd) are provided.
DISCUSSION
Infarct geometry
The results of this study demonstrate that ECGI can noninvasively reconstruct important electrophysiologic properties of hearts with structural disease and arrhythmias. In a previous model study (5,6), we successfully reconstructed electrophysiologic properties associated with a viable epicardial border zone over an infarct (5). During VT, key components of the reentry circuit (lines of block, the central common pathway and two arms of the double-loop reentry) were confined to the epicardial border zone and were, therefore, visible in the measured and reconstructed data (6). Here, the heart we present in detail had an infarct encompassing much of the anterior LV and portions of the septum. The presence of pure Q-wave epicardial electrograms over a large portion of the infarcted myocardium during RA pacing provides evidence for transmural myocardial damage and the absence of an excitable epicardial border zone. Interestingly, pure Q-wave electrograms, indicating lack of local activation, are reconstructed (and directly measured with both epicardial sock electrodes and rod-tip electrodes) over regions of tissue that appear viable in the TTC-stained slices. A possible explanation for these observations is that the apparently viable stained myocardium was not activated because of stunning from added stress caused by isolation, placement in the tank and Langendorff perfusion of the already compromised (infarcted) heart.
The reentry pathway
The large extent and transmural nature of the resultant myocardial damage in this experiment produced a fundamentally different reentry pathway during VT as compared with the mostly epicardial reentry in the previous study (6). In this study, the epicardial data suggest that a key portion of the reentrant circuit was intramural or septal (a topology that reflects many common clinical VTs) (1,7,8), with conduction block over a large portion of the LV epicardium. The noninvasively reconstructed epicardial electrograms, isochrones and potential maps provided sufficient information from which an epicardial and intramural sequence of reentrant activation could be deduced. Septal involvement in the reentrant activation in a posterior-anterior direction is suggested by the anterior location of epicardial emergence of the reentrant wavefront and by the slowing of conduction as the wavefront travels from the RV free wall over the posterior septum (12). An intriguing observation is the close correspondence of epicardial breakthrough sites during RA pacing and during the VT, suggesting partial activation of the conduction system during the reentrant beat. This is consistent with clinical observations implicating surviving endocardial Purkinje fibers in reentrant arrhythmias in the setting of infarction (13,14). Note that VT cycle 1 in Figure 3 (the first cycle after VT induction) shows the largest degree of conduction system activation, generating two of the three breakthrough sites that are seen during RA pacing. Conduction system activation seems to be less extensive in VT cycles 2 and 3, as suggested by the presence of only a single breakthrough site during these cycles. A possible explanation for this phenomenon lies in the extremely short cycle length of the VT induced in this heart (approximately 120 ms). At such a fast rate, it is likely that successive wavefronts encounter varied degrees of recovery in different parts of the conduction system. Additional evidence for the intramural or septal nature of this reentry can be seen in the electrograms of both the rod tips and epicardial sock over the anterior LV, which show no indication of local activation. These electrograms are characterized by small slow deflections due to far-field activity, indicating complete conduction block. This rules out the possibility that the wavefront propagates from the posterior LV across the infarcted area to the anterior epicardial emergence site and supports the analysis that the reentry involves intramural and septal activation. This is the most probable scenario that is supported by the data. However, other possibilities such as microreentry in the septum or participation of noninfarcted subendocardial myocardium in the reentry circuit cannot be ruled out without high-density intramural mapping. It should be emphasized that ECGI can provide, noninvasively, similar information to that of invasive epicardial mapping during cardiac surgery. In this respect, it constitutes a major improvement over the available (nonimaging) ECG methods that can only provide data on the body surface, far away from the heart. Of course, in both ECGI reconstruction and intraoperative mapping, expert interpretation is required for deducing the mechanism of the arrhythmia and the pattern of activation from the epicardial information.
Clinical application
The study demonstrates the ability of ECGI to noninvasively reconstruct electrophysiologic properties in the presence of extensive transmural myocardial damage and to provide important information on the sequence of activation during reentrant activity in this setting. The reconstructed epicardial information could be extremely useful clinically, providing guidance for patient diagnosis and therapy. For instance, knowledge that the septum (not the infarcted LV) is a key component of the reentry circuit could direct ablation. Once epicardial potentials are reconstructed, various temporal or spatial signal processing methods could be applied to the reconstructed data to identify potentially arrhythmogenic substrates (15). The limitation of obtaining information only on the epicardial surface of the heart can be overcome by combining, when necessary, noninvasive epicardial ECGI with catheter reconstruction of endocardial potentials using similar methodology (16). The availability of simultaneous detailed information on both surfaces will greatly enhance our ability to determine the three-dimensional activity in the myocardium. Finally, the experiments and reconstructions presented here were performed in a homogeneous tank-torso, which does not contain internal inhomogeneities such as the lungs. In a recent publication (17), we demonstrated that torso inhomogeneities (lungs, skeletal muscle, spine, sternum) have a negligible effect on the reconstruction of epicardial potentials, electrograms and isochrones and can be ignored in the application of ECGI.
Acknowledgments
This study was supported by NIH-NHLBI grants R37HL-33343 and RO1HL-49054 (Y.R.) and RO1HL-43276 (B.T.). Additional support was provided by awards from the Whitaker Foundation (Y.R.) and the Nora Eccles Treadwell Foundation and the Richard A. and Nora Eccles Harrison Fund for Cardiovascular Research (B.T.).
Abbreviations and Acronyms
- CC
correlation coefficient
- -dV/dtmax
maximum negative derivative
- ECGI
electrocardiographic imaging
- LAD
left anterior descending coronary artery
- LV
left ventricle
- MI
myocardial infarction
- RA
right atrial
- RV
right ventricle
- TTC
triphenyltetrazolium chloride
- VT
ventricular tachycardia
REFERENCES
- 1.Janse MJ, Wit AL. Electrophysiological mechanisms of ventricular arrhythmias resulting from myocardial ischemia and infarction. Physiol Rev. 1989;69:1049–169. doi: 10.1152/physrev.1989.69.4.1049. [DOI] [PubMed] [Google Scholar]
- 2.Rudy Y. The electrocardiogram and cardiac excitation. In: Sperelakis N, Kurachi Y, Terzic A, Cohen M, editors. Heart Physiology and Pathophysiology. Academic Press; San Diego, CA: 2000. pp. 133–48. [Google Scholar]
- 3.Oster HS, Taccardi B, Lux RL, Ershler PR, Rudy Y. Noninvasive electrocardiographic imaging: reconstruction of epicardial potentials, electrograms, and isochrones and localization of single and multiple electrocardiac events. Circulation. 1997;96:1012–24. doi: 10.1161/01.cir.96.3.1012. [DOI] [PubMed] [Google Scholar]
- 4.Oster HS, Taccardi B, Lux RL, Ershler PR, Rudy Y. Electrocardiographic imaging: noninvasive characterization of intramural myocardial activation from inverse-reconstructed epicardial potentials and electrograms. Circulation. 1998;97:1496–507. doi: 10.1161/01.cir.97.15.1496. [DOI] [PubMed] [Google Scholar]
- 5.Burnes JE, Taccardi B, MacLeod RS, Rudy Y. Noninvasive electrocardiographic imaging of electrophysiologically abnormal substrates in infarcted hearts: a model study. Circulation. 2000;101:533–40. doi: 10.1161/01.cir.101.5.533. [DOI] [PubMed] [Google Scholar]
- 6.Burnes JE, Taccardi B, Rudy Y. A noninvasive imaging modality for cardiac arrhythmias. Circulation. 2000;102:2152–8. doi: 10.1161/01.cir.102.17.2152. [DOI] [PMC free article] [PubMed] [Google Scholar]
- 7.de Bakker JM, Coronel R, Tasseron S, et al. Ventricular tachycardia in the infarcted, Langendorff-perfused human heart: role of the arrangement of surviving cardiac fibers. J Am Coll Cardiol. 1990;15:1594–607. doi: 10.1016/0735-1097(90)92832-m. [DOI] [PubMed] [Google Scholar]
- 8.Chung MK, Pogwizd SM, Miller DP, Cain ME. Three-dimensional mapping of the initiation of nonsustained ventricular tachycardia in the human heart. Circulation. 1997;95:2517–27. doi: 10.1161/01.cir.95.11.2517. [DOI] [PubMed] [Google Scholar]
- 9.Messinger-Rapport BJ, Rudy Y. Noninvasive recovery of epicardial potentials in a realistic heart-torso geometry: Normal sinus rhythm. Circ Res. 1990;66:1023–39. doi: 10.1161/01.res.66.4.1023. [DOI] [PubMed] [Google Scholar]
- 10.Dillon SM, Allessie MA, Ursell PC, Wit AL. Influences of anisotropic tissue structure on reentrant circuits in the epicardial border zone of subacute canine infarcts. Circ Res. 1988;63:182–206. doi: 10.1161/01.res.63.1.182. [DOI] [PubMed] [Google Scholar]
- 11.Rudy Y, Messinger-Rapport BJ. The inverse problem in electrocardiography: solutions in terms of epicardial potentials. Crit Rev Biomed Eng. 1988;16:215–68. [PubMed] [Google Scholar]
- 12.Taccardi B, Lux RL, Ershler PR, MacLeod RS, Zabawa C, Vyhmeister Y. IEEE Comp Cardiol. IEEE Press; Los Alamitos, CA: 1992. Potential distributions and excitation time maps recorded with high spatial resolution from the entire ventricular surface of exposed dog hearts; pp. 1–4. [Google Scholar]
- 13.Fenoglio JJ, Jr., Pham TD, Harken AH, Horowitz LN, Josephson ME, Wit AL. Recurrent sustained ventricular tachycardia: structure and ultrastructure of subendocardial regions in which tachycardia originates. Circulation. 1983;68:518–33. doi: 10.1161/01.cir.68.3.518. [DOI] [PubMed] [Google Scholar]
- 14.Caceres J, Jazayeri M, McKinnie J, et al. Sustained bundle branch reentry as a mechanism of clinical tachycardia. Circulation. 1989;79:256–70. doi: 10.1161/01.cir.79.2.256. [DOI] [PubMed] [Google Scholar]
- 15.Ciaccio EJ, Scheinman MM, Wit AL. Relationship of specific electrogram characteristics during sinus rhythm and ventricular pacing determined by adaptive template matching to the location of functional reentrant circuits that cause ventricular tachycardia in the infarcted canine heart. J Cardiovasc Electrophysiol. 2000;11:446–57. doi: 10.1111/j.1540-8167.2000.tb00341.x. [DOI] [PubMed] [Google Scholar]
- 16.Jia P, Punske B, Taccardi B, Rudy Y. Electrophysiologic endocardial mapping from a noncontact nonexpandable catheter: a validation study of a geometry-based concept. J Cardiovasc Electrophysiol. 2000;11:1238–51. doi: 10.1046/j.1540-8167.2000.01238.x. [DOI] [PubMed] [Google Scholar]
- 17.Ramanathan C, Rudy Y. Electrocardiographic imaging: Effect of torso inhomogeneities on noninvasive reconstruction of epicardial potentials, electrograms, and isochrones. J Cardiovasc Electrophysiol. 2001;12:241–52. doi: 10.1046/j.1540-8167.2001.00241.x. [DOI] [PubMed] [Google Scholar]