Abstract
Protein crystallization, aggregation, liquid–liquid phase separation, and self-assembly are important in protein structure determination in the industrial processing of proteins and in the inhibition of protein condensation diseases. To fully describe such phase transformations in globular protein solutions, it is necessary to account for the strong spatial variation of the interactions on the protein surface. One difficulty is that each globular protein has its own unique surface, which is crucial for its biological function. However, the similarities amongst the macroscopic properties of different protein solutions suggest that there may exist a generic model that is capable of describing the nonuniform interactions between globular proteins. In this paper we present such a model, which includes the short-range interactions that vary from place to place on the surface of the protein. We show that this aeolotopic model [from the Greek aiolos (“variable”) and topos (“place”)] describes the phase diagram of globular proteins and provides insight into protein aggregation and crystallization.
Simple isotropic models that treat the protein molecules as spherical particles with short-range attractive interactions explain certain features of the protein phase diagram (1–5). In particular, liquid–liquid coexistence turns out to be metastable with respect to solidification when the range of interaction is less than one quarter of the particle diameter (6–10). This metastability has been observed for a variety of protein solutions (11–15) and in colloidal solutions (16–18), but not in simple fluids where the range of interaction is long (19). The isotropic model, however, fails to describe the phase diagram of protein solutions quantitatively and cannot address phenomena such as protein aggregation and self-assembly.
We use a simple model in which the energy of each particle depends only on its position relative to other particles and on its own orientation but is independent of the orientation of other particles. In this model, the pair potential of particles i and j has the form w(Ωi, Ωj, rij) = u(Ωi, rij) + u(Ωj, −rij). Here, rij is the vector distance between particles i and j while Ω represents the three Euler angles that define the orientation of the particle. For such an additive model, it is possible to define the orientation-averaged free energy, fi({rij}), of an individual particle as
 |
1 |
As usual, N is the number of particles, and β = 1/kBT, where kB is Boltzmann’s constant and T is the absolute temperature. The free energy fi({rij}) of a particle depends on the positions of all of the particles with which it interacts. If we can ignore correlations between these interactions, then fi({rij}) can be written as Σj=1; j≠iNU(rij), where U is a temperature-dependent, effective isotropic potential given by exp[−βU(rij)] = ∫exp[−βu(Ωi, rij)]dΩi/8π2.
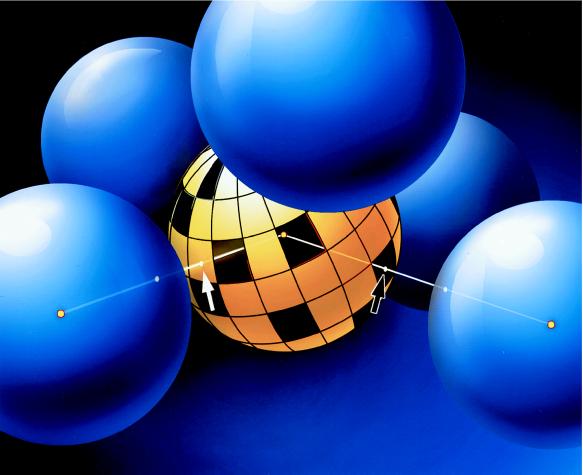
To study the conditions under which the aeolotopic potential u(Ωi, rij) is “averageable,” i.e., accurately approximated by the effective potential U(rij), we use the following modified square-well model. A protein molecule is represented by a spherical particle with a “map” of attractive regions covering a fractional area a of the surface. In this work, maps consisted of s non-overlapping spots of equal area on grids formed by equidistant meridional lines intersected by lines of constant latitude (see Fig. 1). As in the isotropic square well model (20), particles i and j are said to be neighbors if the distance rij between the centers of the two particles lies within σ ≤ rij < λσ (where λ is the reduced range of interaction and σ is the diameter of the hard core). A particle i is said to make a contact with its neighbor j if the vector rij passes through an attractive spot on protein i. The energy u(Ωi, rij) is defined as −ɛ/2 times the number of contacts made by the particle.
Figure 1.
Schematic representation of the interactions of a model protein with its neighbors. The attractive spots on the central particle are shown as transparent. The central particle makes a contact with the front right neighbor but not with the front left neighbor.
The effective pair potential for our model is a standard square-well potential with range λ and a temperature-dependent depth given by
 |
2 |
where ɛ̂ ≡ ɛ/kT. To establish whether the aeolotopic potential is averageable, the reduced effective energy ɛ̂eff(T) ≡ ɛeff(T)/kT is to be compared with f̂ ≡ −2fi({rij})/nkT, the actual free energy per pair of neighbors (n is the number of neighbors).
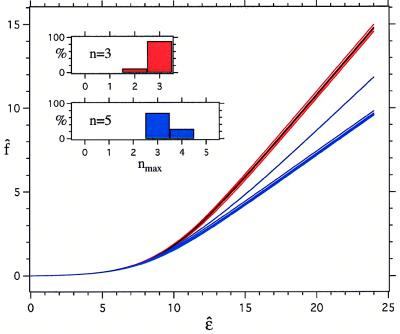
We have numerically calculated f̂ from Eq. 1 as a function of ɛ. Fig. 2 shows representative results for a particular map of 25 randomly placed spots with a = 0.01 and for two different numbers of neighbors: n = 3 and n = 5. For each n we show the results for five sets {rij} of randomly chosen positions of the neighbors. The black line is ɛ̂eff(T).
Figure 2.
The reduced free energy as a function of the reduced energy. The black line is obtained assuming independent interactions. The red and blue lines are the simulation results for f̂ with n = 3 and n = 5, respectively, for five different randomly chosen configurations of the neighbors. The same map, with a = 0.01 and s = 25, was used for both sets of simulations. For a given configuration of neighbors, the probability p(m; n) that the central particle makes m contacts was calculated (for each m in the range 0 ≤ m ≤ n) by directing counting of the contacts for 10 million random orientations of the central sphere. The reduced free energy then was obtained from f̂ = (2/n)ln[Σm=0n p(m; n)exp(mɛ̂/2)]. The inset shows the percentage of simulations in which the maximum number of contacts made is nmax.
For all configurations of the neighbors shown, the n = 3 results for f̂ are close to ɛeff(T), while for n = 5, the free energy f̂ falls below ɛ̂eff(T) at sufficiently large energies. This is because there are no orientations for which all five contacts are ever made. In fact, in four of the five configurations of neighbors, only three contacts were ever simultaneously made for this particular map. We see that, if the particle has three neighbors, its potential is averageable. For n = 5 it is not, and the full free energy must be explicitly calculated.
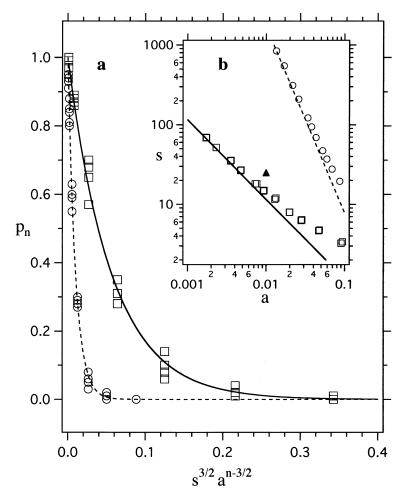
In Fig. 3a, we show the results of our simulations for the probability pn that a particle cannot make all contacts with n randomly located neighbors for n = 3 (squares) and n = 5 (circles). Each point represents the results for a different map. As expected, maps with different patterns of the attractive spots, but the same s and a, have similar probabilities. The solid lines are given by
 |
3 |
where κn is of order one†. For the lines shown in Fig. 3a, we find κ3 = 0.67 and κ5 = 0.80.
Figure 3.
(a) The probability pn of not making all n contacts. The open symbols are the simulation results for n = 3 (squares) and n = 5 (circles). Vertical clusters of points represent maps with the same s and a but different random patterns of the attractive spots. For a given configuration of neighbors, a large sampling of orientation space was performed to search for orientations of the central particle in which all n contacts were made. This search was performed by combining random reorientations of the particle with small rotations about a randomly chosen axis to ensure a thorough sampling of all possible orientations. The probability pn was calculated by counting the number of configurations of neighbors (of 100 randomly chosen ones) in which the central sphere did not make all n contacts. The theoretical results for n = 3 (solid line) and n = 5 (dashed line) also are shown (see Eq. 3). (b) The boundary for averaging the potential. The open symbols are the simulation results for n = 3 (squares) and n = 5 (circles). The values of s and a for each symbol are those that give pn = 0.5. They were obtained by interpolating the simulation results for many different values of s and a that give pn ≈ 0.5. Above the open symbols, the potential is averageable for the corresponding n; below, it is not. The lines are the results expected for n = 3 (solid) and n = 5 (dashed) from Eq. 3. The solid triangle corresponds to the values of s and a used in Fig. 2.
When pn ≈ 1, only very specific configurations of neighbors allow contacts with all neighbors and the potential is not averageable, whereas when pn ≈ 0, all contacts are made in numerous orientations and the aeolotopic potential is averageable. In Fig. 3b, we present the simulation results for pn(s, a) = 0.5 for n = 3 (squares) and n = 5 (circles). For maps whose s and a fall significantly above the open symbols (i.e., pn < 0.5), the potential is averageable; below, it is not. The lines are obtained from Eq. 3 for n = 3 (solid) and n = 5 (dashed), assuming the values of κn given above. The solid triangle in Fig. 3b corresponds to the parameters of the map we have used in Fig. 2 (s = 25, a = 0.01).
The key parameter that determines whether an average potential can be used instead of an aeolotopic one is the number of neighbors n. Interactions that are averageable near the liquid–liquid critical point, where n ≈ 3 (1), may no longer be averageable in the crystal, where n > 5. Thus, it is not always appropriate to use the same effective potential to describe both the liquid and solid phases.
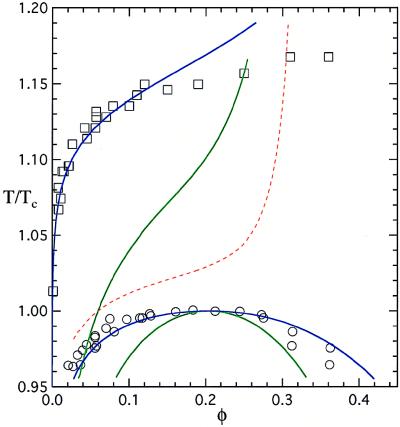
This conclusion is borne out when we analyze the phase diagram of globular protein solutions. In Fig. 4, we show as open symbols the liquidus line (squares) and coexistence curve (circles) measured for the protein γIIIb-crystallin (11, 13). We have previously shown that the isotropic square well model with a reduced range of interaction λ = 1.25 produces the correct coexistence curve (blue coexistence curve), provided that the depth of the potential has the appropriate temperature dependence (1). However, the liquidus line predicted by using the same potential in the solid (dashed red line) differs significantly from the experimental results (2). The aeolotopic model accounts in a natural way for the difference in apparent potentials in the two phases. The energy per particle that corresponds to the blue liquidus line (Fig. 4) is −cɛ/2 = −47kBTc, where c is the number of contacts made per particle and Tc is the critical temperature (2, 21). For c ≈ 10, we find that ɛ ≈ 9kBTc. The effective energy at the critical temperature for λ = 1.25 is ɛeff(Tc) = 1.3kBTc (1). Using these values of ɛ and ɛeff(Tc), we find from Eq. 2 that a ≈ 0.01. Remarkably, this value of a produces an ɛeff(T) that yields the blue coexistence curve in Fig. 4. We see that the aeolotopic model provides a self-consistent and accurate representation of the liquidus line and the coexistence curve.
Figure 4.
The phase diagram of γIIIb-crystallin. The open symbols are the experimentally determined liquidus line (squares) and coexistence curve (circles) for the protein. The green lines are the predictions for the boundaries assuming temperature-independent isotropic square well interactions (2). The blue coexistence curve is obtained for a square-well potential (1) with λ = 1.25 and ɛeff(T) given by Eq. 2 with ɛ = 9kBTc and a = 0.01. The blue liquidus line is obtained by equating the chemical potential of the liquid, with the above λ and ɛeff(T), to the chemical potential of the solid with the parameters given in the text. The dashed red liquidus line corresponds to a solid interacting through the same effective isotropic potential ɛeff(T) as the liquid.
Aeolotopic interactions are responsible for protein aggregation. The number of neighbors within the aggregate is large, the energy per contact is much larger than the thermal energy, and the interactions are not averageable. All of these factors produce large energy barriers between the various conformations of aggregates which prevent the aggregates from rearranging into a crystal. Therefore, when the aeolotopic interactions are strong, metastable aggregates will abound, even though the crystal is the thermodynamically more stable structure. This view is consistent with the observation that, if the virial coefficient is too negative, amorphous aggregation dominates (22, 23). Of course, to properly address the competition between crystallization and aggregation, the kinetic properties of the aeolotopic model need to be investigated. However, the perspective we have presented suggests that it is the isotropic interactions between the proteins—both attractive and repulsive—which favor the formation of crystals over aggregates, while the aeolotopic interactions determine only the details of the crystal structure.
The aeolotopic model we have discussed captures the important features that characterize the interactions of proteins in solution. It provides a natural explanation as to why different apparent potentials are needed to describe the liquid and solid phases. Furthermore, the aeolotopic model lays the foundation for an analysis of phenomena unique to protein solutions, such as oligomerization, amorphous aggregation, and self-assembly.
Acknowledgments
We thank Prof. D. Blankschtein, Prof. A. Grosberg, Dr. W. Eaton, Prof. M. Kardar, Dr. J. Pande, and Dr. G. Thurston for reviewing the manuscript and Mr. S. Cacace and Mr. S. Moskowitz for the design and production of Fig. 1. This work was supported by the National Eye Institute of the National Institutes of Health.
Footnotes
One way to derive Eq. 3 is as follows. The probability that n neighbors make all n contacts for a particular orientation of the central sphere is an. This orientation allows a small rotational jiggle about each of the three axes of the sphere within an angle Δθ ∼ (a/s)1/2/n without losing any contacts. If two orientations differ by more than Δθ, their probabilities of making all contacts are statistically independent (this last statement holds only for maps with many randomly placed spots). There are 1/(Δθ)3 such independent orientations, and the probability that none of them makes all n contacts is exp(−an/(Δθ)3). Substituting for Δθ, we recover Eq. 3.
References
- 1.Lomakin A, Asherie N, Benedek G B. J Chem Phys. 1996;104:1646–1656. [Google Scholar]
- 2.Asherie N, Lomakin A, Benedek G B. Phys Rev Lett. 1996;77:4832–4835. doi: 10.1103/PhysRevLett.77.4832. [DOI] [PubMed] [Google Scholar]
- 3.Rosenbaum D, Zamora P C, Zukoski C F. Phys Rev Lett. 1996;76:150–153. doi: 10.1103/PhysRevLett.76.150. [DOI] [PubMed] [Google Scholar]
- 4.Rosenbaum D F, Zukoski C F. J Crystallogr Growth. 1996;169:752–758. [Google Scholar]
- 5.Poon W C K. Phys Rev E. 1997;55:3762–3764. [Google Scholar]
- 6.Lekkerkerker H N W, Poon W C K, Pusey P N, Stroobants A, Warren P B. Europhys Lett. 1992;20:559–564. [Google Scholar]
- 7.Hagen M H J, Meijer E J, Mooij G C A M, Frenkel D, Lekkerkerker H N W. Nature (London) 1993;365:425–426. [Google Scholar]
- 8.Hagen M H J, Frenkel D. J Chem Phys. 1994;101:4093–4097. [Google Scholar]
- 9.Daanoun A, Tejero C F, Baus M. Phys Rev E. 1994;50:2913–2924. doi: 10.1103/physreve.50.2913. [DOI] [PubMed] [Google Scholar]
- 10.Rascòn C, Navascués G, Mederos L. Phys Rev B. 1995;51:14899–14906. doi: 10.1103/physrevb.51.14899. [DOI] [PubMed] [Google Scholar]
- 11.Berland C R, Thurston G M, Kondo M, Broide M L, Pande J, Ogun O O, Benedek G B. Proc Natl Acad Sci USA. 1992;89:1214–1218. doi: 10.1073/pnas.89.4.1214. [DOI] [PMC free article] [PubMed] [Google Scholar]
- 12.Thomson J A, Schurtenberger P, Thurston G M, Benedek G B. Proc Natl Acad Sci USA. 1987;84:7079–7083. doi: 10.1073/pnas.84.20.7079. [DOI] [PMC free article] [PubMed] [Google Scholar]
- 13.Broide M L, Berland C R, Pande J, Ogun O O, Benedek G B. Proc Natl Acad Sci USA. 1991;88:5660–5664. doi: 10.1073/pnas.88.13.5660. [DOI] [PMC free article] [PubMed] [Google Scholar]
- 14.Broide M L, Tominc T M, Saxowsky M D. Phys Rev E. 1996;53:6325–6333. doi: 10.1103/physreve.53.6325. [DOI] [PubMed] [Google Scholar]
- 15.Muschol M, Rosenberger F. J Chem Phys. 1997;107:1953–1962. [Google Scholar]
- 16.Verduin H, Dhont J K G. J Colloid Interface Sci. 1995;172:425–437. [Google Scholar]
- 17.Ilett S M, Orrock A, Poon W C K, Pusey P N. Phys Rev E. 1995;51:1344–1352. doi: 10.1103/physreve.51.1344. [DOI] [PubMed] [Google Scholar]
- 18.Gast A P, Russel W B. Phys Today. 1998;51:24–30. [Google Scholar]
- 19.Zemansky M W. Heat and Thermodynamics. New York: McGraw–Hill; 1968. [Google Scholar]
- 20.Reichl L E. A Modern Course in Statistical Physics. Austin, TX: Univ. of Texas Press; 1980. [Google Scholar]
- 21.Tanford C. Physical Chemistry of Macromolecules. New York: Wiley; 1961. [Google Scholar]
- 22.George A, Chiang Y, Guo B, Arabshahi A, Cai Z, Wilson W W. Methods Enzymol. 1997;276:100–110. doi: 10.1016/S0076-6879(97)76052-X. [DOI] [PubMed] [Google Scholar]
- 23.Neal B L, Asthagiri D, Lenhoff A M. Biophys J. 1998;75:2469–2477. doi: 10.1016/S0006-3495(98)77691-X. [DOI] [PMC free article] [PubMed] [Google Scholar]


