

Abstract
Localized, transient elevations in cytosolic Ca2+, known as Ca2+ sparks, caused by Ca2+ release from sarcoplasmic reticulum, are thought to trigger the opening of large conductance Ca2+-activated potassium channels in the plasma membrane resulting in spontaneous transient outward currents (STOCs) in smooth muscle cells. But the precise relationships between Ca2+ concentration within the sarcoplasmic reticulum and a Ca2+ spark and that between a Ca2+ spark and a STOC are not well defined or fully understood. To address these problems, we have employed two approaches using single patch-clamped smooth muscle cells freshly dissociated from toad stomach: a high speed, wide-field imaging system to simultaneously record Ca2+ sparks and STOCs, and a method to simultaneously measure free global Ca2+ concentration in the sarcoplasmic reticulum ([Ca2+]SR) and in the cytosol ([Ca2+]CYTO) along with STOCs. At a holding potential of 0 mV, cells displayed Ca2+ sparks and STOCs. Ca2+ sparks were associated with STOCs; the onset of the sparks coincided with the upstroke of STOCs, and both had approximately the same decay time. The mean increase in [Ca2+]CYTO at the time and location of the spark peak was ∼100 nM above a resting concentration of ∼100 nM. The frequency and amplitude of spontaneous Ca2+ sparks recorded at −80 mV were unchanged for a period of 10 min after removal of extracellular Ca2+ (nominally Ca2+-free solution with 50 μM EGTA), indicating that Ca2+ influx is not necessary for Ca2+sparks. A brief pulse of caffeine (20 mM) elicited a rapid decrease in [Ca2+]SR in association with a surge in [Ca2+]CYTO and a fusion of STOCs, followed by a fast restoration of [Ca2+]CYTO and a gradual recovery of [Ca2+]SR and STOCs. The return of global [Ca2+]CYTO to rest was an order of magnitude faster than the refilling of the sarcoplasmic reticulum with Ca2+. After the global [Ca2+]CYTO was fully restored, recovery of STOC frequency and amplitude were correlated with the level of [Ca2+]SR, even though the time for refilling varied greatly. STOC frequency did not recover substantially until the [Ca2+]SR was restored to 60% or more of resting levels. At [Ca2+]SR levels above 80% of rest, there was a steep relationship between [Ca2+]SR and STOC frequency. In contrast, the relationship between [Ca2+]SR and STOC amplitude was linear. The relationship between [Ca2+]SR and the frequency and amplitude was the same for Ca2+ sparks as it was for STOCs. The results of this study suggest that the regulation of [Ca2+]SR might provide one mechanism whereby agents could govern Ca2+ sparks and STOCs. The relationship between Ca2+ sparks and STOCs also implies a close association between a sarcoplasmic reticulum Ca2+ release site and the Ca2+-activated potassium channels responsible for a STOC.
Keywords: Ca2+ spark, spontaneous transient outward current, Mag-fura-2, [Ca2+]SR, ryanodine receptor
introduction
Ca2+ signaling has long been treated in terms of global changes in cytosolic Ca2+ even though Ca2+ must serve as a signal for many different processes, suggesting that Ca2+ elevations might be targeted to different regions of the cell or “microdomains.” In recent years, attention has increasingly been drawn to highly localized Ca2+ changes within the cell. Such highly localized Ca2+ signals are of importance for two reasons (Berridge, 1997). First, in many important processes, the global elevation in Ca2+ is actually the sum of highly localized Ca2+ elevations due to release from discrete foci in the sarcoplasmic reticulum (SR).1 Hence, localized elevations can be the “elementary events” underlying a global rise in Ca2+. Second, and perhaps even more interestingly, such focal Ca2+ signals might perform localized and very specific signaling functions in the absence of a global elevation in cytosolic Ca2+. For example, localized elevations in Ca2+ are thought to regulate large conductance Ca2+-activated potassium channels (BK channels) in the surface membrane of both neurons and smooth muscle cells. Such elevations in Ca2+ were first postulated by Brown et al. (1983), who called them Ca2+ “packets” that might serve as “internal transmitters” to explain the spontaneous miniature outward currents caused by activation of groups of BK channels in bullfrog sympathetic ganglion cells.
In cardiac, skeletal, and smooth muscle cells, such transient, localized cytosolic Ca2+ elevations are called Ca2+ sparks. In smooth muscle, the existence of Ca2+ sparks was first inferred from the appearance of spontaneous transient outward currents (STOCs) that are caused by the concerted opening of a number of BK channels and that have been observed in a wide variety of smooth muscle types (Bolton and Imaizumi, 1996). The Ca2+ sparks that cause STOCs have now been directly observed by others and ourselves in a number of smooth muscle types (Nelson et al., 1995; Kirber et al., 1996; Mironneau et al., 1996; ZhuGe et al., 1998a).
The regulation of Ca2+ sparks in smooth muscle and other cell types has only recently been addressed. Several regulatory factors for Ca2+ sparks have been suggested or demonstrated, among them cyclic nucleotides (Porter et al., 1998), cytosolic Ca2+ (Cheng et al., 1996), and luminal Ca2+ concentration; that is, Ca2+ concentration within the sarcoplasmic reticulum ([Ca2+]SR) (Lukyanenko et al., 1996). In the case of luminal Ca2+, possible evidence for its role in regulating sparks comes in a study of ventricular myocytes from phospholamban-deficient knock-out mice (Santana et al., 1997). However, in that study, the level of luminal Ca2+ was inferred rather than measured directly since there was no way to quantify the actual level of luminal Ca2+. Moreover, there is no study of the effects of luminal Ca2+ on Ca2+ sparks in smooth muscle and no direct measure of the effect of luminal Ca2+ on STOCs in any preparation.
It has been postulated that the frequency of STOCs in smooth muscle reflects the level of [Ca2+]SR (Bolton and Imaizumi, 1996), but there has been no direct evidence for this since simultaneous measurements of both STOCs and [Ca2+]SR have not been made. In the present study, we use the low affinity Ca2+ indicator, mag-fura-2, to make measurements of [Ca2+]SR while monitoring STOCs in a single smooth muscle cell with tight-seal, whole-cell recording. We show that both Ca2+ sparks and STOCs are abolished upon depletion of SR Ca2+ and that they recover as the SR reloads. Further, the SR recovers much more slowly than the cytosolic Ca2+ concentration ([Ca2+]CYTO). We also demonstrate for the first time by direct measurement a steep relationship between the level of luminal Ca2+ and the frequency of Ca2+ sparks and STOCs over a restricted range of [Ca2+]SR. These findings suggest that agents that act to regulate Ca2+ sparks and STOCs, and hence the contractile state of smooth muscle, might exert their effects in part by altering [Ca2+]SR.
methods and materials
Preparation of Cells and Electrophysiology
Single smooth muscle cells were enzymatically dispersed from the stomach of Bufo marinus as described previously (Fay et al., 1982). Membrane currents were recorded with either the Axopatch 1D or Axoclamp 2A (Axon Instruments) in the tight-seal, whole-cell recording configuration. Over 50% of the cells displayed STOCs under the conditions employed. Extracellular solution contained (mM): 130 NaCl, 3 KCl, 1.8 CaCl2, 1 MgCl2, 10 Hepes, pH adjusted to 7.4 with NaOH. Pipette solution contained (mM): 137 KCl, 3 MgCl2, 10 Hepes, 3 Na2ATP, pH adjusted to 7.2 with KOH; free [Mg2+] in this solution was calculated to be 0.63 mM. All experiments were carried out at room temperature. Recordings of whole-cell currents were low-pass filtered with the single-pole filter of the Axoclamp 2A (100-Hz cutoff), digitally sampled at 300 Hz, and stored for analysis. In experiments where Ca2+ sparks were imaged simultaneously with the current, the low frequency cutoff, using the internal four-pole Bessel filter of the Axopatch 1D, was 200 Hz and the sampling rate was 1 kHz. STOCs were detected using a custom algorithm to detect peaks in the current. Peaks were determined using a running average of 18 ms. Once a peak was found, valleys were then checked on either side also using a running average with a window of 18 ms. The valley after the peak was then used as the next starting point to detect the next peak. Net peak current of any found STOC was calculated from the peak current minus the average of the two valley currents. Outward current transients that exceeded 10 pA were counted as STOCs.
Measurements of Global [Ca2+] in Cytosol and SR
Global [Ca2+] was measured using a high temporal resolution microfluorimeter as described previously (Becker et al., 1989). Mag-fura-2 acetoxymethylester (1 μM) was loaded into the cells as described in results. For measurements with this dye, fluorescence was converted to [Ca2+] (Grynkiewicz et al., 1985) using a K d for Ca2+-mag-fura-2 of 54 μM; determining Rmax, Rmin, and β as previously described (Becker and Fay, 1987). In the absence of Mg2+, this calculation gave a resting mean [Ca2+]SR of 154 μM determined in 172 cells. This calibration depends on a variety of factors, which cannot be determined with certainty in vivo (Golovina and Blaustein, 1997). However, in A7r5 cells, a cell line derived from smooth muscle, Sugiyama and Goldman (1995) found that alterations in [Mg2+]SR, ranging from 0 to 20 mM, did not alter the mag-fura-2 fluorescence ratio when [Ca2+]SR was held constant at 100 μM. From these and other observations, Sugiyama and Goldman (1995) concluded that, with the diminished Mg2+ sensitivity of mag-fura-2 in the presence of the relatively high [Ca2+] of the SR, measurements of changes in [Ca2+]SR were unlikely to be changed significantly by concomitant changes in [Mg2+]SR (see also Hofer and Schulz, 1996; Quamme et al., 1993). Finally, our conclusions here depend on changes in [Ca2+]SR, not on absolute values. In those experiments where global [Ca2+]SR and [Ca2+]CYTO were measured simultaneously in the same cell, we used a custom-built, high-speed multiple-wavelength microfluorimeter equipped with a 150-W xenon lamp. In such experiments, Ca2+ Green-1 dextran, potassium salt (mol wt 3000, 10 μM) was introduced via the patch pipette into cells preloaded with mag-fura-2 acetoxymethylester (see results) and excited at 490 nm. Mag-fura-2 was excited at 340 and 380 nm. Every 20 ms, the fluorescence was measured at 535 nm for a period of 5 ms for each excitation wavelength. For Ca2+ Green measurements, [Ca2+]CYTO was calculated as described previously (Hernandez-Cruz et al., 1990), taking the resting [Ca2+]CYTO as 100 nM based on previous measurements in these cells using fura-2 (Drummond and Fay, 1996).
Digital Imaging of Ca2+ Sparks
Fluorescence images of cytosolic free Ca2+ using fluo-3 as a calcium indicator were achieved using a custom-built wide-field digital imaging system or ultrafast microscope (see Fig. 1). The system can acquire images at a maximum speed of 543 Hz, thus providing a temporal resolution comparable to the confocal line-scan technique, but with a much larger observed area. Such rapid imaging was made possible by equipping the system with a cooled high-sensitivity, charge-coupled device camera developed in conjunction with the Massachusetts Institute of Technology Lincoln Laboratory (Lexington, MA; see Fig. 1, legend). The camera was interfaced to a custom made inverted microscope. The 488 nm line of an Argon Ion laser (Coherent) provided fluorescence excitation, and a laser shutter controlled the exposure duration. Emission of the Ca2+ indicator was monitored at wavelengths >500 nm. Subsequent image processing and analysis was performed off line using a custom-designed software package, running on a Silicon Graphics workstation. Ca2+ images were derived on a pixel to pixel basis from the equation ΔF/ F 0 (%) = 100 × [F(x,y,t) − F 0(x,y)]/F 0(x,y), where F(x,y,t) is the fluorescence at each pixel in the time series and F 0 is an image of the “resting” level given by the average of several images over time in the absence of sparks. The change in fluorescence provides only a relative, not an absolute, measurement of free Ca2+ concentration. An increase in fluorescence was considered to be a Ca2+ spark when it was ≥5.0% and lasted for at least two 10-ms frames. The root mean square (rms) noise, following smoothing of the images with a three-by-three pixel approximation to a Gaussian, was both measured from the data and calculated from the noise properties of the CCD camera; it was 1.5% in each case. Thus, the threshold for a spark, 5%, was more than three times greater than the rms noise.
Figure 1.

Schematic illustration of the ultrafast digital imaging system used to collect two- dimensional images of fluo-3 fluorescence. The beam of an Argon laser, tuned to λ = 488 nm, is passed through an electronically controlled shutter and telescopic beam expander. A field stop iris diaphragm typically limits the illumination to a region of the specimen ∼100 μm in diameter. The expanded beam is reflected by a dichroic mirror in the body of a custom-built epifluorescence microscope, passes through the objective (40× 1.3 NA Nikon oil immersion) and illuminates the cell. The fluo-3 fluorescence is collected by the objective, passes through the dichroic mirror and a 500-nm long-pass emission filter, and is imaged onto a high-speed, low-noise (70% quantum efficiency, 6.5 electrons root mean square readout noise), thermoelectrically cooled frame transfer CCD camera. The camera image frame is an array of 128 × 128 24-μm square pixels; the storage frame is of identical size. The detected image is shifted from the image to the storage frame in 50 μs, and the storage frame read out in 1.8 ms. Since acquisition of a new image can begin as soon as the image frame is cleared, the maximum camera rate is 543 frames/s. In this experiment, images were integrated for 10 ms and read out immediately, resulting in an image rate of 100 images/s. Each pixel samples a 333-nm square of the specimen. The camera has four digital outputs connected to two frame grabber boards (Data Raptor; Bitflow Inc.) connected to the PCI bus of a Pentium 90 MHz PC. The images are collected and stored in frame grabber memory, which can hold 8 MB of information, and later transferred to disk archival storage. The PC has an analogue to digital converter that digitizes the whole cell patch clamp current as well as the position of the objective, the image readout times, and membrane potential. Thus, the exact timing of the electrophysiological events in relation to the acquired images is known. Patch clamp recordings are done with an Axopatch 1D patch clamp amplifier. Agents are applied by pressure ejection with a Picosopritzer II (General Valve Corp.).
Data Analysis and Reagents
Data are reported as mean ± SEM, and n refers to the number of cells. Statistical analysis of difference was made with paired or unpaired Student's t test, as appropriate, with P < 0.05 considered significant. Mag-fura-2, fluo-3, and Ca2+ Green-1 were purchased from Molecular Probes, Inc., and all other chemicals from Sigma Chemical Co.
results
Ca2+ Sparks and STOCs Recorded in the Same Cell
To establish the relationship between Ca2+ sparks and STOCs, we first recorded both events simultaneously in the same cell using the ultrafast microscope diagrammed in Fig. 1 and standard patch clamp methodology (Hamill et al., 1981). The Ca2+ indicator fluo-3 (50 μM) was loaded into the cells through the patch pipette. At a holding membrane potential of 0 mV, the smooth muscle cells displayed Ca2+ sparks and coincident STOCs as illustrated in Fig. 2. Each spark was associated with a STOC in this sequence, with both spark and STOC rising simultaneously. (However, the spark for each STOC is not evident since whole-cell patch recording registers all STOCs in the cell, whereas the image captures only a portion of the cell.) In this smooth muscle cell type, the mean half time of spark decay (∼20 ms) was close to that of the STOCs (17.0 ± 1.7 ms; n = 15 cells). The mean amplitudes of Ca2+ sparks and STOCs were 10.8 ± 0.2% and 27.2 ± 5.2 pA (n = 15 cells), respectively.
Figure 2.

Ca2+ sparks and STOCs recorded simultaneously in a single smooth muscle cell. Ca2+ sparks were monitored with the ultrafast microscope while membrane currents were recorded in the tight-seal, whole-cell mode as described in methods. The patch pipette contained 50 μM K5 fluo-3. Approximately 10 min after rupturing the patch membrane, two-dimensional fluorescence images were acquired continuously at a rate of 100 Hz. After low-pass filtering at 200 Hz, the membrane current was digitally sampled at 1 kHz at a holding potential of 0 mV. (A) Images (10-ms exposures) of fluo-3 fluorescence showing five Ca2+ sparks from two sites, four at one site (arrows) and one at the other (*), during a 2-s recording period. These images were obtained at the time of the peak spark intensity (B, middle and bottom). The images in A, top, show the Ca2+ sparks below with a surface plot at higher spatial magnification. (B, top) Continuous records of whole-cell currents. (Middle and bottom) Continuous records of fluorescence intensity for two different pixels, each 333 × 333 nm. (Middle) Fluorescence for the pixel at the center of the sparks indicated by the arrows; (bottom) fluorescence for the pixel at the center of the spark indicated by the asterisk.
The Ca2+ sparks were visible as distinct, isolated events restricted to a small area of the cell, usually covering <3 μm2 at the time of their peak amplitude. Hence, they are quite different from the Ca2+ waves seen in many cell types. For a given cell, there were multiple spark-generating foci, with each focus discharging in an apparently random way. Moreover, it appeared that some foci discharged at a much higher rate than others and thus may constitute “hot spots,” similar to those first identified in esophageal smooth muscle cells (Kirber et al., 1998; see also Gordienko et al., 1998). For example, in Fig. 2, there were two spark-generating foci in the approximately one third of the cell surveyed in this case during the 2-s time period shown. Whereas one focus discharged only once, the other discharged four times.
The coincidence and similar time course of Ca2+ sparks and STOCs provide strong evidence that sparks are responsible for generating STOCs. To further examine this point, we tested the effect of altering spark frequency on STOC generation. To do so, we employed caffeine, which is known to cause Ca2+ release from internal stores through activation of ryanodine receptors (RyRs), which presumably underlie Ca2+ sparks in smooth muscle, as is the case in other preparations (Cheng et al., 1993; Xu et al., 1994; Nelson et al., 1995; Tsugorka et al., 1995). In the presence of 0.5 mM caffeine at a holding potential of 0 mV, a lower concentration than was used to deplete the SR and abolish sparks and STOCs in these cells (see below), there was an increase in frequency of both sparks (a 2.2-fold increase from 1.3 ± 0.4/s to 2.9 ± 0.4/s; 184 sparks in five cells; P < 0.05) and STOCs (a 2.4-fold increase from 2.5 ± 0.7/s to 5.9 ± 1.1/s; 443 STOCs in the same five cells; P < 0.05). Hence, consistent with earlier studies on other smooth muscle cells (Nelson et al., 1995; Mironneau et al., 1996), STOCs in these cells are due to Ca2+ sparks. That STOCs are caused by sparks does not imply, however, that every spark causes a STOC; in some instances we observed sparks that failed to cause STOCs (see also Kirber et al., 1998).
STOCs are Due to BK Channels
In other types of smooth muscle, STOCs are thought to result from coincident openings of a cluster of BK channels (Bolton and Imaizumi, 1996). To establish the identity of channels underlying the STOCs in these cells, we examined the effects of extracellular K+ and iberiotoxin, a specific inhibitor of BK channels (Galvez et al., 1990). In normal (3 mM) extracellular K+, STOC activity was apparent at holding potentials of −60 mV or more positive, with greater amplitude at more positive potentials (Fig. 3 A, top), consistent with the voltage dependence of STOCs in other smooth muscle preparations (Bolton and Imaizumi, 1996). In 45 mM extracellular K+ (Fig. 3 A, middle), the STOCs reversed in sign in the region of −20 mV, close to the calculated K+ reversal potential of −25 mV for these cells. Moreover, the STOCs induced by depolarization were eliminated by 100 nM iberiotoxin (Fig. 3 B), as expected for events caused by BK channels. Finally, it is of considerable interest that STOCs occur at a potential of −80 mV (Fig. 3 A, bottom), given the Ca2+ sensitivity of BK channels in these cells (see discussion).
Figure 3.

STOCs arise from openings of BK channels. (A) Dependence of STOCs on extracellular K+ and membrane potential. The voltage was increased in stepwise fashion, as shown, at two different concentrations of external K+. (B) Blockade of STOCs by iberiotoxin (100 nM).
Ca2+ Sparks Occur in the Absence of Extracellular Ca2+
Considerable evidence has accumulated in other smooth muscle cells and in neurons that the Ca2+ causing STOCs is from an intracellular source as opposed to entry through the surface membrane (Brown at al., 1983; Bolton and Imaizumi, 1996). This is consistent with the idea that STOCs are caused by Ca2+ sparks and that Ca2+ sparks are due to release of Ca2+ from intracellular stores. To establish the source of Ca2+ sparks in these cells, we tested whether spontaneous Ca2+ sparks that occur at −80 mV are independent of extracellular Ca2+. As shown in Fig. 4, the frequency and amplitude of the sparks were unchanged in the presence and absence of extracellular Ca2+ at this holding potential. (To eliminate extracellular Ca2+, 50 μM EGTA was added to a nominally Ca2+-free solution. Sparks were then monitored for a period that ranged from 3 to 10 min after superfusion with this solution. Longer periods in Ca2+-free solution were not employed to avoid effects due to possible depletion of intracellular stores.) Spark amplitude and rate were 10.9 ± 0.93% and 0.5 ± 0.24/s, respectively, in the presence of extracellular Ca2+, values that were not significantly different from 9.4 ± 0.9% and 0.45 ± 0.30/s in its absence (n = 4 cells). Hence, Ca2+ sparks do not require Ca2+ entry through the surface membrane. We then went on to establish in direct fashion that SR Ca2+ is the source of Ca2+ sparks and therefore the cause of STOCs.
Figure 4.
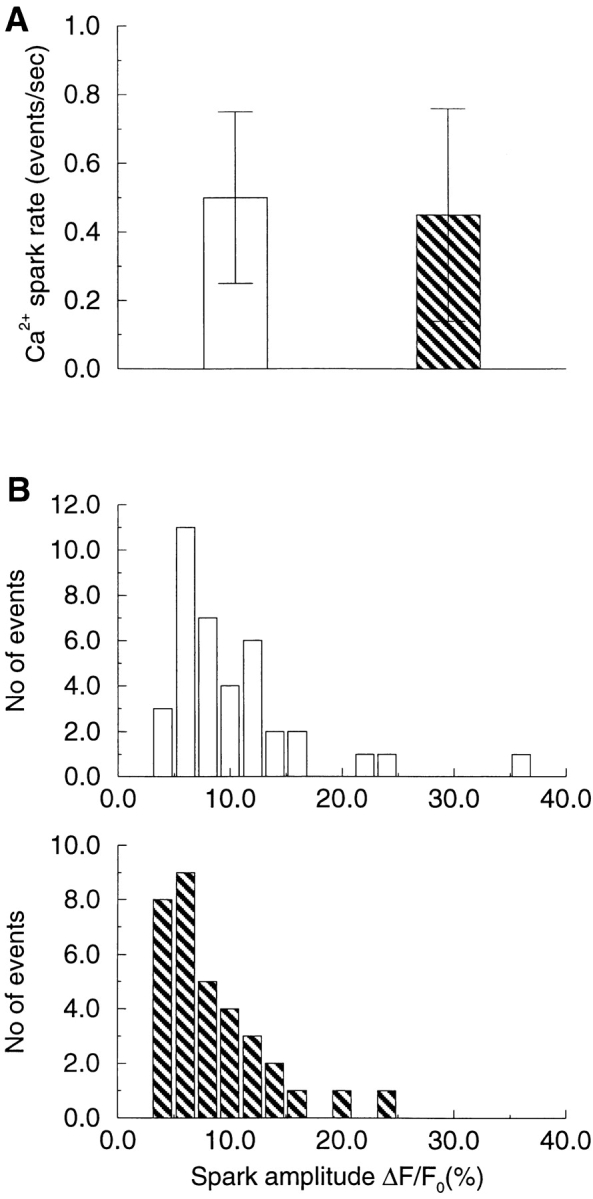
Ca2+ sparks occur without Ca2+ entry through the surface membrane. At a holding potential of −80 mV, Ca2+ sparks were recorded from each cell in the presence of extracellular Ca2+ (1.8 mM), and then for a period of 10 min or less after removal of extracellular Ca2+. The Ca2+-free environment was established by superfusing cells with nominally Ca2+-free solution containing 50 μM EGTA. The spark rate (A) and amplitude (B) were the same in the presence (open bars) and absence (striped bars) of extracellular Ca2+.
Mag-Fura-2 Measures [Ca2+]SR
To directly evaluate the role of [Ca2+]SR in the generation of Ca2+ sparks and STOCs, we employed the following method to measure Ca2+ in internal stores based on techniques used in other cell types (Hofer and Machen, 1993; Chatton et al., 1995; Mlinar and Fay, 1995). Cells were incubated with the esterified form of the low affinity calcium indicator, mag-fura-2. Upon entering the cells, mag-fura-2 acetoxymethylester was hydrolyzed and trapped both in the cytosol and other intracellular compartments (Williams et al., 1985). A tight-seal, whole-cell patch recording configuration was then used to dialyze the cytosol against the contents of the patch pipette. Upon rupture of the patch membrane, the fluorescence ratio gradually increased (Fig. 5 A), indicating that the nondialyzable dye was trapped in a compartment containing higher free [Ca2+] than that in the bulk cytosol. The following experiments were carried out to determine if this compartment was indeed the SR.
Figure 5.

Mag-fura-2 detects free Ca2+ concentration in sarcoplasmic reticulum. (A) After loading of mag-fura-2 into the cytoplasm and the intracellular stores by incubation with the esterified form of the dye, tight-seal whole-cell recording was begun at time 0, which denotes the occurrence of membrane breakthrough. Fluorescence from a no-nuclear region of the cell was sampled for 10 s at 2-min intervals as shown. The fluorescence ratio increased as dye was dialyzed away, indicating that the dye remaining in the cell was trapped in a compartment with high [Ca2+]. (B) Mag-fura-2 signal in single smooth muscle cells responds to caffeine and thapsigargin (TG), consistent with localization of the dye in the SR. Trace shows effect of caffeine before and after treatment with TG on the fluorescence ratio in a single cell dialyzed as in A. The recording was stopped for 5 min (first gap) after the first brief application of caffeine; it was stopped again for 5 min after application of 1 μM TG (second gap). Note that by itself TG had no effect on fluorescence ratio over this 5-min period, as is evident by the fact that the trace did not shift after the second 5-min gap. Caffeine (20 mM) was applied locally from a puffer pipette for 3 s at the times indicated by the bars. (C) Mag-fura-2 signal did not change in response to the application of the mitochondria uncoupler carbonyl cyanide p-trifluoromethoxy-phenylhydrazone (FCCP; 1 μM). The recording was stopped for 3 min as indicated by the gap in the trace. (D) Carbachol (100 μM) applied locally for 3 s induced a decrease in the mag-fura-2 ratio, consistent with an SR localization of the indicator.
Since caffeine activates RyRs causing Ca2+ release from the SR (Xu et al., 1994), the effect of caffeine on the mag-fura-2 signal was examined. As shown in Fig. 5 B, the fluorescence ratio decreased rapidly in response to caffeine (20 mM). After cessation of caffeine application, the fluorescence ratio recovered back towards its prestimulus level, but this recovery was completely blocked in the presence of 1 μM thapsigargin (Fig. 5 B), an inhibitor of SR calcium pumps (Thastrup et al., 1990). In contrast, a mitochondrial uncoupler, the protonophore carbonyl cyanide p -trifluoromethoxy-phenylhydrazone (1 μM), which inhibits Ca2+ uptake by mitochondria in these cells (Drummond and Fay, 1996), had no effect on the mag-fura-2 fluorescence ratio (Fig. 5 C). Carbachol (100 μM), an inositol 1,4,5-trisphosphate–producing agent, caused a decrease followed by a recovery in fluorescence ratio, although this decrease was less than that caused by 20 mM caffeine (Fig. 5 D). In another set of experiments, inclusion of 100 μM ryanodine (Xu et al., 1994) in the patch pipette also led to a decline in the mag-fura-2 fluorescence ratio, albeit more slowly, to about the same level observed with caffeine (data not shown). In summary, the sensitivity of the mag-fura-2 signal to agents known to act on the SR indicates that the mag-fura-2 signal arises principally from the SR in these cells. This conclusion is also supported by an earlier demonstration that mag-fura-2 displays the same submembranous distribution pattern in these cells as does calsequestrin, which is localized to SR (Steenbergen and Fay, 1996). Finally, mag-fura-2 has also been demonstrated to be a reliable indicator of [Ca2+]SR in A7r5 cells, a cell line derived from rat aorta smooth muscle cells (Sugiyama and Goldman, 1995).
The Relationship between [Ca2+]SR and STOCs: Simultaneous Measurements of [Ca2+]CYTO, [Ca2+]SR, and STOCs
Having established the methods to directly measure [Ca2+]SR, we then sought to examine the relationship between [Ca2+]SR, [Ca2+]CYTO, and the generation of STOCs. To do so, we simultaneously monitored, at high temporal resolution, mag-fura-2 fluorescence originating from the SR and Ca2+ Green fluorescence originating from the cytosol. We used the same experimental approach as above to load mag-fura-2, but for these experiments Ca2+ green was included in the patch pipette. Brief exposure to caffeine (Fig. 6) caused a prompt release of Ca2+ from the SR, as indicated by a rise in [Ca2+]CYTO and a fall in [Ca2+]SR. [Ca2+]CYTO returned rapidly (t 1/2 = 4.6 ± 0.7 s) to normal resting levels, whereas it took well over 10× as long for the [Ca2+]SR to return to its resting level (t 1/2 = 62.8 ± 5.8 s; n = 12). As can be seen from Fig. 6, the recovery of the STOCs began well after global [Ca2+]CYTO had returned to an unchanging resting level and hence STOC frequency is not a function of global [Ca2+]CYTO during this period.
Figure 6.

The reappearance of STOCs after a brief caffeine stimulation is correlated with refilling of SR with Ca2+, but not with global [Ca2+]CYTO. [Ca2+]CYTO (top), [Ca2+]SR (middle), and STOCs (bottom) at rest and in response to a brief (3-s) caffeine application measured simultaneously in a single smooth muscle cell voltage clamped at 0 mV. [Ca2+]SR was determined ratiometrically using mag-fura-2 as outlined above. [Ca2+]CYTO was determined from changes in the fluorescence of Ca2+ Green using a value for resting [Ca2+]CYTO of 100 nM. (The current record is briefly interrupted shortly after caffeine application as the recording saturated at the gain required to observe STOCs for the majority of the recording.)
We next analyzed STOC activity during the period after [Ca2+]CYTO had returned to rest and while the SR was still refilling. Although the refilling of the SR was always at least an order of magnitude slower than the restoration of [Ca2+]CYTO to resting levels after caffeine application (see discussion), there was considerable variation from cell to cell in the rate of SR refilling. Based on the rate of restoration of [Ca2+]SR, we grouped the cells into two classes: “fast” ([Ca2+]SR restored to the precaffeine level in 200 s or less) and “slow” (full SR recovery not achieved within 200 s). The mean time for recovery to 80% of precaffeine levels for the fast and slow groups was 47.8 ± 18.0 s (n = 4) and 174.9 ± 17.3 s (n = 5), respectively. Representative examples of recovery from a cell in the fast and slow groups are shown in Fig. 7 A. Once STOCs ceased following discharge of Ca2+ from the SR, they reappeared at appreciable frequency only after the SR refilled to 60% or more of the resting level. The recovery of STOC frequency and amplitude after caffeine application is plotted as a function of normalized [Ca2+]SR in Fig. 7 B. Despite the substantial variation in recovery time, both the fast and slow groups show the same relationship between [Ca2+]SR and STOCs, indicating that the lapse of time after caffeine application did not account for the change in STOC function. STOC frequency generally showed the most marked recovery at levels in excess of 80% of resting [Ca2+]SR (Fig. 7 B). Thereupon, STOC frequency increased steeply with progressive refilling of the SR so that the relationship between [Ca2+]SR and STOC frequency was most marked as the original precaffeine level was approached. Not only did the frequency of STOCs increase with refilling, but their amplitude also increased as expected on the basis of an increase in the electrochemical gradient for Ca2+ across the SR membrane. However, the increase in STOC amplitude was more linear than the increase in frequency.
Figure 7.

STOC frequency and amplitude are functions of luminal [Ca2+] regardless of refilling rate. (A) Recordings from representative cells showing fast and slow recovery of [Ca2+]SR and corresponding STOCs. Time course of normalized [Ca2+]SR for the two cells (top) and STOCs (middle and bottom) after 3-s caffeine application that ended at time 0. (B) STOC amplitude (top) and frequency (bottom) as a function of [Ca2+]SR as the SR reloads after a 3-s caffeine application. STOC frequency and amplitude were determined for intervals in each record corresponding to 5% increases (for slowly refilling cells) and 10 or 15% increases (for fast refilling cells) in [Ca2+]SR during refilling. The data for each of the cells (four in the fast group and five in the slow group) are normalized to the values in each cell before caffeine application.
Relationship between [Ca2+]SR and Ca2+ Sparks
The dependence of STOCs on the degree of SR Ca2+ refilling suggests that Ca2+ sparks should also show the same dependence. However, since BK channel activity can be affected by factors other than Ca2+ sparks, it is possible that the Ca2+ sparks might bear a different relationship to [Ca2+]SR. Hence, we also examined the time course of Ca2+ spark recovery after SR depletion with caffeine. After a 3-s caffeine application, Ca2+ sparks were imaged for a 2-s period at intervals of 30 s. The results of these experiments are given in Fig. 8 A, where spark frequency (•) and amplitude (□) are plotted as a function of the time after caffeine application. Software limitations of the digital imaging system presently preclude simultaneous measurements of Ca2+ sparks at high time resolution and [Ca2+]SR. However, the relationship between the time course of refilling and the level of [Ca2+]SR at each point in time allowed us to determine the approximate relationship between [Ca2+]SR and Ca2+ spark recovery. (The recovery of the STOC frequency and amplitude within 200 s in these cells indicated that SR refilling was essentially complete within this time and hence followed a fast time course; see Fig. 7 A.) The pattern of recovery of the Ca2+ sparks was qualitatively similar to that of the STOCs (Fig. 8 B). That is, there was a steep relation between Ca2+ spark frequency and [Ca2+]SR at levels when the [Ca2+]SR approached control levels; i.e., at [Ca2+]SR in excess of 80% of control levels. As with the STOCs, the amplitude of the Ca2+ sparks recovered as the stores reloaded, as expected for an increase in the electrochemical driving force on Ca2+ across the SR membrane.
Figure 8.
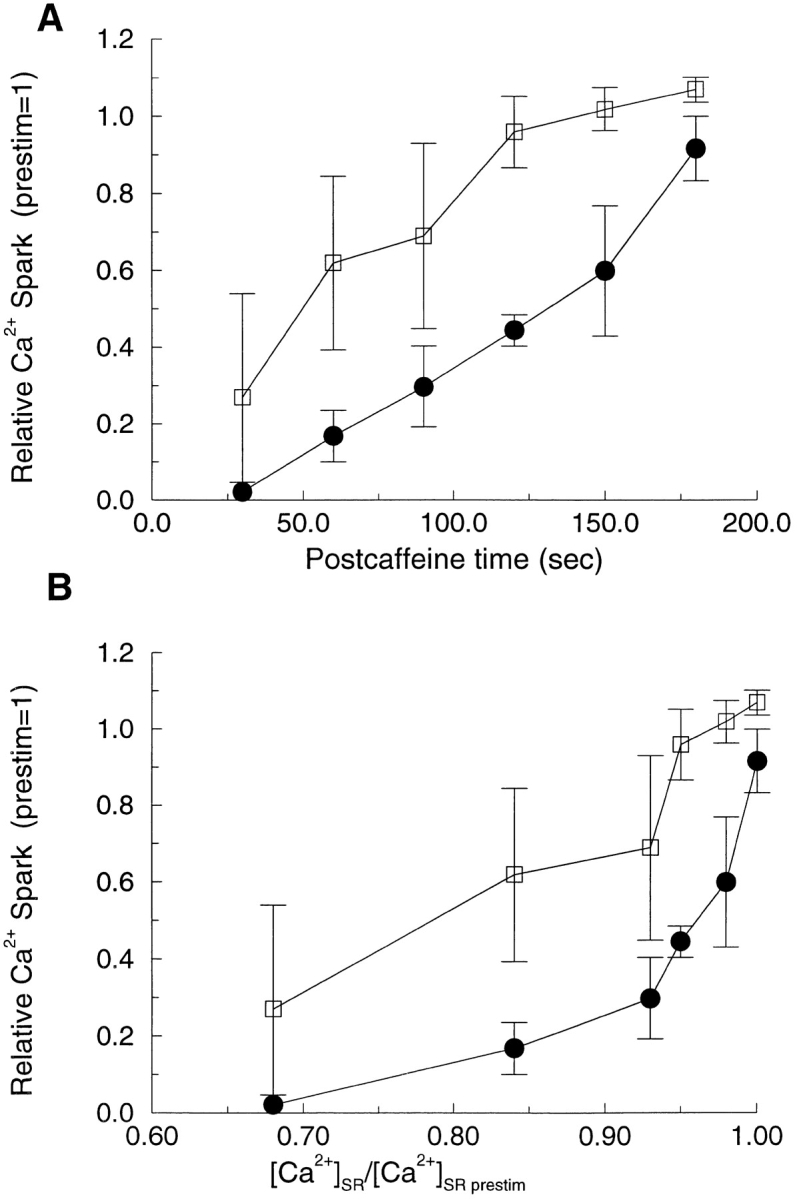
Relationship between [Ca2+]SR and Ca2+ sparks. (A) Relationship between time after a 3-s caffeine application and amplitude (□) and frequency (•) for Ca2+ sparks. After the caffeine application, Ca2+ sparks ceased, and then recovered as the SR refilled. (B) Relationship between fractional [Ca2+]SR and spark frequency (•) and amplitude (□) determined as described in the text. Images were acquired as in Fig. 2, and the amplitude and frequency of Ca2+ sparks were normalized to values before the application of caffeine (n = 4 cells).
discussion
Ca2+ Sparks Trigger STOCs
When spontaneous miniature outward currents due to BK channel openings were first observed in neurons almost two decades ago, Brown et al. (1983) demonstrated that the source of the Ca2+ was intracellular and speculated that “packets of Ca2+” were released from intracellular stores and acted as intracellular messengers. When STOCs were first reported in smooth muscle cells over a decade ago (Benham and Bolton, 1986), a similar explanation was advanced. The observation of Ca2+ “puffs” in Xenopus oocytes (Parker and Yao, 1991) and Ca2+ sparks in cardiac (Cheng et al., 1993) and skeletal (Tsugorka et al., 1995) myocytes was soon followed by the observation of similar Ca2+ sparks in single smooth muscle cells by Nelson et al. (1995), and then by Mirroneau et al. (1996). In the present study, we used a high-speed imaging system to record Ca2+ sparks and STOCs simultaneously in the same cell, which allowed us to compare them in detail. We found that there is a close association between the occurrence of Ca2+ sparks and STOCs and that Ca2+ sparks and their corresponding STOCs have similar time courses. (In other smooth muscle types, however, the Ca2+ sparks have a longer time course than the STOCs they cause; Kirber et al., 1998). Furthermore, changes in Ca2+ spark frequency and amplitude were always paralleled by changes in STOC frequency and amplitude when the SR was depleted by caffeine and subsequently refilled. Thus, our findings provide additional evidence for the causal link between Ca2+ sparks and STOCs.
How Can a 100-nM Increase Over the Resting Cytosolic [Ca2+] Cause a STOC?
The peak spark amplitude measured with fluo-3 averaged ∼10% (ΔF/F0 × 100), and the resting [Ca2+]CYTO measured ratiometrically with fura-2 in these cells is consistently ∼100 nM (Drummond and Fay, 1996). Using this value for resting [Ca2+], the mean ΔF/F0 converts to a mean change in [Ca2+], at the peak, of ∼100 nM,2 leading to a mean total [Ca2+] at the peak of ∼200 nM in the brightest pixel in a given spark, assuming equilibrium between Ca2+ and fluo-3. Is this sufficient to cause openings of BK channels in this cell type at 0 mV, the potential at which we measured STOCs and Ca2+ sparks simultaneously? The best answer to this question comes from consideration of earlier studies of BK channels in excised, inside-out patches in the same cells used here (Singer and Walsh, 1987). There, the probability of a channel's being in the open state (P o) at 0 mV in the presence of 100 nM Ca2+ was essentially 0 (see Fig. 6 in Singer and Walsh, 1987), and an order of magnitude increase in [Ca2+] to 1 μM caused a P o of only ∼0.1. Thus, it appears that a [Ca2+]CYTO of ∼200 nM is not sufficient to cause substantial BK channel opening at 0 mV.
How are we to explain this apparent contradiction? Three considerations lead strongly to the explanation that the BK channels lie close enough to the SR Ca2+ release site so that the channels sense a much higher concentration than the average we measured. First, there is considerable work on modeling the diffusion-reaction events that occur near a point source of Ca2+ release in the presence of calcium buffering (Stern, 1992; Naraghi and Neher, 1997). The results from such studies indicate that the fluo-3 is not in equilibrium with Ca2+ emerging from the point of SR release at distances smaller than our pixel sizes (333 × 333 nm). Thus, [Ca2+]CYTO very close to the point of SR release could be many micromolar, given that Ca2+ currents through the release channels are in the range of 1 pA (Mejia-Alvarez et al., 1998). If the BK channels are very close to an SR release site, then they will sense a [Ca2+] in the micromolar range that is sufficient to activate them at 0 mV.
Second, in earlier studies on excised inside-out patches in these cells, we calculated the minimum density of the BK channels to be on the order of 1 channel/μm2, based on an assumption of uniform channel density (Singer and Walsh, 1987). But such a uniform distribution would place only three BK channels in the 3-μm2 region, which is the area over which the Ca2+ elevation occurs during the spark. Since even at a [Ca2+]CYTO of 1 μM, the P o is 0.1, less than one BK channel would be open at any one time in this region. And in most of this 3-μm2 region, the increase in [Ca2+] is less than that at the center of the spark, where it averages 200 nM. But the mean STOC amplitude is ∼30 pA, requiring six BK channels to be open simultaneously.
Third, and perhaps most convincingly, is the simple observation that inverted STOCs of substantial amplitude (20–30 pA) can be recorded even at −80 mV (Fig. 3) when the external K+ is elevated. At this potential, the Ca2+ sparks average 10% (Fig. 4). However, from earlier studies on excised patches, we know that 10 μM [Ca2+]CYTO is required for a P o of 0.1 at this potential (see Fig. 6 in Singer and Walsh, 1987). Hence, the BK channels must lie close to the SR release site. In summary, these considerations lead to two conclusions: an SR Ca2+ release site causing a Ca2+ spark must lie close to BK channels, and the BK channels responsible for a STOC must be clustered. Thus, the spark-STOC site may be a distinct morphological specialization much like a synaptic vesicle release site.
Cytosolic [Ca2+] Recovers an Order of Magnitude Faster than SR [Ca2+] after Caffeine-induced SR Depletion
This study provides the first direct measure of the temporal relationship between [Ca2+]CYTO and [Ca2+]SR in response to depletion of SR Ca2+ stores in smooth muscle cells and in myocytes of any type. After stimulation with caffeine, recovery of SR Ca2+ was ∼10× slower than cytosolic Ca2+. Thus, the correspondence of Ca2+ spark and STOC frequency with [Ca2+]SR rather than with [Ca2+]CYTO was readily apparent. Since the rise in [Ca2+]CYTO due to release from the SR fell back to rest well before [Ca2+]SR recovered, much of the cytosolic Ca2+ must be either bound to myoplasmic buffering sites with slow off rates or cleared into another, optically silent compartment before gradually reappearing as SR Ca2+. Some fraction of the Ca2+ that refills the SR may come directly from the cell exterior, although we detected no macroscopic inward current at a holding potential of −80 mV after caffeine-induced depletion. There is evidence in these cells to indicate that mitochondria constitute the third compartment. It has been demonstrated that mitochondria sequester a portion of the elevated Ca2+ caused by activation of voltage-gated Ca2+ channels in these cells (Drummond and Fay, 1996). More recently, it has been shown that mitochondria sequester Ca2+ released from the SR so that the time course or recovery of SR and mitochondrial Ca2+ parallel one another as the sequestered Ca2+ exits the mitochondria and recharges the SR (Drummond et al., 1997). This mechanism is consistent with observations that SR and mitochondria are located in close apposition in smooth muscle cells (Nixon et al., 1994; see also Rizzuto et al., 1998). Given these facts, it is also possible that mitochondria make a contribution to the regulation of Ca2+ sparks, although there is no evidence for this as yet.
What Is the Link between [Ca2+]SR and the Frequency of Ca2+ Sparks and STOCs?
Studies on RyRs in artificial lipid bilayers support our conclusion that at least a portion of the increase in frequency of Ca2+ sparks (and consequently STOCs) that we observe at higher [Ca2+]SR is due to regulation of RyR gating by [Ca2+]SR. RyRs from the cells used in the present study have been partially purified from microsomal membranes and reconstituted into lipid bilayers, where they gave rise to single channel currents whose frequency of opening increased as the [Ca2+] was elevated on the side of the bilayer corresponding to the luminal surface (Xu et al., 1994). Moreover, the RyRs from this amphibian preparation appear to be quite like those in mammalian cardiac cells, although not identical to them (Xu et al., 1994). In both cardiac and skeletal muscle, there is a great deal of evidence from studies in artificial bilayers that luminal [Ca2+] increases the probability of RyR channels being in the open state, although the precise site of this action remains in doubt (Ikemoto et al., 1991; Gilchrist et al., 1992; Sitsapesan and Williams, 1994; 1995; Donoso et al., 1995; Lukyanenko et al., 1996; Tripathy and Meissner, 1996). Nevertheless, we cannot exclude the possibility that the lower apparent frequency of Ca2+ sparks at lower SR Ca2+ levels is due to small amplitude events (resulting from decreased driving force on SR Ca2+) that escape detection (Song et al., 1997). However, if this explanation is true, then the same measurement bias affected two separate and independent measures; that is, electrophysiological recording of STOCs and optical detection of Ca2+ sparks, in the same way. Finally, the precise mechanism of SR Ca2+ action might matter little as far as the physiological outcome is concerned. That is, an increase in [Ca2+]SR leads to an increase in total outward current whether due to an increase in STOC frequency or amplitude or both, and an increase in outward current will lead to hyperpolarization of the membrane with all the attendant consequences (see Nelson et al., 1995).
Physiological Role of [Ca2+]SR as a Regulator of Ca2+ Sparks in Smooth Muscle Cells
The present study makes it clear that as the SR stores attain higher levels of free Ca2+ there will be an increase in both the frequency and amplitude of Ca2+ sparks and the STOCs that they cause. Moreover, the relationship between [Ca2+]SR and spark (and STOC) frequency becomes quite steep when the SR refills to 80% or more of its resting level. Thus, [Ca2+]SR is potentially an important regulator of spark (and STOC) frequency. However, this study should not be taken to mean that [Ca2+]SR is the only regulator of sparks and STOCs. This caveat is quite important when considering the role of voltage-activated Ca2+ channels in regulating sparks. For there is now evidence that Ca2+ entry through voltage-gated Ca2+ channels in smooth muscle can elicit Ca2+ sparks even when the depolarizations used to activate these Ca2+ channels are quite brief (Arnaudeau et al., 1997; ZhuGe et al., 1998b). This sort of spark induction by depolarization would appear to be due to a local control mechanism, perhaps together with increased SR Ca2+ load, as is the case in cardiac cells (see Cannell et al., 1995). In other instances, however, it may be that global [Ca2+]SR is the dominant intermediary in regulation of spark frequency. For example, it is possible, although as yet unproven, that some neurotransmitters or cyclic nucleotides, which alter spark frequency (Porter et al., 1998), act in part by altering [Ca2+]SR.
Acknowledgments
We thank Jeffrey Carmichael, Rebecca McKinney, Brian Packard, Paul Tilander, and Yu Yan for excellent technical assistance. We thank Michael Kirber, Robert Drummond, Stephen Sims, and Lawrence Lifshitz for helpful comments and discussion. We dedicate this paper to our colleague, Fredric S. Fay, who died tragically midway through this study and whose friendship, vision, and passion for science made him an ideal colleague.
This study was supported in part by National Institutes of Health grants to F.S. Fay and J.V. Walsh, Jr., and a National Science Foundation grant to R.A. Tuft and Walter Carrington.
Abbreviations used in this paper
- BK channel
Ca2+-activated potassium channel
- RyR
ryanodine receptor
- SR
sarcoplasmic reticulum
- STOC
spontaneous transient outward current
Footnotes
The ability of the ultrafast microscope to resolve and measure highly localized calcium signals was examined using a computer simulation of Ca2+ sparks of known peak [Ca2+] as imaged inside a model cell. Fluorescence ratios (ΔF/F0) were calculated from simulated images of a range of spark [Ca2+] amplitudes, both in and out of focus. From these simulations, we estimated that an observed average spark amplitude of 10% (ΔF/F0) is consistent with a peak spark [Ca2+] of 200 nM, or 100 nM above resting [Ca2+]. This estimate was made in the following way.
First, the fluorescence intensity distribution of a typical Ca2+ spark inside a smooth muscle cell was simulated. Custom software was used to calculate the three-dimensional image of a model smooth muscle cell filled with 50 μM fluo-3 (K d = 390 nM) in equilibrium with a resting [Ca2+] of 100 nM. The cell was modeled as a cylinder with cross-sectional diameters of 10 μm in the transverse direction and 6 μm in the axial direction, the direction of focus in the microscope, and of infinite length with respect to the imaging. These dimensions were previously derived from three-dimensional reconstructions of toad gastric smooth muscle cells (our unpublished data). The three-dimensional fluorescence intensity distribution was calculated assuming bound fluo-3 was 100× as fluorescent as the free species. At resting [Ca2+], ∼25% of the fluo-3 was bound to Ca2+ and the fluorescence signal at rest was ∼20% of the maximum attainable with saturating Ca2+.
Second, the spatial [Ca2+] profile of a Ca2+ spark was added to the simulated resting cell. A Ca2+ spark was modeled as a stationary, Gaussian spot of calcium with a known peak [Ca2+] and a spatial full width at half-maximum amplitude of 1.7 μm. This simulates the spark at a single point in time, corresponding to the observed images of sparks at the time of peak fluorescence intensity. The Ca2+ spark was added to the resting cell model with the spark peak at the center of the cell, and the corresponding three-dimensional image of fluo-3 distribution was calculated as for the resting cell alone. The center of the cell was used to avoid having to simulate the effect of the cell membrane on diffusion. Since the fluorescence background due to resting [Ca2+] is likely highest at the center, where the cell is thickest, this is probably the worst case, for our purposes, for measuring ΔF/F0.
Next, the image formation and acquisition was simulated. The three-dimensional fluorescence image of the cell and spark was blurred with the three-dimensional image of a theoretical, wide-field, point spread function, for a 1.3 NA objective lens (Nikon Inc.) calculated at 530 nm wavelength (Tella, 1985). The image resolution was decreased to 300-nm pixels, by adding three-by-three groups of pixels, in order to simulate the image formation (point spread function) and acquisition (camera pixelization) process. The resulting three- dimensional image contained images of the spark in and out of focus, as seen against the fluorescence background arising from the global resting [Ca2+].
Lastly, using the blurred images of the cell with and without the spark, the fluorescence ratios (ΔF/F0) were calculated at the pixel corresponding to the spark center, at 200-nm focus steps through the 6-μm depth of the cell. The effect of uncertainty in focus was examined by weighting the ΔF/F0 calculated at each depth through the cell by the probability of a spark occurring at that depth. Although the modeled spark was located in the cell center, the model used for spark spatial distribution assumed that sparks were constrained to occur at the outer edge of the cell, adjacent to the plasma membrane, and were equally likely to occur anywhere along the plasma membrane. A spark with a known peak [Ca2+] of 200 nM (100 nM above resting [Ca2+]) yielded a ΔF/F0 of 18% when in focus (centered in depth) and 5.5% when 3 μm out of focus (top or bottom of cell). After accounting for the effects of spark location on focus, the average ΔF/F0 was 10%, a value equivalent to the average observed spark peak amplitude described in this report.
References
- Arnaudeau S, Boittin FX, Macrez N, Lavie JL, Mironneau C, Mironneau J. L-type and Ca2+ release channel–dependent hierarchical Ca2+signaling in rat portal vein myocytes. Cell Calc. 1997;22:399–411. doi: 10.1016/s0143-4160(97)90024-5. [DOI] [PubMed] [Google Scholar]
- Becker PL, Fay FS. Photobleaching of Fura-2 and its effect on determination of calcium concentrations. Am J Physiol. 1987;253:C613–C618. doi: 10.1152/ajpcell.1987.253.4.C613. [DOI] [PubMed] [Google Scholar]
- Becker PL, Walsh JV, Singer JJ, Fay FS. Regulation of [Ca2+] in voltage-clamped single smooth muscle cells. Science. 1989;244:211–214. doi: 10.1126/science.2704996. [DOI] [PubMed] [Google Scholar]
- Benham CD, Bolton TB. Spontaneous transient outward currents in single visceral and vascular smooth muscle cells of rabbit. J Physiol (Camb) 1986;381:385–406. doi: 10.1113/jphysiol.1986.sp016333. [DOI] [PMC free article] [PubMed] [Google Scholar]
- Berridge MJ. Elementary and global aspects of calcium signaling. J Physiol (Camb) 1997;499:291–306. doi: 10.1113/jphysiol.1997.sp021927. [DOI] [PMC free article] [PubMed] [Google Scholar]
- Bolton TB, Imaizumi Y. Spontaneous transient outward currents in smooth muscle cells. Cell Calc. 1996;20:141–152. doi: 10.1016/s0143-4160(96)90103-7. [DOI] [PubMed] [Google Scholar]
- Brown DA, Constanti A, Adams PR. Ca-activated potassium current in vertebrate sympathetic neurones. Cell Calc. 1983;4:407–420. doi: 10.1016/0143-4160(83)90017-9. [DOI] [PubMed] [Google Scholar]
- Cannell MB, Cheng H, Lederer WJ. The control of calcium release in heart muscle. Science. 1995;268:1045–1049. doi: 10.1126/science.7754384. [DOI] [PubMed] [Google Scholar]
- Chatton J-Y, Liu H, Stucki JW. Simultaneous measurements of Ca2+ in the intracellular stores and the cytosol of hepatocytes during hormone-induced Ca2+oscillations. FEBS Lett. 1995;368:165–168. doi: 10.1016/0014-5793(95)00632-j. [DOI] [PubMed] [Google Scholar]
- Cheng H, Lederer WJ, Cannell MB. Calcium sparks: elementary events underlying excitation–contraction coupling in heart muscle. Science. 1993;262:740–744. doi: 10.1126/science.8235594. [DOI] [PubMed] [Google Scholar]
- Cheng H, Lederer MR, Lederer WJ, Cannell MB. Calcium sparks and [Ca2+]iwaves in cardiac myocytes. Am J Physiol. 1996;270:C148–C159. doi: 10.1152/ajpcell.1996.270.1.C148. [DOI] [PubMed] [Google Scholar]
- Donoso P, Prieto H, Hidalgo C. Luminal calcium regulates calcium release in triads isolated from frog and rabbit skeletal muscle. Biophys J. 1995;68:507–515. doi: 10.1016/S0006-3495(95)80212-2. [DOI] [PMC free article] [PubMed] [Google Scholar]
- Drummond RM, Fay FS. Mitochondria contribute to Ca2+removal in smooth muscle cells. Pflügers Arch. 1996;431:473–482. doi: 10.1007/BF02191893. [DOI] [PubMed] [Google Scholar]
- Drummond RM, Bowman DS, Tuft RA, Fay FS. Relationship of mitochondrial Ca2+ homeostasis to [Ca2+] in the cytosol and sarcoplasmic reticulum in smooth muscle cells. Biophys J. 1997;72:185. . (Abstr.) [Google Scholar]
- Fay FS, Hoffman R, Leclair S, Merriam P. Preparation of individual smooth muscle cells from the stomach of Bufo marinus. . Methods Enzymol. 1982;85:284–291. doi: 10.1016/0076-6879(82)85027-1. [DOI] [PubMed] [Google Scholar]
- Galvez A, Gimenez-Gallego G, Reuben JP, Roy-Contancin L, Feigenbaum P, Kaczorowski GJ, Garcia ML. Purification and characterization of a unique, potent, peptidyl probe for the high conductance calcium-activated potassium channel from venom of the scorpion Buthus tamulus. . J Biol Chem. 1990;265:11083–11090. [PubMed] [Google Scholar]
- Gilchrist JSC, Belcastro AN, Katz S. Intraluminal Ca2+ dependence of Ca2+ and ryanodine-mediated regulation of skeletal muscle sarcoplasmic reticulium Ca2+release. J Biol Chem. 1992;267:20850–20856. [PubMed] [Google Scholar]
- Golovina VA, Blaustein MP. Spatially and functionally distinct Ca2+stores in sarcoplasmic and endoplasmic reticulum. Science. 1997;275:1643–1648. doi: 10.1126/science.275.5306.1643. [DOI] [PubMed] [Google Scholar]
- Gordienko DV, Bolton TB, Cannell MB. Variability in spontaneous subcellular calcium release in guinea-pig ileum smooth muscle cells. J Physiol (Camb) 1998;507:707–720. doi: 10.1111/j.1469-7793.1998.707bs.x. [DOI] [PMC free article] [PubMed] [Google Scholar]
- Grynkiewicz G, Poenie M, Tsien RY. A new generation of Ca2+indicators with greatly improved fluorescence properties. J Biol Chem. 1985;260:3440–3450. [PubMed] [Google Scholar]
- Hamill OP, Marty A, Neher E, Sakmann B, Sigworth FJ. Improved patch-clamp techniques for high-resolution current recording from cells and cell-free membrane patches. Pflügers Arch. 1981;391:85–100. doi: 10.1007/BF00656997. [DOI] [PubMed] [Google Scholar]
- Hernandez-Cruz A, Sala F, Adams PR. Subcellular calcium transients visualized by confocal microscopy in a voltage-clamped vertebrate neuron. Science. 1990;247:858–862. doi: 10.1126/science.2154851. [DOI] [PubMed] [Google Scholar]
- Hofer AM, Machen TE. Technique for in situ measurement of calcium in intracellular inositol 1,4,5-trisphosphate-sensitive stores using the fluorescent indicator mag-fura-2. Proc Natl Acad Sci USA. 1993;90:2598–2602. doi: 10.1073/pnas.90.7.2598. [DOI] [PMC free article] [PubMed] [Google Scholar]
- Hofer AM, Schulz I. Quantification of intraluminal free [Ca] in the agonist-sensitive internal calcium store using compartmentalized fluorescent indicators: some considerations. Cell Calc. 1996;20:235–242. doi: 10.1016/s0143-4160(96)90029-9. [DOI] [PubMed] [Google Scholar]
- Ikemoto N, Antoniu B, Kang J-J, Meszaros LG, Ronjat M. Intravesicular calcium transient during calcium release from sarcoplasmic reticulum. Biochemistry. 1991;30:5230–5237. doi: 10.1021/bi00235a017. [DOI] [PubMed] [Google Scholar]
- Kirber MT, Etter EF, Singer JJ, Fay FS, Walsh JV., Jr Sparks and STOCs in esophageal smooth muscle cells. Dig Dis Sci. 1996;41:1893. . (Abstr.) [Google Scholar]
- Kirber MT, Bellve KD, Lifshitz LM, Tuft RA, Walsh JV, Jr, Fogarty KE. High speed 3-D imaging reveals differences between sparks that generate STOCs and those that do not. Biophys J. 1998;74:272. . (Abstr.) [Google Scholar]
- Lukyanenko V, Gyorke I, Gyorke S. Regulation of calcium release by calcium inside the sarcoplasmic reticulum in ventricular myocytes. Pflügers Arch. 1996;432:1047–1054. doi: 10.1007/s004240050233. [DOI] [PubMed] [Google Scholar]
- Mejia-Alvarez R, Kettlun C, Ríos E, Stern M, Fill M. Unitary calcium currents through cardiac ryanodine receptors under physiological conditions. Biophys J. 1998;74:58. doi: 10.1085/jgp.113.2.177. . (Abstr.) [DOI] [PMC free article] [PubMed] [Google Scholar]
- Mironneau J, Arnaudeau S, Macrez-Lepretre N, Boittin FX. Ca2+ sparks and Ca2+ waves activate different Ca2+-dependent ion channels in single myocytes from rat portal vein. Cell Calc. 1996;20:153–160. doi: 10.1016/s0143-4160(96)90104-9. [DOI] [PubMed] [Google Scholar]
- Mlinar B, Fay FS. Recording of free calcium and magnesium in intracellular stores in patch clamped smooth muscle cells. Biophys J. 1995;68:113. . (Abstr.) [Google Scholar]
- Naraghi M, Neher E. Linearized buffered Ca2+ diffusion in microdomains and its implications for calculation of [Ca2+] at the mouth of a calcium channel. J Neurosci. 1997;17:6961–6973. doi: 10.1523/JNEUROSCI.17-18-06961.1997. [DOI] [PMC free article] [PubMed] [Google Scholar]
- Nelson MT, Cheng H, Rubart M, Santana LF, Bonev AD, Knot HJ, Lederer WJ. Relaxation of arterial smooth muscle by calcium sparks. Science. 1995;270:633–637. doi: 10.1126/science.270.5236.633. [DOI] [PubMed] [Google Scholar]
- Nixon GF, Mignery GA, Somlyo AV. Immunogold localization of inositol 1,4,5-trisphosphate receptors and characterization of ultrastructural features of the sarcoplasmic reticulum in phasic and tonic smooth muscle. J Muscle Res Cell Motil. 1994;15:682–700. doi: 10.1007/BF00121075. [DOI] [PubMed] [Google Scholar]
- Parker I, Yao Y. Regenerative release of calcium from functionally discrete subcellular stores by inositol trisphosphate. Proc R Soc Lond B Biol Sci. 1991;246:269–274. doi: 10.1098/rspb.1991.0154. [DOI] [PubMed] [Google Scholar]
- Porter VA, Bonev AD, Knot HJ, Heppner TJ, Stevenson AS, Kleppisch T, Lederer WJ, Nelson MT. Frequency modulation of Ca2+sparks is involved in regulation of arterial diameter by cyclic nucleotides. Am J Physiol. 1998;274:C1346–C1355. doi: 10.1152/ajpcell.1998.274.5.C1346. [DOI] [PubMed] [Google Scholar]
- Quamme G, Dai L-J, Rabkin SW. Dynamics of intracellular free Mg2+changes in a vascular smooth muscle cell line. Am J Physiol. 1993;265:H281–H288. doi: 10.1152/ajpheart.1993.265.1.H281. [DOI] [PubMed] [Google Scholar]
- Rizzuto R, Pinton P, Carrington W, Fay FS, Fogarty KE, Lifshitz LM, Tuft RA, Pozzan T. Close contacts with the endoplasmic reticulum as determinants of mitochondrial Ca2+responses. Science. 1998;280:1763–1766. doi: 10.1126/science.280.5370.1763. [DOI] [PubMed] [Google Scholar]
- Santana LF, Kranias EG, Lederer WJ. Calcium sparks and excitation–contraction coupling in phospholamban-deficient mouse ventricular myocytes. J Physiol (Camb) 1997;503:21–29. doi: 10.1111/j.1469-7793.1997.021bi.x. [DOI] [PMC free article] [PubMed] [Google Scholar]
- Singer JJ, Walsh JV., Jr Characterization of calcium- activated potassium channels in single smooth muscle cells using the patch-clamp technique. Pflügers Arch. 1987;408:98–111. doi: 10.1007/BF00581337. [DOI] [PubMed] [Google Scholar]
- Sitsapesan R, Williams AJ. Regulation of the gating of the sheep cardiac sarcoplasmic reticulum Ca2+-release channel by luminal Ca2+ . J Membr Biol. 1994;137:215–226. doi: 10.1007/BF00232590. [DOI] [PubMed] [Google Scholar]
- Sitsapesan R, Williams AJ. The gating of the sheep skeletal sarcoplasmic reticulum Ca2+-release channel is regulated by luminal Ca2+ . J Membr Biol. 1995;146:133–144. doi: 10.1007/BF00238004. [DOI] [PubMed] [Google Scholar]
- Song L-S, Stern MD, Lakatta ED, Cheng H. Partial depletion of sarcoplasmic reticulum calcium does not prevent calcium sparks in rat ventricular myocytes. J Physiol (Camb) 1997;505:665–675. doi: 10.1111/j.1469-7793.1997.665ba.x. [DOI] [PMC free article] [PubMed] [Google Scholar]
- Steenbergen JM, Fay FS. The quantal nature of calcium release to caffeine in single smooth muscle cells results from activation of the sarcoplasmic reticulum Ca2+-ATPase. J Biol Chem. 1996;271:1821–1824. doi: 10.1074/jbc.271.4.1821. [DOI] [PubMed] [Google Scholar]
- Stern MD. Buffering of calcium in the vicinity of a channel pore. Cell Calc. 1992;13:183–192. doi: 10.1016/0143-4160(92)90046-u. [DOI] [PubMed] [Google Scholar]
- Sugiyama T, Goldman WF. Measurement of SR free Ca2+ and Mg2+in permeabilized smooth muscle cells with use of furaptra. Am J Physiol. 1995;269:C698–C705. doi: 10.1152/ajpcell.1995.269.3.C698. [DOI] [PubMed] [Google Scholar]
- Tella, L.L. 1985. The determination of a microscope's three- dimensional transfer function for use in image restoration. Master's Thesis, Worcester Polytechnic Institute, Worcester, MA.
- Thastrup O, Cullen PC, Drobak BK, Hanley MR, Dawson AP. Thapsigargin, a tumor promoter, discharges intracellular Ca2+ stores by specific inhibition of the endoplasmic reticulum Ca2+-ATPase. Proc Natl Acad Sci USA. 1990;87:2466–2470. doi: 10.1073/pnas.87.7.2466. [DOI] [PMC free article] [PubMed] [Google Scholar]
- Tripathy A, Meissner G. Sarcoplasmic reticulum lumenal Ca2+ has access to cytosolic activation and inactivation sites of skeletal muscle Ca2+release channel. Biophys J. 1996;70:2600–2615. doi: 10.1016/S0006-3495(96)79831-4. [DOI] [PMC free article] [PubMed] [Google Scholar]
- Tsugorka A, Ríos E, Blatter LA. Imaging elementary events of calcium release in skeletal muscle cells. Science. 1995;269:1723–1726. doi: 10.1126/science.7569901. [DOI] [PubMed] [Google Scholar]
- Williams DA, Fogarty KE, Tsien RY, Fay FS. Calcium gradients in single smooth-muscle cells revealed by the digital imaging microscope using fura-2. Nature. 1985;318:558–561. doi: 10.1038/318558a0. [DOI] [PubMed] [Google Scholar]
- Xu L, Lai FA, Cohn A, Etter E, Guerrero A, Fay FS, Meissner G. Evidence for a Ca2+-gated ryanodine-sensitive Ca2+release channel in visceral smooth muscle. Proc Natl Acad Sci USA. 1994;91:3294–3298. doi: 10.1073/pnas.91.8.3294. [DOI] [PMC free article] [PubMed] [Google Scholar]
- ZhuGe R, Tuft RA, Fogarty KE, Walsh JV., Jr Microdomains mediating generation of Ca2+sparks and STOCs in smooth muscle cells. Biophys J. 1998a;74:272. . (Abstr.) [Google Scholar]
- ZhuGe R, Tuft RA, Fogarty KE, Walsh JV., Jr Coupling of voltage-activated Ca2+ channels with Ca2+ sparks and Ca2+transients in smooth muscle. J Gen Physiol. 1998b;112:13a. . (Abstr.) [Google Scholar]