

Abstract
Simultaneous measurements of photocurrent and outer segment Ca2+ were made from isolated salamander cone photoreceptors. While recording the photocurrent from the inner segment, which was drawn into a suction pipette, a laser spot confocal technique was employed to evoke fluorescence from the outer segment of a cone loaded with the Ca2+ indicator fluo-3. When a dark-adapted cone was exposed to the intense illumination of the laser, the circulating current was completely suppressed and fluo-3 fluorescence rapidly declined. In the more numerous red-sensitive cones this light-induced decay in fluo-3 fluorescence was best fitted as the sum of two decaying exponentials with time constants of 43 ± 2.4 and 640 ± 55 ms (mean ± SEM, n = 25) and unequal amplitudes: the faster component was 1.7-fold larger than the slower. In blue-sensitive cones, the decay in fluorescence was slower, with time constants of 140 ± 30 and 1,400 ± 300 ms, and nearly equal amplitudes. Calibration of fluo-3 fluorescence in situ from red-sensitive cones allowed the calculation of the free-Ca2+ concentration, yielding values of 410 ± 37 nM in the dark-adapted outer segment and 5.5 ± 2.4 nM after saturating illumination (mean ± SEM, n = 8). Photopigment bleaching by the laser resulted in a considerable reduction in light sensitivity and a maintained decrease in outer segment Ca2+ concentration. When the photopigment was regenerated by applying exogenous 11-cis-retinal, both the light sensitivity and fluo-3 fluorescence recovered rapidly to near dark-adapted levels. Regeneration of the photopigment allowed repeated measurements of fluo-3 fluorescence to be made from a single red-sensitive cone during adaptation to steady light over a range of intensities. These measurements demonstrated that the outer segment Ca2+ concentration declines in a graded manner during adaptation to background light, varying linearly with the magnitude of the circulating current.
Keywords: phototransduction, retina, bleaching adaptation, light adaptation, calcium feedback
introduction
The concentration of Ca2+ in the outer segment of vertebrate photoreceptors is believed to be controlled by a dynamic balance of Ca2+ fluxes across the outer segment membrane. Ca2+ enters the outer segment through the cGMP-gated conductance as part of the circulating current (Yau and Nakatani, 1984a; Hodgkin et al., 1985), and is extruded by a Na+/Ca2+, K+ exchanger (Yau and Nakatani, 1984b; Cervetto et al., 1989). The activation of the photopigment rhodopsin by light initiates a series of biochemical events that culminates in the closure of cGMP-gated channels (Fesenko et al., 1985), thereby reducing Ca2+ influx; however, Ca2+ efflux through the exchanger continues (Yau and Nakatani, 1985). The resulting fall in outer segment Ca2+ concentration has been shown to play an important role in the regulation of sensitivity in both rod and cone photoreceptors. If this fall in Ca2+ concentration is prevented during exposure to background light, then light adaptation is also prevented (Matthews et al., 1988, 1990; Nakatani and Yau, 1988a). Furthermore, if outer segment Ca2+ is prevented from changing during exposure of a cone to light sufficiently intense to bleach a significant fraction of the photopigment, then bleaching adaptation is also prevented (Matthews et al., 1996). These results strongly suggest that both background adaptation and bleaching adaptation require a reduction in outer segment Ca2+ concentration. A number of Ca2+-sensitive mechanisms have been identified that may collectively contribute to adaptation (Koch and Stryer, 1988; Kawamura and Murakami, 1991; Hsu and Molday, 1993; Gorczyca et al., 1994; Lagnado and Baylor, 1994). To understand how these mechanisms might contribute to adaptation, it is necessary to determine the magnitude and time course of light-induced changes in outer-segment Ca2+ concentration.
Most of our understanding of the role of Ca2+ in modulating phototransduction is based on studies in rod photoreceptors (McNaughton et al., 1986; Ratto et al., 1988; Korenbrot and Miller, 1989; Gray-Keller and Detwiler, 1994; McCarthy et al., 1994; Sampath et al., 1998), from which direct measurements of the magnitude and time course of the fall in outer segment Ca2+ concentration are available. In cones, although several studies have characterized the time course of the decaying current associated with the electrogenic Na+/Ca2+, K+ exchanger at the onset of saturating light (Nakatani and Yau, 1989; Perry and McNaughton, 1991), which is thought to reflect the decline in Ca2+ concentration adjacent to the plasma membrane, no direct measurements have been made of light-induced changes in outer-segment Ca2+ concentration.
In this study, we report the first determination of outer segment Ca2+ concentration from cone photoreceptors with a laser spot confocal technique (Escobar et al., 1994; Sampath et al., 1998), which provides the spatial precision and sensitivity required to measure the change in fluorescence of the Ca2+-sensitive dye fluo-3 within the small volume of the cone outer segment, which reflects the decline in Ca2+ induced by stimulation of the cone by the intense laser spot. In addition, we have used the rapid pigment regeneration that occurs in the presence of 11-cis-retinal to investigate the role of Ca2+ in cone-bleaching adaptation, by measuring outer segment Ca2+ concentration during the photopigment cycle. Repeated regeneration of the photopigment allowed multiple Ca2+ measurements to be made from a single cone, enabling the relationship between the circulating current and outer segment Ca2+ concentration to be studied.
methods
Preparation
Aquatic tiger salamanders (Ambystoma tigrinum) purchased from Charles Sullivan were kept between 7° and 10°C on a 12-h light– dark cycle. Animals were dark-adapted overnight and killed by decapitation, followed by rostral and caudal pithing, in accordance with protocols approved by the Animal Research Council of the University of California, Los Angeles. Retinae were removed and dissociated under infrared illumination to yield isolated photoreceptors, as described previously (Sampath et al., 1998). All experiments were carried out at room temperature (23°C). A fixed volume of the resulting cell suspension was collected with a transfer pipette and injected into the recording chamber. The dissociated cells were continuously superfused with Ringer solution (111 mM NaCl, 2.5 mM KCl, 1.0 mM CaCl2, 1.6 mM MgCl2, 3.0 mM HEPES-NaOH, 10 μM EDTA-NaOH, 10 mM glucose, 0.1 mg/ml bovine serum albumin, pH 7.7). During in situ fluorescence calibrations, the entire recording chamber was superfused with nominal zero and isotonic Ca2+ solutions containing ionomycin (see below). Unless otherwise specified, all reagents were purchased from Sigma Chemical Co.
Ca2+ Measurements
Localized measurements of intracellular Ca2+ were made from the outer segments of isolated red- and blue-sensitive salamander cones. This method, which has been used previously on salamander rod photoreceptors (Sampath et al., 1998), is based on a laser spot confocal technique developed by Escobar et al. (1994). In brief, dissociated salamander retinal tissue was loaded with the Ca2+ indicator fluo-3 (Molecular Probes, Inc.) by incubating the cells in Ringer solution containing 10 μM fluo-3 acetoxymethyl ester for 30 min. The inner segment of an isolated cone was drawn into a suction pipette, leaving the outer segment protruding into the recording chamber. This configuration provided an unobstructed optical path for fluorescence measurements from the cone outer segment and allowed it to be exposed to solutions of different compositions. An argon ion laser (λmax = 514 nm, or 488 nm in a minority of experiments) was used to illuminate a pinhole, which was imaged by a high numerical aperture microscope objective to illuminate a spot ∼8 μm in diameter on the cone outer segment. The suction pipette was positioned so that the laser spot would largely cover the cone outer segment without extending onto the ellipsoid region of the inner segment. Although not all of the outer segment was illuminated by the laser, in most cases we estimate that 90% or more was exposed to the laser. The fluorescence evoked by the laser was collected by the objective and detected by a PIN photodiode mounted on the headstage of a patch clamp amplifier (Axopatch 200A; Axon Instruments). The analogue signal from the photodiode was low-pass filtered at 250 Hz with an active eight-pole Bessel filter (Frequency Devices Inc.) and digitized at 1,000 Hz (PClamp 6; Axon Instruments). The fluorescence signals measured from the cone outer segment seem unlikely to have been retarded by the kinetics of Ca2+ binding to fluo-3, since previous studies have shown that the rate of dissociation of Ca2+ from fluo-3 is considerably faster (τoff ∼ 7 ms) (Escobar et al., 1997) than the changes in fluorescence that we recorded. In addition, fluo-3 loading is unlikely to have contributed significantly to the buffering capacity of the cone, because photoresponses recorded in the absence of fluo-3 have identical response waveforms to those of fluo-3– loaded cones.
The intensity of the laser was attenuated by reflective neutral density filters to yield a flux of 1.2 × 10¹¹ photons per μm−2 s−1 at 514 nm, and 1.3 × 10¹¹ photons per μm−2 s−1 at 488 nm at the plane of the pinhole image. Bleaching of fluo-3 by even the longest laser exposures used in these experiments is likely to have been negligible since these laser intensities are ∼25% lower than that which was used in our previous study of rod photoreceptors (Sampath et al., 1998), during which little or no dye bleaching was observed. In addition to exciting fluo-3 fluorescence, the laser also powerfully stimulated the cone, bleaching a substantial fraction of the photopigment (see below). Several laser illumination protocols were used, depending on the nature of the experiment. In experiments designed to measure the time course of the fall in fluo-3 fluorescence produced by saturating illumination, a continuous 3-s laser exposure was used. In other experiments, laser exposure was minimized by instead presenting multiple brief laser pulses. In experiments in which the fluorescence was calibrated to determine the outer segment Ca2+ concentration, or in which the photopigment was regenerated, four laser pulses each of 20 ms were delivered over the course of 5 s. For experiments in which the relationship between steady state current and outer segment Ca2+ concentration was determined, a single 20-ms laser pulse was delivered.
To calculate the free-Ca2+ concentration in the dark-adapted cone and after saturating illumination, the fluo-3 fluorescence signal was calibrated in situ. This was accomplished by measuring the minimum (Fmin) and maximum (Fmax) fluorescence that could be elicited from each cell during superfusion with solutions designed to raise or lower the cytoplasmic Ca2+ concentration (Minta et al., 1989; Sampath et al., 1998). The cone outer segment was first exposed to a low Ca2+ solution (111 mM NaCl, 2.5 mM KCl, 2.05 mM MgCl2, 3.0 mM HEPES-NaOH, 2 mM EGTA, pH 7.7), followed by a high Ca2+ solution (76.6 mM CaCl2, 2.5 mM KCl, 3.0 mM HEPES-NaOH, pH 7.7). These solutions also contained 25 μM of the Ca2+ ionophore ionomycin (Sigma Chemical Co. and Calbiochem Corp.). The cone outer segment was exposed to these solutions for a time sufficiently long (typically 1 min in each solution) for the laser-evoked fluorescence to reach a steady value. The free-Ca2+ concentration in the cone outer segment was calculated on a cell-by-cell basis from the Michaelis-Menten equation with a value of the dissociation constant for the binding of Ca2+ to fluo-3 of 400 nM, as previously determined (Sampath et al., 1998). The initial peak of evoked fluorescence at the opening of the laser shutter was taken as the dark-adapted value, and the pedestal fluorescence was taken as the light saturated value of Ca2+.
Electrical Recording and Light Stimuli
Light responses from salamander cones were recorded from the inner segment, which was drawn into the suction pipette (Baylor et al., 1979; Yau et al., 1981). The suction pipette current signal was filtered at 25 Hz with an active eight-pole Bessel filter. Unpolarized light stimuli were delivered from a DC-driven tungsten halogen lamp through a 570-nm interference filter for red-sensitive cones, or a 460-nm interference filter for blue-sensitive cones. Cone types were distinguished based on their responses to flashes of light at these wavelengths. The absolute light intensity of the photostimulator was calibrated daily at 570 nm with a silicon photodiode (United Detector Technologies) and adjusted with calibrated neutral density filters (Fish-Schurman Corp.). In experiments to determine the relationship between red-sensitive cone outer segment Ca2+ concentration and the circulating current, light stimuli were instead delivered through a 500-nm interference filter to prevent their detection by the PIN photodiode, which is located after the 530-nm long-pass fluorescence emission filter. Brief flashes were of 20-ms duration.
Pigment Bleaching and Regeneration
The percentage of red-sensitive cone photopigment bleached by the light from the argon ion laser, which was polarized transversely to the outer segment of the cone when held in the suction pipette, was estimated from the photosensitivity measured spectrophotometrically for transverse illumination of isolated salamander cones (6.0 × 10⁻⁹ μm2) (Jones et al., 1993) and the ratio of absorbance at 514 and 610 nm predicted from the pigment nomogram (Dartnall, 1972). Both the continuous and the short-pulse laser exposures that were used to measure the outer segment Ca2+ concentration can be calculated to have bleached >99% of the photopigment within the area of the laser spot. However, in practice the total percentage bleach will have been reduced by two factors. First, the laser spot may not have covered the entire outer segment, especially at its basal end where it was important not to allow the spot to extend onto the strongly fluorescing ellipsoid region of the inner segment. Second, even within the area illuminated by the laser spot, the fractional bleach may have been reduced somewhat by photoregeneration from bleaching intermediates (Williams, 1964; see also Pugh, 1975). This seems likely to have been a relatively modest effect, since even the shortest 20-ms laser pulses were considerably longer than the lifetimes that have been reported for intermediates from which substantial photoregeneration can take place in vertebrate photoreceptors.
Pigment regeneration was accomplished by bath application of 11-cis-retinal, delivered either as a 0.1% ethanolic solution in Ringer, or in phosphatidylcholine vesicles (Type V; Sigma Chemical Co.), which were prepared by sonication as described previously (Jones et al., 1989; Sampath et al., 1998). The concentration of 11-cis-retinal was assessed spectrophotometrically (UV-2101PC spectrophotometer; Shimadzu Scientific Instruments) from these solutions diluted 10-fold in absolute ethanol, using a molar extinction coefficient of 25,000 M−1 cm−1 at 380 nm (Hubbard et al., 1971). To regenerate the photopigment of a bleached cone, a transfer pipette was used to add to the recording chamber either 1 ml of an ethanolic solution containing 50– 75 μM 11-cis-retinal, or the appropriate quantity of vesicle suspension to achieve a 11-cis-retinal concentration of 100 μM. Regeneration of the photopigment was assessed by measuring the electrical responses of the cone to repeated flashes of light.
results
Kinetics of the Light-induced Decline in Ca2+ Concentration
Fig. 1 shows an example of a simultaneous measurement of fluo-3 fluorescence and suction pipette current from an isolated red-sensitive cone previously loaded with fluo-3 acetoxymethyl ester. First, the dark-adapted cone was exposed to the laser for 3 s, an exposure that will have bleached a considerable fraction of the photopigment (see methods), and which resulted in complete suppression of the circulating current (Fig. 1 B, 1). This was accompanied by a rapid decline in fluo-3 fluorescence (Fig. 1 A, 1), corresponding to a fall in the intracellular free-Ca2+ concentration. The measured fluorescence originated in the cone outer segment, since movement of the cone off the laser spot produced no detectable fluorescence when the laser shutter was opened. A second laser exposure 10-s later showed that at that time the circulating current remained almost completely suppressed (Fig. 1 B, 2) and that fluo-3 fluorescence had reached a minimum level (Fig. 1 A, 2). It can be seen from Fig. 1 A that fluo-3 fluorescence did not fall to zero during saturating illumination, but instead declined to a maintained pedestal level that was insensitive to further stimulation of the cone by laser light, much as is the case for rod photoreceptors. This light-insensitive component of fluorescence is unlikely to be due to compartmentalization of fluo-3 within the outer segment during loading, since the cone outer segment contains no closed compartments. Instead, this pedestal, which is greater than the minimum fluorescence evoked from fluo-3 under Ca2+-free conditions in vitro, may be attributable to a nonspecific interaction of fluo-3 with other molecules in the cone outer segment (Sampath et al., 1998). The decline in fluo-3 fluorescence during the first 2 s of exposure to saturating laser light could be fitted with the sum of two decaying exponentials, the shorter of which was of greater amplitude than the longer. Measurements from 25 red-sensitive cones yielded mean values for the two time constants of 43 ± 2.4 and 640 ± 55 ms (mean ± SEM), while the ratio of their amplitudes was 1.7 ± 0.11.
Figure 1.

Simultaneous measurements of fluo-3 fluorescence and circulating current from a red-sensitive cone during a 3-s laser exposure. (A) Fluo-3 fluorescence signal excited by the laser spot and recorded by the photodiode. (B) Circulating current measured by the suction pipette in response to the laser exposure. In each case, 1 represents the first exposure of the dark-adapted cone to the laser spot and 2 shows the response to a second laser exposure 10 s later. The light-induced decline in fluo-3 fluorescence (A, 1) could be fitted with the sum of two exponentials with time constants of 27 and 430 ms using a least-squares algorithm. The residual decline in fluo-3 fluorescence seen at the onset of the second laser exposure (A, 2) is likely to correspond to the small recovery in circulating current that had taken place at that time (B, 2). The initial peak in the suction pipette recording (B) is likely to represent contamination of the photoresponse by voltage-sensitive conductances in the cone inner segment (Barnes and Hille, 1989). The top trace is the laser light monitor. (Inset) The fall in fluo-3 fluorescence during the first 200 ms with the same exponential fit as described above.
Occasionally in the course of these experiments, blue-sensitive cones were encountered; these are much less numerous than red-sensitive cones in the salamander retina (Perry and McNaughton, 1991). On these occasions, the opportunity was taken to determine the kinetics of the light-induced decline in fluo-3 fluorescence from the outer segments. An example of such a measurement is shown in Fig. 2. It can be seen that the time course of the decay in fluorescence is slower than that in red-sensitive cones, approximately matching the slower kinetics of the blue-sensitive cone photoresponse (Perry and McNaughton, 1991). The fall in fluo-3 fluorescence was again fitted as the sum of two decaying exponentials, but in this case with nearly equal amplitudes. Measurements from four blue-sensitive cones yielded mean values for the two time constants of 140 ± 30 and 1,400 ± 300 ms (mean ± SEM).
Figure 2.

Simultaneous measurements of fluo-3 fluorescence and circulating current from a blue-sensitive cone during a 7-s laser exposure. (A) Fluo-3 fluorescence signal excited by the laser spot and recorded by the photodiode. (B) Circulating current measured by the suction pipette in response to the laser exposure. In each case, 1 represents the first exposure of the dark-adapted cone to the laser spot and 2 shows the response to a second laser exposure 10 s later. The time axis has been truncated to show the initial 3.5 s of the laser exposure for ease of comparison with the data of Fig. 1. The light-induced decline in fluo-3 fluorescence (A, 1) could be fitted with the sum of two exponentials with time constants of 90 and 2,300 ms using a least-squares algorithm. The top trace is the laser light monitor.
Magnitude of the Light-induced Decline in Ca2+ Concentration
To estimate the absolute values of free Ca2+ in darkness and during steady light, in situ calibrations of fluo-3 fluorescence were performed by artificially elevating or depressing the Ca2+ concentration in the cone outer segment to levels that would maximize or minimize its binding to the dye. A typical result is shown in Fig. 3. First, a continuous laser exposure was used to measure the initial level of fluo-3 fluorescence evoked from a dark-adapted red-sensitive cone (Fig. 3 A, top, 1). This laser spot was sufficiently intense to ensure that the circulating current remained close to complete suppression until the light-induced decline in fluo-3 fluorescence was completed (Fig. 3 A, bottom, 1). Then, a second laser exposure was delivered while the response remained close to saturation (Fig. 3 A, bottom, 2) in order to measure the fluorescence once the circulating current was suppressed (Fig. 3 A, top, 2). These signals were then calibrated by determining the minimum and maximum levels of fluorescence that could be evoked by repeated 20-ms laser pulses during exposure to low and high Ca2+ solutions in the presence of 25 μM of the Ca2+ ionophore ionomycin. 20-ms pulses were used in preference to continuous laser exposures as a precaution against photodynamic damage and cell death, which was observed during a number of calibrations. Low Ca2+ solution (Fig. 3 B) evoked a substantial elevation in the circulating current and fluo-3 fluorescence was reduced to a constant low level, while high Ca2+ solution (Fig. 3 C) abolished the circulating current and led to a large increase in fluorescence. These changes in circulating current and fluorescence suggest that these manipulations successfully lowered and raised the outer segment Ca2+ concentration from the normal levels in saturating light and darkness. The values for the minimum (Fmin) and maximum (Fmax) fluorescence derived from these measurements were used in conjunction with the previously determined dissociation constant of fluo-3 for Ca2+ (400 nM; Sampath et al., 1998) to calculate the free-Ca2+ concentration in the cone outer segment, yielding values of 410 ± 37 nM in the dark-adapted red-sensitive cone, and 5.5 ± 2.4 nM during suppression of the circulating current by saturating light (mean ± SEM, n = 8).
Figure 3.

In situ calibration of Ca+-dependent fluorescence from a red-sensitive cone outer segment loaded with fluo-3 acetoxymethyl ester. (A) In Ringer solution, a 7-s laser exposure was used to make fluo-3 fluorescence (top) and circulating current (bottom) measurements from a dark-adapted cone (1) and after response saturation (2). (B) Cone outer segment superfused with a nominally zero Ca2+ solution containing 25 μM ionomycin. The fluorescence measurement was made after ∼1 min of superfusion with this solution, during which time an increase in the circulating current was observed. Laser excitation consisted of four laser pulses, each of 20-ms duration, presented over the course of 7 s. (C) Cone outer segment superfused with an isotonic Ca2+ solution containing 25 μM ionomycin. After nearly 30 s of superfusion with this solution, a greatly elevated level of fluorescence was recorded and the circulating current fell to zero. Minimum (Fmin) and maximum (Fmax) fluorescence values from B and C were used to calibrate the fluorescence data from A (see text), yielding values for the outer segment Ca2+ concentration in this cone of 490 nM in darkness, falling to 5 nM during response saturation. The top trace is the laser light monitor.
This estimate of free Ca2+ may have been influenced by several sources of error. Incomplete solution changes into zero and isotonic Ca2+ solutions would have produced discrepancies in the estimation of Fmin and Fmax, though the rate of solution perfusion was sufficiently rapid to produce a complete change of solution. This difficulty is especially relevant for the solution change into the isotonic Ca2+ solution to increase outer segment Ca2+, since the photoreceptors contain a powerful Na+/Ca2+, K+ exchanger that extrudes Ca2+. However, simultaneous measurements of circulating current indicate that these solution changes may have been complete. When presented with this zero Ca2+ solution, an increase in circulating current was observed (Fig. 3 B, bottom), and in the isotonic Ca2+ solution this current was abolished (Fig. 3 C, bottom). These changes in circulating current are consistent with a Ca2+-dependent modulation of the guanylyl cyclase that was observed in previous experiments on rods (see, for example, Dizhoor et al., 1994; Sampath et al., 1998). In addition, small errors in the estimation of the K d of fluo-3 for binding Ca2+ would be expected to change the calculated values of Ca2+. It is possible that the intracellular environment may marginally change this parameter (Schnetkamp et al., 1991b).
Changes in Outer Segment Ca2+ Concentration during the Photopigment Cycle
In rods, the changes in light sensitivity that occur after photopigment bleaching have been shown to be accompanied by changes in outer segment Ca2+ concentration (Sampath et al., 1998). A primary objective of this study was to investigate whether similar changes also occur in cones. To this end, Ca2+ measurements were made from isolated red-sensitive cones during the photopigment cycle. An example of such an experiment is shown in Fig. 4. First, a sequence of flashes of progressively increasing intensity was delivered to determine the response-intensity relation in darkness (Fig. 4 D, Dark-adapted), and then a measurement of fluo-3 fluorescence was made from the dark-adapted cone (Fig. 4 A). To minimize the total laser exposure, fluorescence was excited by four 20-ms laser pulses presented over a 5-s period. Nevertheless, this relatively brief exposure to the laser spot will have bleached a substantial fraction of the photopigment (see methods). Once the sensitivity of the cone had stabilized after this bleach, the response-intensity relation was again determined (Fig. 4 D, Bleached) and a second series of laser pulses was delivered (Fig. 4 B). After bleaching, the response-intensity relation was shifted to higher intensities, corresponding to a fall in sensitivity (Jones et al., 1993). This bleach-induced desensitization was accompanied by a reduction in the initial level of fluo-3 fluorescence evoked by the first laser pulse to 55% of its dark-adapted value in this cell. After this second laser exposure, the photopigment was regenerated by exposing the outer segment to an ethanolic solution of 11-cis-retinal. Once the sensitivity of the cone to dim flashes returned to approximately its dark-adapted value, superfusion with Ringer solution recommenced and the response-intensity relation was determined a final time (Fig. 4 D, Regeneration). A final series of laser pulses revealed that the recovery of sensitivity in the presence of 11-cis-retinal was accompanied by the restoration of fluo-3 fluorescence to 93% of its original dark-adapted value.
Figure 4.

Changes in outer segment Ca2+ concentration and flash sensitivity for a red-sensitive cone during the photopigment cycle. (Left) Fluo-3 fluorescence measurements (A) in the dark-adapted cone, (B) after laser-induced photopigment bleaching, and (C) after photopigment regeneration with an ethanolic solution containing 50 μM 11-cis-retinal. (Top) Laser light monitor; laser illumination delivered as a sequence of four 20-ms pulses over a 3-s period. (D) Response-intensity relationships for the cone in the dark-adapted state (▴), after bleaching by the laser (○), and after regeneration of the photopigment (▾). The response-intensity relation was determined by delivering a series of flashes of increasing intensity before each fluorescence measurement. Each point is the average of four flash responses.
Similar results were obtained in a total of 13 experiments, in 7 of which an ethanolic solution and in 6 of which a vesicular solution of 11-cis-retinal was used to regenerate the photopigment. To compensate for differences in dye loading between cells, and for the possibility of slight movement of the outer segment during each experiment, the data were normalized by dividing the peak fluo-3 fluorescence for each cell by the light- and Ca2+-insensitive pedestal of fluorescence that remained after complete suppression of the circulating current. When analyzed in this way, the normalized peak fluorescence fell from 2.7 ± 0.2 (mean ± SEM) times the pedestal value in the dark-adapted cone at the start of the experiment to 1.5 ± 0.1 after bleaching by the laser spot, a difference that is significant at the 1% level (paired t test, t = 7.8). However, after regeneration of the photopigment with 11-cis-retinal, the normalized peak fluorescence rose again to 2.6 ± 0.2, a value not significantly different at the 5% level from the original level in darkness (paired t test, t = 1.1).
The regeneration of photopigment in a cone could be repeated reproducibly many times in the same cell. To demonstrate this, a cone was exposed to an ethanolic solution of 11-cis-retinal, and fluo-3 fluorescence was measured every 2–3 min with a 20-ms laser pulse. Before each fluorescence measurement, the responses to just-saturating flashes were recorded to ensure the complete recovery of the response amplitude and waveform. Five measurements were made in each of four cells, and the fluorescence evoked by each of these laser pulses fell within 15% of the original dark-adapted value (data not shown). These results indicate that, when cone sensitivity was completely restored after bleaching, the peak fluo-3 fluorescence also returned reproducibly to its original dark-adapted level. They thus suggest that there is little adverse effect of prolonged exposure to an ethanolic solution of 11-cis-retinal on the physiology of the cone. In contrast, prolonged exposure to vesicular solutions of 11-cis-retinal might be expected to have deleterious effects on the highly invaginated cone outer segment membrane. We therefore used ethanolic solutions in preference to vesicular solutions in experiments in which the outer segment was exposed continuously to 11-cis-retinal.
The Relationship between Outer Segment Ca2+ Concentration and Circulating Current
We have made use of the rapid and reproducible pigment regeneration that occurs in the continuous presence of an ethanolic solution of 11-cis-retinal to investigate the relationship between the circulating current and outer segment Ca2+ concentration in red-sensitive cones. An example of such an experiment in the presence of 11-cis-retinal is shown in Fig. 5 A. First, the cone was exposed to steady light that suppressed a proportion of the circulating current. After 10 s of background illumination, a period sufficient to allow the circulating current to decline to a new steady level, the cell was exposed to a 20-ms laser pulse and fluo-3 fluorescence was measured. After each laser pulse, which will have bleached the great majority of the photopigment (see methods), the suction pipette current responses to saturating flashes were used to monitor the recovery of both the circulating current and the waveform of the light response in the continuous presence of 11-cis-retinal. Either four or five fluorescence measurements were made from a given cone, each following adaptation to a different intensity of background light, and the cone was allowed to recover its dark-adapted sensitivity after each measurement. Fig. 5 B shows fluo-3 fluorescence measured from the same cone, plotted against the steady state circulating current at the time at which the laser pulse was delivered. It can be seen that as the circulating current was progressively suppressed by backgrounds of increasing intensity, the fluo-3 fluorescence decreased linearly, ultimately falling to a pedestal level once the response to the background saturated.
Figure 5.
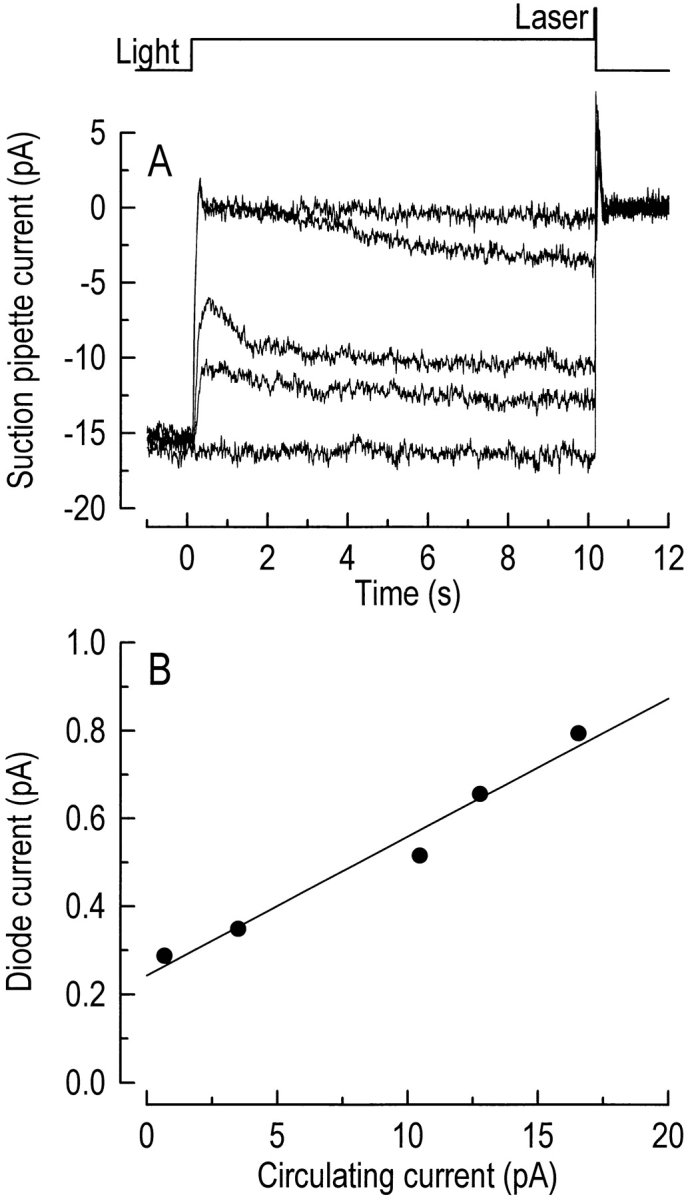
Determination of the relationship between steady state circulating current and outer segment Ca2+ concentration. (A) Suction pipette current records in response to stimulation with 10 s of background illumination followed by a 20-ms laser pulse, during which fluo-3 fluorescence was measured. Steady light stimuli of wavelength 500 nm delivered 0, 3,640, 13,000, 171,000, and 2,520,000 photons per μm−2 s−1 in this cell. The cone outer segment was exposed to an ethanolic solution containing 50 μM 11-cis-retinal throughout the experiment. The extent of photopigment regeneration between laser exposures was assessed by the recovery of both the amplitude and response waveform of a saturating flash of wavelength 570 nm. The top trace is the laser light monitor. (B) Photodiode current measured during laser illumination plotted against the amplitude of the circulating current after it had reached steady state in the presence of the background. The data were fitted with a regression line using a least-squares algorithm.
Collected results from nine such experiments are shown in Fig. 6. To allow a direct comparison, the data have been normalized to compensate for variation between cells in the absolute level of fluorescence and the magnitude of the circulating current. Normalization of fluo-3 fluorescence also compensates for the variability of the calibration procedure. The data have been fitted with a straight line constrained to pass through unity for both the circulating current and fluorescence. The progressive decline in fluorescence that was seen as the circulating current was suppressed by steady light is consistent with a proportional variation between the outer segment Ca2+ concentration and the magnitude of the circulating current during background adaptation.
Figure 6.

Collected results from nine experiments to determine the relationship between steady state circulating current and fluo-3 fluorescence. Data have been normalized according to the circulating current and fluo-3 fluorescence in darkness to allow comparison between cells. Normalized diode current has been plotted against the fraction of circulating current that remained after exposure to background illumination. The data have been fitted with a regression line constrained to pass through unity by a least-squares algorithm.
discussion
Light-induced Decline in Cone Outer Segment Ca2+ Concentration
The decline in fluo-3 fluorescence that accompanies the stimulation of a dark-adapted cone by the laser spot is consistent with a light-induced reduction in outer segment Ca2+ concentration, as previously shown to take place during the rod photoresponse (McNaughton et al., 1986; Ratto et al., 1988; Korenbrot and Miller, 1989; Gray-Keller and Detwiler, 1994; McCarthy et al., 1994; Sampath et al., 1998). While such a fall in Ca2+ concentration has also been proposed to take place in cones (Nakatani and Yau, 1988a; Perry and McNaughton, 1991), this study represents the first direct measurement of its magnitude and kinetics. Our measurement relies upon the spatial precision, temporal resolution, and sensitivity of the spot confocal technique (Escobar et al., 1994; Sampath et al., 1998), which allows fluo-3 fluorescence to be excited and collected from the small tissue volume of the cone outer segment, while excluding contributions from neighboring structures, such as the ellipsoid, which also load heavily with the dye. The changes in fluo-3 fluorescence that we have observed can therefore be attributed to changes in Ca2+ concentration in the cone outer segment.
In this study, we found that both the kinetics and the magnitude of the light-induced decline in Ca2+ concentration in cone outer segments are considerably different from those previously measured in rods. We therefore confirm and extend previous indirect measurements that suggested that, for similar changes in outer segment current, changes in outer segment Ca2+ concentration are larger and faster in cones than rods (Miller and Korenbrot, 1994). The initial light-induced decline in fluo-3 fluorescence from the dark-adapted cone outer segment could best be fitted as the sum of two exponentials, as is the case for rods. However, the time constants of the red-sensitive cone of 43 ± 2.4 and 640 ± 55 ms are three- to sixfold faster than those previously observed in rods with the same technique (Sampath et al., 1998). Consequently, the fall of fluo-3 fluorescence to a baseline value after exposure to bleaching illumination normally requires only a few seconds in the red-sensitive cone, whereas it takes much longer in the rod. Furthermore, in red-sensitive cones the faster of these two exponential components is dominant, contributing nearly twice the amplitude of the slower component to the light-induced decline in Ca2+ concentration. This contrasts with the situation in rods, for which the two components are of approximately equal amplitude. The rapidity of the decline in red-sensitive cone Ca2+ concentration matches the similarly rapid kinetics of their responses to light, ensuring that the feedback actions of Ca2+ on the transduction mechanism take place on an appropriate time scale (Nakatani and Yau, 1989; Matthews et al., 1990). However, the photoresponse of a red-sensitive cone appears to be intrinsically more rapid than that of a rod, since this difference in response kinetics remains even when the light-induced fall in outer segment Ca2+ concentration is prevented (Nakatani and Yau, 1988b; Matthews et al., 1990).
Although the explanation for multiple exponential components of Ca2+ decline is uncertain, it is noteworthy that the time constant of the faster component in cones approximates to that of previous measurements of the time course of Na+/Ca2+, K+ exchange (Nakatani and Yau, 1989; Perry and McNaughton, 1991). Since the invaginated structure of the amphibian cone outer segment places most of the small intracellular volume adjacent to the plasma membrane, it seems possible that in red-sensitive cones the volume-averaged fall in outer segment Ca2+ concentration measured by the dye may be dominated by the kinetics of Na+/Ca2+, K+ exchange to a greater degree than in rods. Alternatively, the difference in the relative amplitudes of the two components may reflect differences in low and high affinity buffering capacity between rod and cone outer segments. The light-induced decline in outer segment Ca2+ concentration is two- or threefold slower in blue- than red-sensitive cones, broadly matching the slower time course of their photoresponses (Perry and McNaughton, 1991). These kinetic differences between the two cone types may reflect differences in Ca2+ buffering capacity, in the ratio of surface area to volume of the outer segment, or in the density of Na+/Ca2+, K+ exchanger in the outer segment membrane (Nakatani and Yau, 1989).
Calibration of these fluo-3 fluorescence signals revealed that Ca2+ concentration falls from 410 ± 37 nM in the dark-adapted red-sensitive cone outer segment to 5.5 ± 2.4 nM when the outer segment conductance is completely suppressed by light. In contrast, in a salamander rod the outer segment Ca2+ concentration is higher both in darkness and during saturating light (Sampath et al., 1998). Previous studies have shown that during rod saturation the outer segment Ca2+ concentration falls to ∼30–50 nM (Gray-Keller and Detwiler, 1994; McCarthy et al., 1994; Sampath et al., 1998), a value considerably greater than the subnanomolar values predicted from the Na+ and K+ gradients if the Na+/Ca2+, K+ exchanger were to attain thermodynamic equilibrium (Cervetto et al., 1989; Schnetkamp et al., 1991a). This contrasts with the value for the outer segment Ca2+ concentration in a saturated red-sensitive cone of <6 nM. This observation suggests that some process in both rod and cone outer segments may prevent the Ca2+ concentration from attaining its equilibrium value after complete suppression of the circulating current. Possible mechanisms include an inactivation of the Na+/Ca2+, K+ exchanger at low Ca2+ concentration (Schnetkamp et al., 1991a; Schnetkamp and Szerencsei, 1993), or (for rods) a slow release of Ca2+ from a store or buffer within the outer segment (Schröder and Fain, 1984).
A consequence of the very low Ca2+ concentration in the cone outer segment when the circulating current is completely suppressed is that the Ca2+ concentration varies over a 75-fold dynamic range in red-sensitive cones, a value more than three times greater than in the rod, despite the somewhat lower outer segment Ca2+ concentration in darkness. The greater relative variation in outer segment Ca2+ concentration in the cone implies that Ca2+-sensitive sites within phototransduction are likely to be influenced more profoundly in cones during exposure to steady light than in rods. For example, the unbinding of Ca2+ from guanylyl cyclase– activating protein results in an increase in the rate of cGMP production (Gorczyca et al., 1994) that is believed to be crucial in setting the operating range of transduction during steady light. Biochemical studies in vitro have shown that retGC1, which is present in the photoreceptor outer segment, is inhibited at a half-maximal Ca2+ concentration of 200 nM with a cooperativity of 1.7 (Dizhoor et al., 1994). These values imply that during saturating illumination the very low outer segment Ca2+ concentration attained by cones would induce an almost 20% greater increase in cyclase activity than in rods. It therefore seems possible that the shallow cone response-intensity relation for steady illumination (Matthews et al., 1990; Jones et al., 1993) may reflect a more powerful modulation of this and other Ca2+-sensitive processes in cones than in rods. Compared with the rod photoreceptor, which saturates at a relatively low background light intensity, this more powerful modulation of the transduction mechanism by Ca2+ in cones may extend the range of the cone to brighter background intensities by preventing saturation of the photocurrent during bright steady light.
Measurements of Ca2+ Concentration during the Photopigment Cycle
After bleaching, fluo-3 fluorescence was significantly depressed, but it recovered to a level not significantly different from the original dark-adapted value after regeneration of the photopigment with 11-cis-retinal, which also restores circulating current, response kinetics, and sensitivity (Jones et al., 1993). It is difficult from our experiments to make a quantitative comparison between the magnitude of the fall in outer segment Ca2+ concentration and the degree of suppression of the circulating current by bleaching, since it is likely that the laser spot did not excite fluorescence and bleach pigment within the entirety of the cone outer segment (see methods). Since the suppression of current is believed to be closely localized to the site of illumination or bleaching (Lamb et al., 1981; Baylor and Lamb, 1982; Cornwall et al., 1990), it seems likely that the laser-induced bleach will have resulted in a nonuniform suppression of the circulating current. Nevertheless, these systematic changes in fluorescence intensity indicate that in cones, as in rods (Sampath et al., 1998), the bleach-induced suppression of circulating current is accompanied by a persistent decrease in outer segment Ca2+ concentration that is restored when the photopigment is regenerated. This is consistent with the notion that the persistent activation of the transduction cascade that follows cone bleaching (Cornwall et al., 1995) leads, through partial suppression of the circulating current, to a reduction in Ca2+ influx and a corresponding fall in the outer segment Ca2+ concentration. Since bleach-induced changes in photoresponse sensitivity and kinetics are abolished in cones if this fall in Ca2+ i is prevented (Matthews et al., 1996), it would appear that the reduction in Ca2+ i after bleaching is necessary for the adaptation that ensues, and that restoration of Ca2+ concentration after the regeneration of the photopigment is required for the recovery of dark-adapted sensitivity.
The Relationship between Outer Segment Ca2+ Concentration and the Circulating Current
The characteristic rapidity of photopigment regeneration in cones, which enables recovery of dark-adapted sensitivity within just a few minutes after bleaching in the presence of exogenous 11-cis-retinal, allowed multiple measurements of outer segment Ca2+ concentration to be made from an individual cone by repeatedly regenerating the photopigment after successive bleaches by the laser spot. It would be difficult to carry out this same procedure in a rod, because the time required after bleaching to reach steady state and to regenerate the photopigment with exogenous 11-cis-retinal can exceed 1 h (Jones et al., 1989). This approach was used to investigate the relationship between circulating current and outer segment Ca2+ concentration in cones during adaptation to steady background light. In these experiments, the background illumination was uniform over the entire cone outer segment; therefore, the resulting suppression of circulating current is likely also to have been uniform. In addition, the background illumination was presented for a time period that allowed the circulating current to reach steady state. Even though the laser spot did not cover the entire outer segment, this steady state condition ensured that Ca2+ measurements from a portion of the outer segment were representative of the entire outer segment.
Since the outer segment Ca2+ concentration is approximately equal to the dissociation constant of fluo-3 in darkness and declines from this value during illumination, the relationship between dye fluorescence and Ca2+ concentration will have deviated little (<10%) from a linear relation. Consequently, the approximately linear variation of fluo-3 fluorescence with circulating current that we have observed suggests that outer segment Ca2+ concentration may also vary linearly with circulating current. A similar conclusion has been reached for rod photoreceptors from measurements from the entire retina (Younger et al., 1996; but see also Gray-Keller and Detwiler, 1994). If the relative permeability of the outer segment conductance to Ca2+ remains unchanged during light adaptation, the influx of Ca2+ would be directly proportional to the magnitude of the circulating current (Nakatani and Yau, 1988b). Similarly, the rate of Ca2+ extrusion should vary linearly with the outer segment Ca2+ concentration, since the Ca2+ concentration throughout the physiological range is considerably below the Ca2+ affinity at the internal face of the Na+/Ca2+, K+ exchanger (Hodgkin and Nunn, 1987; Lagnado et al., 1988; Schnetkamp et al., 1991b). The linear variation of fluo-3 fluorescence with circulating current that we have observed therefore supports the view that cone outer segment Ca2+ concentration at steady state is principally determined by the dynamic balance between Ca2+ influx through the outer segment conductance, and by Ca2+ efflux through the Na+/Ca2+, K+ exchanger, that the fraction of the circulating current carried by Ca2+ remains constant during the light response, and that the exchanger operates well below saturation.
Acknowledgments
This work was supported by a Hyde Fellowship from the Department of Physiological Science, UCLA (A.P. Sampath), grants EY-01844 (G.L. Fain) and EY-01157 (M.C. Cornwall) from the National Eye Institute of the National Institutes of Health, United States Public Health Service T32 NS 07101 (J. Bandarchi), and a grant from the Wellcome Trust (H.R. Matthews).
Footnotes
Portions of this work were previously published in abstract form (Sampath, A.P., H.R. Matthews, M.C. Cornwall, J. Bandarchi, and G.L. Fain. 1998. J. Physiol. (Camb.). 506:89P; Matthews, H.R., A.P. Sampath, M.C. Cornwall, and G.L. Fain. 1998. Investig. Ophthalmol. Vis. Sci. 39:1124).
references
- Barnes S, Hille B. Ionic channels of the inner segment of tiger salamander cone photoreceptors. J Gen Physiol. 1989;94:719–743. doi: 10.1085/jgp.94.4.719. [DOI] [PMC free article] [PubMed] [Google Scholar]
- Baylor DA, Lamb TD. Local effects of bleaching in retinal rods of the toad. J Physiol (Lond) 1982;328:49–71. doi: 10.1113/jphysiol.1982.sp014252. [DOI] [PMC free article] [PubMed] [Google Scholar]
- Baylor DA, Lamb TD, Yau K-W. The membrane current of single rod outer segments. J Physiol (Camb) 1979;288:589–611. [PMC free article] [PubMed] [Google Scholar]
- Cervetto L, Lagnado L, Perry RJ, Robinson DW, McNaughton PA. Extrusion of calcium from rod outer segments is driven by both sodium and potassium gradients. Nature. 1989;337:740–743. doi: 10.1038/337740a0. [DOI] [PubMed] [Google Scholar]
- Cornwall MC, Fein A, MacNichol EF. Cellular mechanisms that underlie bleaching and background adaptation. J Gen Physiol. 1990;96:345–372. doi: 10.1085/jgp.96.2.345. [DOI] [PMC free article] [PubMed] [Google Scholar]
- Cornwall MC, Matthews HR, Crouch RK, Fain GL. Bleached pigment activates transduction in salamander cones. J Gen Physiol. 1995;106:543–557. doi: 10.1085/jgp.106.3.543. [DOI] [PMC free article] [PubMed] [Google Scholar]
- Dartnall, H.J.A. 1972. Photosensitivity. In Handbook of Sensory Physiology. H.J.A. Dartnall, editor. Springer-Verlag, Berlin. 122–145.
- Dizhoor AM, Lowe DG, Olshevskaya EV, Laura RP, Hurley JB. The human photoreceptor membrane guanylyl cyclase, RetGC, is present in outer segments and is regulated by calcium and a soluble activator. Neuron. 1994;12:1345–1352. doi: 10.1016/0896-6273(94)90449-9. [DOI] [PubMed] [Google Scholar]
- Escobar AL, Monck JR, Fernandez JM, Vergara JL. Localization of the site of Ca2+release at the level of a single sarcomere in skeletal-muscle fibers. Nature. 1994;367:739–741. doi: 10.1038/367739a0. [DOI] [PubMed] [Google Scholar]
- Escobar AL, Velez P, Kim AM, Cifuentes F, Fill M, Vergara JL. Kinetic properties of DM-nitrophen and calcium indicators: rapid transient response to flash photolysis. Pflügers Arch. 1997;434:615–631. doi: 10.1007/s004240050444. [DOI] [PubMed] [Google Scholar]
- Fesenko EE, Kolesnikov SS, Lyubarsky AL. Induction by cyclic GMP of cationic conductance in plasma membrane of retinal rod outer segment. Nature. 1985;313:310–313. doi: 10.1038/313310a0. [DOI] [PubMed] [Google Scholar]
- Gorczyca WA, Gray-Keller MP, Detwiler PB, Palczewski K. Purification and physiological evaluation of a guanylate cyclase activating protein from retinal rods. Proc Natl Acad Sci USA. 1994;91:4014–4018. doi: 10.1073/pnas.91.9.4014. [DOI] [PMC free article] [PubMed] [Google Scholar]
- Gray-Keller MP, Detwiler PB. The calcium feedback signal in the phototransduction cascade of vertebrate rods. Neuron. 1994;13:849–861. doi: 10.1016/0896-6273(94)90251-8. [DOI] [PubMed] [Google Scholar]
- Hodgkin AL, McNaughton PA, Nunn BJ. The ionic selectivity and calcium dependence of the light-sensitive pathway in toad rods. J Physiol (Camb) 1985;358:447–468. doi: 10.1113/jphysiol.1985.sp015561. [DOI] [PMC free article] [PubMed] [Google Scholar]
- Hodgkin AL, Nunn BJ. The effect of ions on sodium calcium exchange in salamander rods. J Physiol (Camb) 1987;391:371–398. doi: 10.1113/jphysiol.1987.sp016743. [DOI] [PMC free article] [PubMed] [Google Scholar]
- Hsu Y-T, Molday RS. Modulation of the cGMP-gated channel of rod photoreceptor cells by calmodulin. Nature. 1993;361:76–79. doi: 10.1038/361076a0. [DOI] [PubMed] [Google Scholar]
- Hubbard, R., P.K. Brown, and D. Bownds. 1971. Methodology of vitamin A and visual pigments. Methods Enzymol. 18C:615–653.
- Jones GJ, Crouch RK, Wiggert B, Cornwall MC, Chader GJ. Retinoid requirements for recovery of sensitivity after visual-pigment bleaching in isolated photoreceptors. Proc Natl Acad Sci USA. 1989;86:9606–9610. doi: 10.1073/pnas.86.23.9606. [DOI] [PMC free article] [PubMed] [Google Scholar]
- Jones GJ, Fein A, MacNichol EFJ, Cornwall MC. Visual pigment bleaching in isolated salamander retinal cones. Microspectrophotometry and light adaptation. J Gen Physiol. 1993;102:483–502. doi: 10.1085/jgp.102.3.483. [DOI] [PMC free article] [PubMed] [Google Scholar]
- Kawamura S, Murakami M. Calcium-dependent regulation of cyclic GMP phosphodiesterase by a protein from frog retinal rods. Nature. 1991;349:420–423. doi: 10.1038/349420a0. [DOI] [PubMed] [Google Scholar]
- Koch K-W, Stryer L. Highly cooperative feedback control of retinal rod guanylate cyclase by calcium ions. Nature. 1988;334:64–66. doi: 10.1038/334064a0. [DOI] [PubMed] [Google Scholar]
- Korenbrot JI, Miller DL. Cytoplasmic free calcium concentration in dark-adapted retinal rod outer segments. Vision Res. 1989;29:939–948. doi: 10.1016/0042-6989(89)90108-9. [DOI] [PubMed] [Google Scholar]
- Lagnado L, Cervetto L, McNaughton PA. Ion transport by the Na-Ca exchange in isolated rod outer segments. Proc Natl Acad Sci USA. 1988;85:4548–4552. doi: 10.1073/pnas.85.12.4548. [DOI] [PMC free article] [PubMed] [Google Scholar]
- Lagnado L, Baylor DA. Calcium controls light-triggered formation of catalytically active rhodopsin. Nature. 1994;367:273–277. doi: 10.1038/367273a0. [DOI] [PubMed] [Google Scholar]
- Lamb TD, McNaughton PA, Yau K-W. Spatial spread of activation and background desensitization in toad rod outer segments. J Physiol (Camb) 1981;319:463–496. doi: 10.1113/jphysiol.1981.sp013921. [DOI] [PMC free article] [PubMed] [Google Scholar]
- Matthews HR, Fain GL, Cornwall MC. Role of cytoplasmic calcium concentration in the bleaching adaptation of salamander cone photoreceptors. J Physiol (Camb) 1996;490:293–303. doi: 10.1113/jphysiol.1996.sp021144. [DOI] [PMC free article] [PubMed] [Google Scholar]
- Matthews HR, Fain GL, Murphy RLW, Lamb TD. Light adaptation in cone photoreceptors of the salamander: a role for cytoplasmic calcium. J Physiol (Camb) 1990;420:447–469. doi: 10.1113/jphysiol.1990.sp017922. [DOI] [PMC free article] [PubMed] [Google Scholar]
- Matthews HR, Murphy RLW, Fain GL, Lamb TD. Photoreceptor light adaptation is mediated by cytoplasmic calcium concentration. Nature. 1988;334:67–69. doi: 10.1038/334067a0. [DOI] [PubMed] [Google Scholar]
- McCarthy ST, Younger JP, Owen WG. Free calcium concentrations in bullfrog rods determined in the presence of multiple forms of fura-2. Biophys J. 1994;67:2076–2089. doi: 10.1016/S0006-3495(94)80691-5. [DOI] [PMC free article] [PubMed] [Google Scholar]
- McNaughton PA, Cervetto L, Nunn BJ. Measurement of the intracellular free calcium concentration in salamander rods. Nature. 1986;322:261–263. doi: 10.1038/322261a0. [DOI] [PubMed] [Google Scholar]
- Miller JL, Korenbrot JI. Differences in calcium homeostasis between retinal rod and cone photoreceptors revealed by the effects of voltage on the cGMP-gated conductance in intact cells. J Gen Physiol. 1994;104:909–940. doi: 10.1085/jgp.104.5.909. [DOI] [PMC free article] [PubMed] [Google Scholar]
- Minta A, Kao JP, Tsien RY. Fluorescent indicators for cytosolic calcium based on rhodamine and fluorescein chromophores. J Biol Chem. 1989;264:8171–8178. [PubMed] [Google Scholar]
- Nakatani K, Yau K-W. Calcium and light adaptation in retinal rods and cones. Nature. 1988a;334:69–71. doi: 10.1038/334069a0. [DOI] [PubMed] [Google Scholar]
- Nakatani K, Yau K-W. Calcium and magnesium fluxes across the plasma membrane of the toad rod outer segment. J Physiol (Camb) 1988b;395:695–729. doi: 10.1113/jphysiol.1988.sp016942. [DOI] [PMC free article] [PubMed] [Google Scholar]
- Nakatani K, Yau K-W. Sodium-dependent calcium extrusion and sensitivity regulation in retinal cones of the salamander. J Physiol (Camb) 1989;409:525–548. doi: 10.1113/jphysiol.1989.sp017511. [DOI] [PMC free article] [PubMed] [Google Scholar]
- Perry RJ, McNaughton PA. Response properties of cones from the retina of the tiger salamander. J Physiol (Camb) 1991;433:561–587. doi: 10.1113/jphysiol.1991.sp018444. [DOI] [PMC free article] [PubMed] [Google Scholar]
- Pugh EN. Rhodopsin flash photolysis in man. J Physiol (Camb) 1975;248:393–412. doi: 10.1113/jphysiol.1975.sp010981. [DOI] [PMC free article] [PubMed] [Google Scholar]
- Ratto GM, Payne R, Owen WG, Tsien RY. The concentration of cytosolic free calcium in vertebrate rod outer segments measured with fura-2. J Neurosci. 1988;8:3240–3246. doi: 10.1523/JNEUROSCI.08-09-03240.1988. [DOI] [PMC free article] [PubMed] [Google Scholar]
- Sampath AP, Matthews HR, Cornwall MC, Fain GL. Bleached pigment produces a maintained decrease in outer segment Ca2+in salamander rods. J Gen Physiol. 1998;111:53–64. doi: 10.1085/jgp.111.1.53. [DOI] [PMC free article] [PubMed] [Google Scholar]
- Schnetkamp PP, Basu DK, Li XB, Szerencsei RT. Regulation of intracellular free Ca2+ concentration in the outer segments of bovine retinal rods by Na-Ca-K exchange measured with fluo-3. II. Thermodynamic competence of transmembrane Na+ and K+ gradients and inactivation of Na+-dependent Ca2+extrusion. J Biol Chem. 1991a;266:22983–22990. [PubMed] [Google Scholar]
- Schnetkamp PP, Li XB, Basu DK, Szerencsei RT. Regulation of free cytosolic Ca2+concentration in the outer segments of bovine retinal rods by Na-Ca-K exchange measured with fluo-3. I. Efficiency of transport and interactions between cations. J Biol Chem. 1991b;266:22975–22982. [PubMed] [Google Scholar]
- Schnetkamp PP, Szerencsei RT. Intracellular Ca2+sequestration and release in intact bovine retinal rod outer segments. Role in inactivation of Na-Ca-K exchange. J Biol Chem. 1993;268:12449–12457. [PubMed] [Google Scholar]
- Schröder WH, Fain GL. Light-dependent calcium release from photoreceptors measured by laser micro-mass analysis. Nature. 1984;309:268–270. doi: 10.1038/309268a0. [DOI] [PubMed] [Google Scholar]
- Williams TP. Photoreversal of rhodopsin bleaching. J Gen Physiol. 1964;47:679–689. doi: 10.1085/jgp.47.4.679. [DOI] [PMC free article] [PubMed] [Google Scholar]
- Yau K-W, McNaughton PA, Hodgkin AL. Effect of ions on the light-sensitive current in retinal rods. Nature. 1981;292:502–505. doi: 10.1038/292502a0. [DOI] [PubMed] [Google Scholar]
- Yau K-W, Nakatani K. Cation selectivity of light-sensitive conductance in retinal rods. Nature. 1984a;309:352–354. doi: 10.1038/309352a0. [DOI] [PubMed] [Google Scholar]
- Yau K-W, Nakatani K. Electrogenic Na-Ca exchange in retinal rod outer segment. Nature. 1984b;311:661–663. doi: 10.1038/311661a0. [DOI] [PubMed] [Google Scholar]
- Yau K-W, Nakatani K. Light-induced reduction of cytoplasmic free calcium in retinal rod outer segment. Nature. 1985;313:579–582. doi: 10.1038/313579a0. [DOI] [PubMed] [Google Scholar]
- Younger JP, McCarthy ST, Owen WG. Light-dependent control of calcium in intact rods of the bullfrog rana-catesbeiana. J Neurophysiol. 1996;75:354–366. doi: 10.1152/jn.1996.75.1.354. [DOI] [PubMed] [Google Scholar]