

Abstract
The radial localization and properties of elementary calcium release events (“puffs”) were studied in Xenopus oocytes using a confocal microscope equipped with a piezoelectric focussing unit to allow rapid (>100 Hz) imaging of calcium signals along a radial line into the cell with a spatial resolution of <0.7 μm. Weak photorelease of caged inositol 1,4,5-trisphosphate (InsP 3) evoked puffs arising predominantly within a 6-μm thick band located within a few micrometers of the cell surface. Approximately 25% of puffs had a restricted radial spread, consistent with calcium release from a single site. Most puffs, however, exhibited a greater radial spread (3.25 μm), likely involving recruitment of radially neighboring release sites. Calcium waves evoked by just suprathreshold stimuli exhibited radial calcium distributions consistent with inward diffusion of calcium liberated at puff sites, whereas stronger flashes evoked strong, short-latency signals at depths inward from puff sites, indicating deep InsP 3-sensitive stores activated at higher concentrations of InsP 3. Immunolocalization of InsP 3 receptors showed punctate staining throughout a region corresponding to the localization of puffs and subplasmalemmal endoplasmic reticulum. The radial organization of puff sites a few micrometers inward from the plasma membrane may have important consequences for activation of calcium-dependent ion channels and “capacitative” calcium influx. However, on the macroscopic (hundreds of micrometers) scale of global calcium waves, release can be considered to occur primarily within a thin, essentially two-dimensional subplasmalemmal shell.
Keywords: calcium, inositol trisphosphate, oocyte, confocal microscopy
introduction
Recent improvements in calcium imaging techniques have revealed that release of calcium from intracellular organelles into the cytosol occurs as transient, elementary signals, arising at specific subcellular release sites. Examples of such elementary events are calcium “puffs” mediated through myo-inositol 1,4,5-trisphosphate (InsP 3)1 receptors in Xenopus oocytes and HeLa cells (Parker and Yao, 1991; Yao et al., 1995; Bootman et al., 1997a,b; Sun et al., 1998), and calcium “sparks” mediated through ryanodine receptors in cardiac muscle (Cheng et al., 1993). When the excitability of the release system is low, puffs and sparks arise autonomously at discrete functional release sites, giving rise to brief (tens of milliseconds) increases in cytosolic free [Ca2+] that remain localized within a few micrometers. If the excitability of the cytoplasm is increased, however, the calcium release units become functionally coupled by a process of calcium-induced calcium release (CICR; Fabiato, 1985; Bezprozvanny et al., 1991; Finch et al., 1991), leading to the generation of repetitive calcium waves that may propagate globally throughout the cell (Takamatsu and Wier, 1990; Lechleiter and Clapham, 1992; Parker and Yao, 1991).
The spatial arrangement of functional release sites in the cytoplasm is a major factor in determining which signaling elements are exposed to localized calcium elevations during elementary events. Furthermore, the mean spacing between sites influences the probability of functional coupling, and thus the likelihood that a calcium wave will propagate (Bugrim et al., 1997). In highly ordered muscle cells, the arrangement of release sites and the functional interactions between sites are highly anisotropic. Calcium release in cardiac myocytes is localized at the Z lines so that sparks are observed at regular intervals of 1.8 μm (the sarcomere spacing) along the length of the cell (Shacklock et al., 1995). This separation is sufficiently great that spontaneous and evoked sparks originating at one Z line almost invariably fail to trigger sparks at neighboring Z lines (Parker et al., 1996c; Zang et al., 1997). On the other hand, release sites are packed more closely and irregularly across the width of the myocyte (i.e., along the Z line), and a majority of sparks involve near-synchronous activation of two or more adjacent sites (Parker et al., 1996c; Zang et al., 1997).
The Xenopus oocyte is a popular cell type for study of both elementary and global calcium signals mediated by InsP 3 receptors (Parker et al., 1996a; Lechleiter and Clapham, 1992; Berridge, 1997). Confocal microscopic studies with video-rate and linescan imaging systems have shown that InsP 3-sensitive release sites in the oocyte are distributed irregularly in the x and y axes (parallel to the plane of the membrane), at mean spacings of a few micrometers (Yao et al., 1995; Parker et al., 1996a, Callamaras et al., 1998), but less is known of their radial distribution into the oocyte. Unlike small, transparent cells, such as the cardiac myocyte, in which linescan confocal images can be made through any desired axis (x, y, and z), it has been difficult to obtain information about the radial organization of calcium release events in the oocyte because its large size (which is otherwise one of its advantages as an experimental system) and optical turbidity preclude scanning laterally along a diameter through the center of the cell.
To circumvent these problems, we developed a piezoelectric drive system that rapidly (>100 Hz) focused the microscope objective lens in the axial (z) dimension, so as to obtain time-resolved radial images of calcium release events evoked by flash photolysis of caged-InsP 3. Results obtained in this way indicate that puffs arise largely from release sites distributed in a thin (6 μm), superficial band a few micrometers below the cell surface, that puffs frequently involve the concerted activation of radially neighboring sites, and that strong stimulation can elicit a more diffuse release from stores deeper in the oocyte.
methods
Materials
Oregon green-1, Calcium green-5N, caged fluorescein dextran, and fast DiI (1,1′-dioleyl-3,3,3′,3′-tetramethylindocarbocyanine methane-sulfonate) were obtained from Molecular Probes Inc. Caged InsP 3 was from Calbiochem Corp. and Molecular Probes, Inc. Polyclonal anti–InsP 3R antibody was purchased from Affinity BioReagents Inc., monoclonal anti–InsP 3R antibody from Accurate Chemical and Scientific Co., and affinity-purified goat anti– rabbit FITC- and goat anti–mouse Cy3-conjugated secondary antibodies were from Jackson ImmunoResearch. All other reagents were from Sigma Chemical Co.
Preparation of Oocytes and Solutions
Experiments were done on immature oocytes of Xenopus laevis, prepared as described previously (Parker, 1992; Sun et al., 1998; Callamaras and Parker, 1998). In brief, frogs were anaesthetized by immersion in a 0.17% aqueous solution of MS-222 (3-aminobenzoic acid ethyl ester) for 15 min, and were allowed to recover after surgical removal of small pieces of ovary. Oocytes were isolated, and the epithelial layers removed either manually or by collagenase treatment. Oocytes were then loaded by intracellular microinjection, 1–2 h before recording, with the fluorescent calcium indicators Oregon green 488 BAPTA-1 (Oregon green-1) or Calcium green-5N, together with caged InsP 3 (InsP 3, P4(5)-1-[2-nitrophenyl] ethyl ester), to respective final intracellular concentrations of ∼40 and 5 μM (assuming distribution throughout a cytosolic volume of 1 μl). Recordings were made at room temperature, with oocytes bathed in normal Ringer's solution containing (mM): 120 NaCl, 2 KCl, 1.8 CaCl2, 5 Hepes, pH ∼7.2. All data were obtained in the vegetal hemisphere of the oocytes, as this hemisphere lacks heavy pigmentation, and allows imaging to greater depths than in the animal hemisphere.
Axial Confocal Linescan Imaging
Confocal imaging and flash photolysis of caged InsP 3 were performed using a “home-made” optical system constructed around an inverted microscope (IX70; Olympus Corp.; Parker et al., 1997). In brief, flashes of near-UV light were used to evoke photolytic release of InsP 3, while calcium-dependent fluorescence signals were monitored simultaneously from a sub-femtoliter confocal volume by focussing a beam of 488-nm light from an argon laser onto a diffraction-limited spot within the oocyte. Emitted fluorescence at wavelengths >510 nm was then monitored through a confocal pinhole by an avalanche diode photon counting module (EG & G Canada Ltd.). The major modification in the present experiments was that, instead of using a galvanometer mirror to rapidly scan the confocal spot in the x direction parallel to the oocyte membrane, the spot remained stationary in the x and y directions as the microscope objective was rapidly focused up and down to image along an axial line (z direction) radially into the oocyte.
Fig. 1 A shows a schematic of the axial-scanning confocal system. A 40× oil immersion objective (Olympus fluor; Olympus Corp.; NA = 1.35) was mounted on a piezoelectric focussing drive (P-721.10; Polytec PI Inc.), which in turn was mounted to the nose piece of the inverted microscope. Although the piezo drive incorporated a position sensor and was driven by a servo-feedback amplifier (E-810.10; Polytec PI Inc.), we found that it could not follow linear ramp command signals at rates faster than 30 Hz due to excessive ringing on the flyback. Instead, we used a sine-wave command signal and used image data collected only during the approximately linear portions of the cyclical scan. Recordings from the position sensor showed that the objective could be driven in this mode at rates up to 200 Hz, with a maximum excursion of ∼35 μm. To reduce transmission of vibration from the objective to the specimen through the microscope immersion oil, we used a low-viscosity oil and constructed a rigid recording chamber, milled from a block of Plexiglas, which was firmly bolted onto the microscope stage. The oocyte was imaged through a coverglass cemented to the base of the chamber with super-glue and flexure of the coverglass was reduced by using a small (5-mm diameter) aperture in the base of the chamber. This recording configuration allowed maximum scan rates of up to 100 Hz. It was also imperative that the immersion oil be completely free of air bubbles, which otherwise drifted to the center of the lens and expanded enormously on the down strokes of the positioner.
Figure 1.

System for rapid confocal scanning along the z axis of the microscope. (A) Schematic diagram of the optical system, constructed around an Olympus IX70 inverted microscope. Two dichroic mirrors (DM1 and DM2) in the light path provided, respectively, for irradiation by near-UV light from a shuttered arc lamp for photolysis of caged InsP 3 and for confocal monitoring of calcium-dependent fluorescence signals. DM1 and the excitation filter F1 were located in a standard epifluorescence cube in the microscope. DM2 and the confocal optics were mounted on an external optical breadboard, and interfaced through the video port of the microscope. Light (λ 355 nm) from a pulsed UV laser (not shown) was combined with that from the arc lamp by a beam splitter. The objective lens was driven by a piezoelectric translator (PZT) to rapidly focus through a range of up to 35 μm at rates up to 200 Hz. The oocyte was viewed through a coverglass cemented in a small (5-mm diameter) aperture in a rigid Plexiglas chamber, firmly bolted to the microscope stage. DM1, dichroic mirror reflecting λ < 400 nm; DM2, dichroic mirror reflecting λ < 500 nm; F1, bandpass filter λ 340–400 nm; F2, barrier filter, λ > 510 nm; Ar ion laser, attenuated 488-nm beam from 100 mW argon ion laser; APD, avalanche photodiode photon counting module. (B) Traces showing position of the piezo drive during one cycle of the sine-wave scan (top) and corresponding output from the fluorescence detector after addition of sync pulses (bottom). The fluorescence signal was obtained while scanning into an oocyte, and the extreme downward deflection of the scan (trough of sine wave at center of scan cycle) corresponds to the position of the coverglass. Two broad fluorescence peaks are apparent, resulting as the spot scanned from within the oocyte toward the cover glass (left), and again as the objective moved back in the reverse direction (right). The fluorescence deep within the oocyte is low because of light scattering and absorption, and irregular troughs arise as the spot moves through organelles. The fluorescence profiles on the “down” and “up” scans are not perfect mirror images because of lateral hysteresis in the translator. (C) Axial linescan image showing reflectance from a mirrored slide as the microscope focus was advanced by hand in 2-μm increments at roughly 1-s intervals. Each vertical line forming the image comprises one cycle of the scan, and time runs from left to right. (D) Plot of pixel position versus focus displacement for the selected region (arrows) of the image in C. The central portion of the scan was close to linear over a range of ∼22 μm.
The approximately sinusoidal output from the position sensor was connected to a threshold comparator to produce synchronization pulses, which were then added to the continuous stream of fluorescence data from the confocal detector, as illustrated in Fig. 1 B, showing resting fluorescence from a dye-loaded oocyte. The resulting analogue signal was digitized and stored on computer disc for subsequent construction of line scan images using routines written in the IDL programming language (Research Systems Inc.). Images were usually formed at a rate of 100 Hz, with integration times of 10 or 20 μs per pixel and a peak-to-peak scan amplitude of ∼32 μm; providing nominal pixel sizes of ∼0.05 or 0.1 μm throughout the linear range of the scan. Only data collected during the downward scan of each cycle were used to construct images, as lateral hysteresis of the piezo drive unit resulted in the upward scan imaging a slightly different region of the cell.
Fig. 1, C and D, illustrates the procedure used to calibrate the distance scale of axial-scan images and to determine the linearity of the scan. A mirrored slide was used as a test specimen so that, after removing barrier filter F2, sharp peaks of reflected laser light were detected as the laser spot focused through the mirrored surface. An image (Fig. 1 C) was then acquired while the focus knob on the microscope was used to advance the microscope nose piece in 2-μm increments through a total range greater than the piezo scan. At intermediate manual focus positions (Fig. 1 C, center), two bright lines were seen in the image as the piezo scan moved the laser spot upward and downward through the mirror. Displacement away from this intermediate position caused the lines in the image to converge, as the nose piece was moved so that the laser spot focused on the mirror only at the extreme upward and downward deflections of the piezo scan (Fig. 1 C, left and right edges). The image, therefore, effectively traces the sinusoidal piezo scan, allowing a calibration to be made between pixel position in the axial-scan image (depicted vertically) and physical position of the objective lens (depicted horizontally, with 2-μm steps). Fig. 1 D shows a plot of pixel position of peak reflectance against displacement of the microscope nose piece over the region of the image in Fig. 1 C marked by the arrows. With the system set to give a peak-to-peak displacement of 32 μm, a calibration factor of 0.091 μm per pixel was obtained throughout a linear range of >20 μm around the center of the scan (see Fig. 2 D). Outside this range, the relationship between pixel position and displacement became increasingly nonlinear, as the objective approached the extremes of its excursion.
Figure 2.

Optical resolution of the axial scanning system. (A) Images of fluorescent pollen grains (mixed pollen grain slide; Carolina Biological Supply). The upper frame shows a z-y image, obtained using the piezo drive to scan rapidly (100 Hz) in the z axis, while the laser spot was scanned slowly in the y axis by a rotating mirror. For comparison, the lower frame shows a conventional, lateral x-y scan of a matching region of a different pollen grain, obtained using a galvanometer-driven mirror to scan rapidly in the x axis. (B) Images illustrating the lateral resolution of the microscope when focused to different depths into an oocyte. Each frame shows the tip of a fluorescein-filled micropipette that was inserted through an oocyte to different depths (indicated in micrometers) relative to the pigment granules on the lower (vegetal) side of the oocyte. See text for further details. Images are individually normalized to the peak intensity within the frame. (C) Measurements of absolute peak fluorescence from images like those in B, plotted as a function of distance into the oocyte, relative to the pigment granules. (D) Measurements of the full-width at half-maximal intensity from images like those in B.
The above distance calibration refers to physical displacement of the objective lens. When viewing in aqueous media, however, the discrepancy in refractive index between water and the cover glass and immersion oil results in a change in focal distance in the specimen that is less than the corresponding movement of the objective. To correct for this effect, axial positions in the oocyte were scaled by dividing measurements of objective position by a factor of 1.17. This value was derived experimentally by focussing the microscope on the tip of a microelectrode as it was advanced through water by a calibrated micromanipulator, and confirmed by measuring lateral and axial diameters of spherically symmetrical, 15-μm diameter fluorescent beads.
Photolysis of Caged Compounds
Unless otherwise noted, UV (340–400 nm) photolysis light was derived from a mercury arc lamp, and focused as a spot 150 μm in diameter concentric and confocal with the imaging laser spot. The light intensity was regulated by neutral density filter wheels, such that photolysis flashes with durations between 20 and 100 ms evoked calcium puffs and waves. Due to the “wide-field” illumination of the photolysis light, and the long duration of photolysis flashes relative to the axial scan cycle, we expected that InsP 3 would not be preferentially released at any particular depth in the oocyte. Experimental confirmation of the uniformity of photolysis evoked at different depths into the cell was obtained by loading oocytes with caged fluorescein dextran (mol wt, 3,000) to a final intracellular concentration of ∼100 μM, and imaging the release of fluorescein by axial scanning (see Fig. 3 B).
Figure 3.
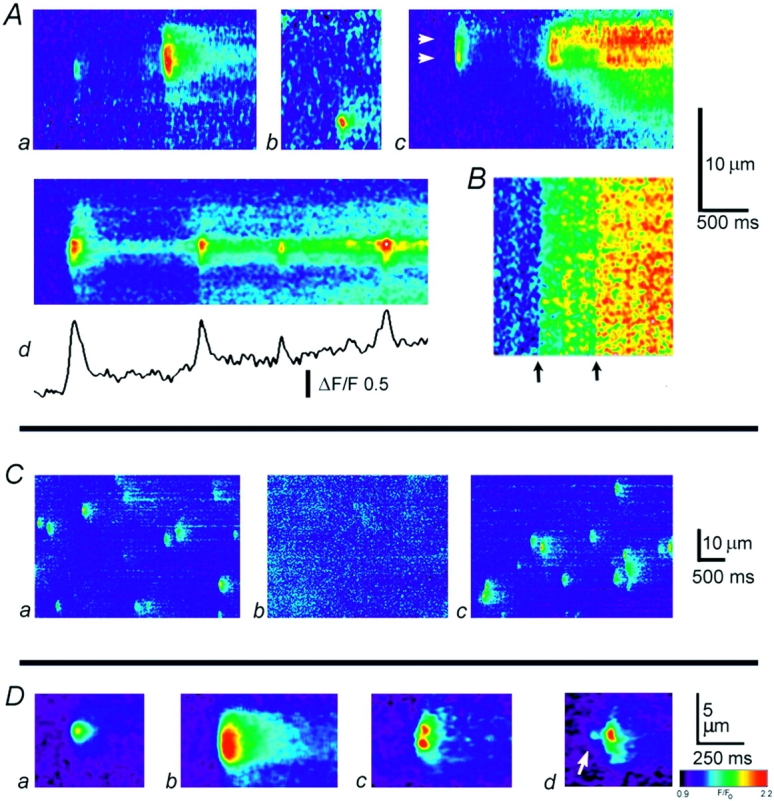
Radial distribution of calcium puffs evoked by photoreleased InsP 3. (A) Radial scan images showing puffs and calcium wave evoked by brief photolysis flashes. Distance into the oocyte is depicted vertically, and time runs from left to right. The cell surface corresponds to the top of the image, and increasing calcium levels (increasing fluorescence ratio F/F o of Oregon green-1) are depicted by increasingly “warm” colors. Each image was independently scaled so that the maximal fluorescence is depicted as red. Photolysis flashes were applied at varying times before each record. Flashes in a, b, and d evoked only calcium puffs, whereas that in c was sufficiently strong to just evoke a calcium wave. The trace in d shows fluorescence monitored at the active site in the image. (B) Photorelease of fluorescein from a caged precursor, demonstrating uniformity of photolysis at different depths in the oocyte. Radial scan image shows responses to two identical photolysis flashes, delivered when indicated by the arrows. (C) Lateral (x) scan images showing puffs evoked by sustained photorelease of InsP 3 with the microscope focussed at different depths. The oocyte was continuously exposed to strongly attenuated photolysis light, beginning ∼2 min before recording. Images were acquired sequentially at the granule layer (a), at a depth 11 μm further into the cell (b), and after refocusing at the granule layer (c). (D) Examples of different puff morphologies, imaged by radial scanning. (a and b) Averaged images showing, respectively, presumptive single- and multiple-site puffs. Each frame is an average of six individual events that were selected by eye. Averages were formed after aligning events in space and time, and do not indicate the positions of the events relative to the cell surface. Both images are shown on a common pseudocolor scale, corresponding to fluorescence ratios (F/F o) as indicated by the color bar. (c) An individual event arising through near-synchronous release at two radially separated sites. (d) A puff preceded by a blip (arrow).
In other experiments (see Fig. 5, D–F), photorelease of InsP 3 was localized to particular depths within the cell by using pulses of UV light (355 nm) from a frequency-tripled Nd-YAG laser (Mini-Lite; Continuum). The laser beam was expanded to fill the rear aperture of the objective lens, and focused to a near diffraction-limited spot centered on, and concentric with, the spot from the argon laser used for fluorescence imaging (Parker et al., 1997). Single pulses from the laser were triggered in synchronization with the scan of the piezo-translator so that, by varying the delay relative to the scan sync pulse, a photolysis flash could be delivered when the objective was focussed at any desired depth throughout the scan. Because the laser pulse duration (5 ns) was so short in comparison to the scan cycle (10 ms), all the photolysis light was delivered without appreciable movement of the objective lens. Photorelease of InsP 3 was not confined exclusively to the tightly focussed spot as, with single-photon excitation, photolysis varies linearly with light intensity. Instead, a side view of the beam formed by the objective lens would resemble an “hour-glass” shape, with decreasing light intensity above and below the beam waist. Nevertheless, the highest concentration of InsP 3 would be formed at the focussed spot and, because of the nonlinear activation of InsP 3 receptors (Callamaras et al., 1998a), resulted in localized calcium signals.
Figure 5.

Calcium release at depths below the puff sites. (A) Radial linescan image in response to a suprathreshold, wide-field flash shows calcium liberation beginning independently after varying latencies at different depths. (B) Abrupt calcium release evoked with short latency at all depths by a strong photolysis flash, with an intensity ∼10× that required to just evoke a calcium wave. The image was processed by rebinning the original record to expand five times in time and two times in space, and then applying three iterations of a 3 × 3 pixel smoothing function. A faint artifact is present during the photolysis flash. (C) Diffusive spread of calcium, shown on the same scales for comparison with the InsP 3-evoked response in C. The image was obtained by lateral (x) scanning, and shows the spread of calcium released by local “photoperforation” induced by a 5-ns pulse from a frequency-tripled Nd-YAG laser focused to a spot (∼1-μm diameter) at the site indicated by the asterisk. The oocyte was loaded with Oregon green-1, without caged InsP 3. (D–F) Calcium release evoked by laser spot photolysis at different depths into the cell. A brief (5-ns) pulse of UV light was synchronized with the piezo-scan so that photolysis could be induced in an albino oocyte at a virtual “point” source at any desired depth throughout the scan. Axial scan images show responses at the same lateral position when the laser pulse was focussed to a spot (indicated by white arrows) near the granule layer (D) and at a depth ∼15 μm further into the cell (E). F shows an example where photorelease ∼25 μm into the oocyte evoked both a superficial puff and sustained calcium release beginning near the photolysis site.
Experiments with laser photorelease were done in albino oocytes, as light absorption by pigment granules during the extremely brief pulses otherwise causes local photodamage to the cell. For some experiments, however, this provided a convenient means to evoke local intracellular calcium elevations (see Fig. 5 C), by focussing the UV beam onto individual pigment granules, which are sparsely distributed in the vegetal hemisphere of normally pigmented oocytes.
Confocal Imaging of Endoplasmic Reticulum and InsP3 Receptors
The endoplasmic reticulum (ER) was visualized by confocal scanning of live oocytes injected ∼12 h previously with a bolus of 20 nl of vegetable oil saturated with fast DiI. Diffusion of the lipophyllic fluorescent dye within continuous membrane structures provides specific labeling of the ER (Terasaki and Jaffe, 1993), and images were obtained in the vegetal hemisphere ∼200 μm distant from sites of injections made on the equator (see Fig. 7, B and E).
Figure 7.

Morphology of the oocyte and correspondence of puff sites with localization of the ER and of InsP 3 receptors. (A–C) Confocal sections into the vegetal hemisphere of oocytes, with the vertical axis representing depth into the cell (z axis) and the horizontal axis lateral (y) position. Images were obtained by rapidly scanning in the x axis using a galvanometer mirror while slowly advancing the microscope focus using a synchronous motor. The aspect ratio provided square pixels. (A) Resting fluorescence of an oocyte loaded with Oregon green-1. (B) Distribution of ER stained with the lipophyllic dye fast DiI. (C) Distribution of InsP 3 receptors visualized using an anti–InsP 3 receptor antibody and an FITC-conjugated secondary antibody. (D–F) Images derived from those in A–C, by enhancement to partially compensate for the fall off in fluorescence at increasing depths as a result of light scattering and absorption. Fluorescence in all images was scaled by a correction factor increasing linearly from 1 at the level of the pigment granules (about one third the way down each image) to 3 at the bottom of the images. (G) Profile of fluorescence (arbitrary scale) as a function of depth, averaged across a 15-μm section in the y axis of A. (H) Histogram shows frequency of puff occurrence as a function of depth into the cell, replotted from Fig. 4 A, after scaling to match the dimensions of the images. (I) Distribution of InsP 3 receptors in the animal hemisphere of a physically sectioned oocyte. The image shows a lateral (x–y) confocal scan focused a few micrometers below the cut surface of the cell. Receptors were visualized using an anti–InsP 3 receptor antibody and Cy3-conjugated secondary antibody. The staining in this image is more dense and less obviously punctate than that in C, probably because the animal hemisphere shows a higher density of InsP 3 receptors and more closely packed functional release sites than does the vegetal hemisphere (Callamaras et al., 1998b). Diffuse fluorescence at the lower left arose primarily through incomplete blocking of autofluorescence by the barrier filter. Scale bar applies to all images in the figure.
InsP 3 receptor immunoreactivity was localized in intact oocytes (see Fig. 7, C and F) after fixing in 2% paraformaldehyde for 3 h and permeabilization by incubation for 1 h in Ringer's solution containing 10 μM digitonin. Oocytes were blocked with 1% BSA and 2% NGS for 1 h to reduce background staining. The cells were then washed in Ringer's containing 0.1% BSA and 0.5% NGS, incubated for 3 h with a 1:1,000 dilution of polyclonal anti– InsP 3 type-1 receptor antibody for 3 h, washed, and incubated with a 1:500 dilution of FITC-labeled secondary antibody for 1 h. After labeling with secondary antibody, oocytes were washed in Ringer's containing 0.1% BSA and 0.5% NGS at 4°C for at least 6 h to permit unbound secondary antibody to diffuse from the cell. Control oocytes were exposed to either whole rabbit IgG followed by secondary antibody, or to secondary antibody alone. Neither showed appreciable staining. Confocal x–z sections of both ER structure and InsP 3 receptor distribution were imaged using 488-nm excitation and a 510-nm long-pass barrier filter. Images were obtained by rapidly scanning in the x axis, while the microscope focus was progressively advanced using a synchronous motor to drive the focus knob.
Images of InsP 3 receptor distribution in sectioned oocytes (see Fig. 7 F) were obtained by fixing oocytes in 4% paraformaldehyde and 0.1% gluteraldehyde for 3 h, embedding in 3.5% agar made up in Ringer's solution, and then cutting thick (500–750-μm) sections. The sections were then post-fixed with 2% formaldehyde and 0.05% gluteraldehyde for 10 min, incubated for 2 h with 1:500 monoclonal anti–InsP 3 type-1 receptor antibody, washed, incubated for 2 h with 1:500 Cy3-conjugated secondary antibody and washed for >3 h before imaging. Oocyte sections were observed as whole mounts, with the cut surface face down on a coverglass while bathed in Ringer's solution. Confocal images were obtained scanning a few micrometers below the cut surface of the oocyte using 488 nm excitation and a 600-nm long-pass barrier filter.
results
Resolution of the Axial Scanning System
The axial point spread function of the fast z-scanning system was measured under ideal conditions by imaging through 0.1-μm diameter fluorescent beads embedded in mounting medium. The mean axial full width at half-maximal amplitude (FWHM) was 0.72 μm. This value is slightly worse than the axial resolution of ∼0.5 μm obtained using a motor to slowly advance the microscope focus (Parker et al., 1997), probably due to mechanical and electrical “jitter” in the piezoelectric unit and the synchronization circuit. A visually intuitive indication of the axial resolution is provided by Fig. 2 A (top), showing a z–x image of a fluorescent pollen grain obtained using fast z scanning. This may be compared with an image obtained scanning laterally (x–y scan) through a similar pollen grain (Fig. 2 A, bottom).
Optical Characteristics of the Oocyte
Although the performance of the axial-scan system with “ideal” transparent test specimens was close to diffraction limited, we expected that its resolution would be considerably degraded in the oocyte, where the presence of numerous organelles and granules creates a highly turbid medium. To evaluate the optical properties of the oocyte cytoplasm, we inserted a sharp micropipette filled with fluorescein vertically downward through the center of an oocyte until the tip approached within a few tens of micrometers of the lower surface of the cell. The microscope was then used in lateral (x–y) scanning mode to image the fluorescent spot formed when the microscope was focused ∼4 μm back from the tip of the pipette. Test images formed in this way with the pipette in water gave a lateral FWHM of ∼0.5 μm, only slightly wider than that obtained with 0.1 μm beads (0.3 μm), suggesting that the column of fluorescein near the pipette tip approximated a lateral point source of fluorescence. Fig. 2 B illustrates x–y images of the fluorescein pipette as it was advanced through the oocyte to various distances from the lower surface of the cell. Images with the pipette tip close to the membrane showed a sharply defined fluorescence spot, with widths (FWHM 0.6–0.7 μm) similar to that obtained in water. At increasing depths from the cell surface, however, the fluorescence spot became much dimmer and less sharp. Fig. 2 C plots peak fluorescence as a function of increasing depth into the cell. Fluorescence declined abruptly >5 μm inward from the layer of pigment granules and reduced to <1% at depths greater than ∼20 μm. The decline can be attributed almost entirely to the optical properties of the oocyte, rather than to increasing spherical aberration resulting from refractive index mismatch in an aqueous medium, as control measurements showed a decrease in fluorescence of only ∼50% when imaging through a 50-μm thickness of water. Degradation of the point spread function with depth was less marked than the fall-off in peak fluorescence intensity; the FWHM remained better than 1 μm to depths of ∼20 μm before degrading abruptly (Fig. 2 D).
Axial Linescan Imaging of Puffs
Fig. 3 A shows representative axial scan images of calcium signals evoked in oocytes loaded with Oregon green-1 in response to photorelease of InsP 3. The flash strengths were adjusted so as to evoke discrete puffs in (a, b, and d), whereas a slightly stronger flash evoked a calcium wave in (c). In these and other axial-scan images, the vertical axis represents distance into the cell, and time runs from left to right. The fluorescence intensity at each pixel is depicted on a pseudocolor scale, after expression as a ratio relative to the average resting fluorescence at that pixel before stimulation (F/F o) so as to compensate for the drop-off in detected fluorescence with increasing depth into the oocyte.
Calcium puffs arose at discrete radial locations, following randomly varying latencies after photolysis flashes. The images in Fig. 3 A were clipped out from longer records (thus the timing of photolysis flash is not observable) and aligned so that the top of the frames corresponds to the cell surface. Puffs arose at specific locations, from which repeated responses could be elicited in response to successive flashes (data not shown), or sometimes after a single photolysis flash (Fig. 3 A, d). The sites giving rise to puffs were predominantly located within a band ∼6-μm wide, lying close below the cell surface (Fig. 3 A, a, c, and d), although a few deeper puffs were observed (e.g., Fig. 3 A, b).
Radial Distribution of Puffs Does Not Arise through Nonuniform Photorelease of InsP3
Two control experiments indicated that the fall off in puff frequency with depth reflects a decreasing density of puff sites, rather than arising artifactually because progressive attenuation of the UV light by scattering and absorption resulted in decreased photorelease of InsP 3.
First, we imaged the formation of fluorescein from a weakly fluorescent caged precursor to obtain data on the efficiency of uncaging as a function of depth. Fig. 3 B shows an axial scan image from an oocyte loaded with caged fluorescein dextran (mol wt, 3,000) in response to two successive photolysis flashes. Fluorescence is depicted as a ratio (F/F o) relative to the initial fluorescence of contaminating free fluorescein. The first flash evoked a less than half-maximal fluorescence increase, and the fluorescence ratio change was similar at all depths along the axial scan. In 21 trials (five oocytes), the mean fluorescence ratio change evoked by submaximal photolysis flashes at a depth 20 μm into the oocyte was 99.4 ± 3% (SEM) of that at the granule layer, indicating that there was no appreciable attenuation of photolysis light at this depth. This result differs from the marked fall off in confocal fluorescence signal (Fig. 2 C), which is more abrupt both because it represents a double transit of light through the cytoplasm and because, in contrast to the wide-field photolysis light, scattering greatly degrades the sharply focussed confocal spot.
Second, we evoked puffs by continuous photorelease with low intensity UV light, so that diffusion would equilibrate the concentration of InsP 3 throughout several tens of micrometers into the cell, even if it were formed only at the cell surface. Fig. 3 C shows lateral scan images with the microscope focused at the granule layer. In contrast to the frequent, sharply defined puffs observed at the granule layer (a and c), no puffs were discerned at a depth 11 μm further into the cell (b). These records were obtained beginning 2 min after the onset of photolysis, and assuming a diffusion coefficient of 250 μm2 s−1 for InsP 3 in the cytosol (Allbritton et al., 1992), the difference in concentration of InsP 3 between these depths would have been <1% even if photolysis were restricted to near the cell surface.
Puff Characteristics
Puffs imaged by axial scanning tended to fall into two distinct categories, showing either a sharply restricted radial spread (e.g., first event in Fig. 3 A, a), or a more “blunt” appearance with greater spatial spread (second event in Fig. 3 A, a). Fig. 3 D shows averaged axial images formed from typical sharp (a) and blunt (b) events. In some instances (e.g., Fig. 3 D, c), individual blunt events could be resolved into two local regions of elevated calcium, separated radially by ∼1.5 μm, but in most cases discrete peaks were not resolved. Nevertheless, the blunt sparks probably arise through near-synchronous calcium liberation at multiple, radially distributed sites, analogous to the multiple-site sparks previously described in transverse scans across cardiac myocytes (Parker et al., 1996c). Observations of both sharp and blunt events in the same axial scan (Fig. 3 A, a) indicate that the differences in spatial spread of calcium cannot be explained by local differences in calcium diffusion coefficient or from the presence of local diffusional barriers. Furthermore, the fact that peak calcium levels during blunt events were, on average, greater than during sharp events (Fig. 3 D, a and b) demonstrates that the blunt puffs did not arise artifactually through diffusion of calcium from sites at some lateral distance from the axial scan. Instead, it is likely that calcium liberation sometimes occurs at a single site along a radius into the cell, but that in other instances calcium liberation at one site may recruit radially neighboring sites via CICR. Such a process is evident in Fig. 3 A, c, where a blunt puff was followed by a sustained calcium liberation involving two sites that showed different patterns of activation (Fig. 3 A, c, arrows).
In addition to puffs, some axial scans showed smaller calcium events (e.g., Fig. 3 D, d) that likely correspond to previously described “blips” (Parker and Yao, 1996; Sun et al., 1998). These blips were observed at the same radial locations as puffs, lending further support to the idea that blips originate through opening of a small fraction of the release channels clustered at puff sites, rather than from isolated channels situated between puff sites (Sun et al., 1998).
Most puffs exhibited transient time courses, with the calcium fluorescence decaying back to the base line within a few hundred milliseconds. As illustrated in Fig. 3 A, d, however, a more sustained (several seconds) calcium liberation was sometimes evident, upon which discrete, transient release events were superimposed. The sustained release appeared to be localized to the same radial site at which puffs arose, and calcium diffused radially from this site both superficially and more deeply into the oocyte.
Radial Distribution of Puff Sites
Fig. 4 A shows measurements of the radial locations of 83 puffs recorded in the vegetal hemispheres of five oocytes. To provide a reference marker by which to locate positions between different scans and different cells, the puff positions are plotted relative to the mean depth of the pigment granules. These granules are present at low density even in the pale, vegetal hemisphere, and are localized within a narrow (0.87 μm SD) band a few micrometers below the cell surface. They thus provided a more precise reference point than could be achieved from the fall-off in resting fluorescence at the cell surface, which is blurred by the presence of microvilli. After recording each axial scan image, the location of the coverglass surface was registered on the image by removing the barrier filter to record reflectance of the laser beam at the glass/water interface, and the distance from the cover glass to the granules was subsequently measured by focussing the microscope while observing through the oculars.
Figure 4.

Puffs originate in a thin band close to the depth of the pigment granules, and often involve concerted activation of multiple radial sites. (A) Radial distribution of puffs evoked by photolysis flashes with strengths below the wave threshold. Measurements of axial puff locations were made from images like those in Fig. 3 A, and are plotted with respect to the position of pigment granules in each scan. In the case of presumptive multiple site puffs, locations were estimated by eye, assuming involvement of two release sites (e.g., Fig. 3 A, c, arrows). Data are from 83 events, recorded at 20 sites in the vegetal hemisphere of five oocytes. Similar results (not shown) were obtained in two further experiments on oocytes from different donor frogs. (B and C) Puffs in the vegetal hemisphere rarely involve multiple, laterally separated release sites, whereas they frequently involve synchronous activation of radially separated sites. Histograms show distributions of puff widths (full width at half-maximal amplitude) recorded in the vegetal hemisphere by axial (x) line scanning (B) and lateral (z) scanning (C). Axial measurements are from eight oocytes, and lateral measurements from five other oocytes.
Almost all puffs were observed within a band ∼6-μm wide, centered ∼1-μm superficial to the granule layer (Fig. 4 A). This decline in puffs with increasing depth did not arise through impaired resolution as a result of image degradation, as occasional deeper puffs were resolved clearly (e.g., Fig. 3 A, b), and the decline in puff numbers was more abrupt than the fall-off in fluorescence detection (Fig. 2 C).
Puffs Frequently Involve Multiple Radial Sites
As described above, many puffs in axial linescan images exhibited a wide spatial spread, while others were more sharply localized. To quantify those observations, we measured the full widths at half-maximal amplitude of puffs evoked in the vegetal hemisphere. The distribution of axial widths of 80 events is plotted in Fig. 4 B and, for comparison, Fig. 4 C shows corresponding measurements of lateral widths of puffs measured in the vegetal hemisphere of other oocytes by lateral (x) linescan imaging. In the vegetal hemisphere, there is little functional coupling between laterally adjacent sites (Callamaras et al., 1998b), and the distribution of lateral puff widths was fit well by a single Gaussian distribution (Fig. 4 C), with a mean (1.9 μm) corresponding to the diffusive spread of calcium from a virtual point source (Sun et al., 1998). Different from this, measurements of axial puff widths gave a multimodal distribution, and are shown fitted by the sum of two Gaussian components with means of 1.62 and 3.25 μm and respective relative areas of 1:2.5 (Fig. 4 B). The smaller component probably arises from events involving calcium liberation at single sites. Its mean is slightly smaller than the mean width of puffs in lateral (x) linescan images (1.62 vs. 1.9 μm), despite the broader axial point spread function of the microscope, suggesting that radial diffusion of calcium may be more restricted than lateral diffusion. We interpret the larger component to arise from events involving near-synchronous calcium liberation at two, radially adjacent sites, so the mean width of this component will include both the separation between sites and diffusive spread of calcium. On this basis, the difference between the means of the two components indicates that there is an average radial spacing between coupled release sites of 1.63 μm, and, from the relative areas of the components, it appears that “double” events comprise a majority (72%) of all puffs. Furthermore, there is some evidence from the data (Fig. 4 B) of a third component, corresponding to “triple” release events.
Strong Photorelease of InsP3 Evokes Calcium Liberation at Deep Sites
Calcium signals evoked by flashes with strengths that were just sufficient to evoke calcium waves usually exhibited a radial distribution consistent with a slow, decremental inward diffusion of calcium liberated at sites near the granule layer (e.g., Fig. 3 A, c). Other experiments with stronger photolysis flashes, however, gave clear evidence for release at deeper sites. For example, Fig. 5 A shows a relatively short-latency calcium signal at a depth of ∼10 μm, which began sooner than would be expected if it were triggered by inward diffusion of calcium from superficial sites. Furthermore, yet stronger photolysis flashes (∼10× wave threshold) evoked abrupt calcium signals with fluorescence ratios that did not decline with increasing depth into the cell (Fig. 5 B). The latencies to rise of these signals were shortest near the granule layer, but increased by only ∼40 ms at a depth 10 μm further inward. This delay is much shorter than would be expected if calcium were released only at puff sites, from where it diffused into the cell. For comparison, Fig. 5 C shows the time course of calcium diffusing from a local point source induced by photo-damage from a strong laser pulse, where the calcium signal at a distance of 10 μm lagged that at the source by ∼2 s (times to half-maximal rise).
Calcium release below the puff sites was also evident in experiments using a pulsed UV laser to evoke local photorelease of InsP 3 at different depths into the oocyte (see methods). Just-suprathreshold pulses delivered near the cell membrane produced calcium signals beginning near the surface, and spreading decrementally into the cell (Fig. 5 D). On the other hand, calcium responses to pulses delivered deep in the cell began as far as 15–20 μm below the surface (Fig. 5, E and F), demonstrating unequivocally the presence of InsP 3-sensitive release well below the puff sites (e.g., Fig. 5 F). Laser pulses of greater strength were required to evoke deep calcium signals, and these responses extended radially toward the surface of the oocyte, in contrast to the more limited inward spread of superficially evoked responses (Fig. 5, D and E). These results may be explained if a greater local concentration of InsP 3 is required to evoke calcium release at deep sites, and centrifugal diffusion of InsP 3 then evokes release at more sensitive, superficial sites.
To obtain further information about deep calcium liberation, we recorded lateral (x) linescan images with the microscope focused manually at various depths into the cell (Fig. 6, A and B). Data could thus be obtained at depths greater than the mechanical limit of the piezo-scanner, and the laser power was increased to partially compensate for the decrease in fluorescence at increasing depths. After flashes with strengths ∼10× the wave threshold, calcium at the granule layer rose abruptly with a latency of ∼150 ms, and linescan images (Fig. 6 A, second from top) showed a characteristic serrated wavefront, arising from independent activation of release at multiple discrete sites along the lateral scan line (Callamaras et al., 1998b). At increasing depths into the cell, the latency of the calcium signal became longer, its rising phase was slowed (Fig. 6 B), and the spatial distribution of calcium along the scan line became more uniform (Fig. 6 A). Fig. 6 C plots the peak fluorescence averaged across the scan line as a function of depth into the cell. Using both high and low affinity indicators (Oregon green-1 and calcium green-5N; filled and open symbols, respectively), there was no decline in fluorescence ratio over a radial distance of at least 30 μm. Corresponding measurements of response latency (to half-maximal rise of fluorescence) are shown in Fig. 6 D. With flashes ∼10× wave threshold (▪) the latency increased from a minimum of ∼140 ms at the granule layer to ∼500 ms at a depth 40 μm further into the cell. If calcium were liberated in the oocyte across a thin sheet, parallel to the cell surface, it should diffuse radially according to the equation L = (Dt)1/2, where L is the mean distance diffused in time t and D is the apparent diffusion coefficient for calcium in the cytosol. Measured values for D in the oocyte are ∼25 μm2 s−1 (Allbritton et al., 1992; Yao et al., 1995), so that diffusion over 40 μm is expected to take 64 s; much longer than the observed lengthening by 360 ms. Even more strikingly, very strong flashes (∼50× wave threshold) evoked more rapid responses, with latencies that lengthened by <80 ms over a depth of 30 μm. Recordings at these greater depths therefore provide further evidence that the calcium signals cannot arise through diffusion of calcium released superficially near the granule layer. The results may, instead, be explained if the kinetics of InsP 3-mediated calcium liberation (Parker et al., 1996b; Marchant and Taylor, 1997) are slower at increasing depths.
Figure 6.

Lateral (x) linescan imaging of calcium release evoked at different depths by strong photolysis flashes. (A) Images show calcium release monitored along a 50-μm lateral scan line with the microscope focussed at different depths into the oocyte (indicated in micrometers to the right of each frame relative to the pigment granule layer). Identical photolysis flashes (20 ms duration) with a strength ∼10× the wave threshold were delivered when marked by the arrow. (B) Corresponding measurements of fluorescence ratio averaged across a 30-μm wide region in the center of the images in A. The timing of the photolysis flashes is evident from the small artifacts. (C) The peak fluorescence signal during calcium waves remains roughly constant at increasing depths into the oocyte. Points show measurements of peak fluorescence ratio obtained from records like those in B, plotted as a function of depth relative to the pigment granules. Data are from two oocytes loaded with Oregon green-1 (filled symbols) and one oocyte loaded with the low-affinity indicator Calcium green-5N (open symbols). (D) Variation in latency of calcium signal (measured from beginning of photolysis flash to half-maximal rise of fluorescence) with depth into cell. Filled symbols show measurements from two oocytes loaded with Oregon green-1 in response to moderate (squares) and strong (circles) photolysis flashes, with respective strengths ∼10× and 50× the wave threshold. Open symbols show measurements from an oocyte loaded with Calcium green-5N, and stimulated by strong photolysis flashes.
Correlation of Calcium Release Sites with Oocyte Morphology
Fig. 7 A shows an x–z confocal section into the vegetal hemisphere of an oocyte, imaging the resting fluorescence of Oregon green-1 as a cytosolic marker. The fluorescence at depths greater than 10 μm declined markedly (Fig. 7 G) due to the turbidity of the oocyte (e.g., Fig. 2 C). To facilitate visualization of deeper structures, the “raw” fluorescence image in Fig. 7 A was enhanced by progressively scaling fluorescence values at increasing depths into the cell (Fig. 7 D). Several structural features are apparent, which can be identified by reference to electron micrographic studies of the immature oocyte (Campanella et al., 1984). Beginning at the cell surface (Fig. 7 D, top), microvilli of cytoplasm protrude from the general level of the cell perimeter. A few micrometers inward are voids of 1–2 μm diameter, corresponding to cortical granules. Pigment granules and glycogen granules are also located at this depth but, because of their smaller size (∼0.5 μm), are not well resolved in axial confocal scans. Finally, large (∼5.0 μm) yolk platelets are observed beginning ∼8 μm inward from the surface, where they occupy an appreciable fraction of the cell volume so that the cytoplasm is reduced to corridors between the platelets.
Oocytes injected with a bolus of oil containing the lipophyllic dye DiI to mark the ER exhibited a pattern of staining (Fig. 7 B, raw image, and E, enhanced image) similar to that of the cytosolic dye (Fig. 7 A), indicating that the ER is distributed throughout the superficial cytosol. In contrast, immunofluorescence images obtained using an anti–InsP 3 type-1 receptor antibody showed a highly punctate staining (Fig. 7 C). Bright spots were present at high density from just under the cell surface to a depth of 7–8 μm, and appeared to be distributed as two bands above and below the cortical granules. Enhancement of the image using the same algorithm as used for the images of cytosolic dye and ER failed to reveal any deeper punctate staining (Fig. 7 F), indicating that the superficial localization of receptors did not arise artifactually through attenuation of light into the cell. Furthermore, images of the animal hemisphere in fixed, sectioned oocytes showed intense globular staining of InsP 3 receptors in a thin subplasmalemmal band (Fig. 7 I), in agreement with earlier reports (Parys et al., 1992; Kume et al., 1993; Callamaras and Parker, 1994). The overall radial distribution of InsP 3R in the vegetal hemisphere matched well to the observed distribution of puff frequencies (Fig. 7 H). Individual spots of intense receptor staining extended only ∼0.5 μm laterally, whereas the spots were more elongated in the radial direction, sometimes extending for >2 μm.
discussion
Axial Scanning System
In the present study, we describe a piezoelectric scanning system that provided a means to obtain time- resolved confocal images of transient, microscopic Ca2+ signals along an axis running into the oocyte. We envisage that this technique may be useful not only for studies of large single cells such as Xenopus oocytes, but also for axial imaging into thick tissues and specimens. For example, whereas Kasai et al. (1997) used a piezo-driven objective to acquire sequential x–y calcium images of different cell layers within intact arteries at a rate of ∼1 s−1, the use of fast axial scanning would allow a much better time resolution. Furthermore, the response time of the piezo drive is sufficiently rapid that it could be used in conjunction with commercially available video-rate confocal microscopes so as to obtain x–z images at frame rates as fast as 60 s−1.
Radial Localization of Puff Sites
In previous experiments using lateral (x or x–y) imaging, we had shown that calcium puffs in the oocyte arise from discrete, fixed sites, which in the lateral plane appear as point sources of calcium liberation into the cytosol smaller than the limit of optical resolution (Yao et al., 1995; Sun et al., 1998). Furthermore, images of puffs obtained with the microscope focused at different depths are brightest and most sharply defined a few micrometers below the cell surface, suggesting that release sites are prevalent at this depth (Fig. 3 C; Yao et al., 1995). The present results, using fast piezo-driven axial scanning, confirm and extend that conclusion and show that puff sites in the vegetal hemisphere are distributed almost exclusively within a band ∼6-μm wide located close under the plasma membrane, which corresponds closely to the region of punctate staining of InsP 3 receptors (Fig. 6, F, H, and I).
Because a majority of puff sites are situated a few micrometers into the cell, it is unlikely that calcium-activated chloride channels in the surface membrane (Miledi and Parker, 1984) are able to sense the high (tens or hundreds of micromolar) free calcium concentrations existing at nanometer distances from open channels at the release sites, but instead, presumably, respond to the more diffuse elevation of calcium throughout the cytosol a few micrometers from release sites. This conclusion is in agreement with earlier observations of a delay of ∼30 ms between onset of InsP 3-mediated calcium liberation and rise of the chloride current, which we interpreted as arising through a diffusional delay (Parker and Ivorra, 1993). Recent findings that calcium-activated chloride channels in patches excised from the oocyte membrane require high free calcium concentrations for activation (EC50 > 25 μM; Neely et al., 1994; Gomez-Hernandez et al., 1997) are, therefore, surprising because bulk free [Ca2+] in the cytosol appears not to attain these levels even during supramaximal responses (Parker et al., 1996b). It remains to be determined whether the sensitivity of the chloride channels is higher in vivo, or whether they may operate under a regime of low probabilities of opening under physiological conditions.
The location of calcium release sites in relation to the plasma membrane is important also for induction of the calcium influx that develops after InsP 3-evoked calcium liberation as a result of depletion of intracellular calcium stores (“capacitative calcium entry;” Putney, 1993; Berridge, 1995). Proposed mechanisms by which store content regulates the plasma membrane calcium permeability include a diffusible calcium influx factor (Randriamampita and Tsien, 1993) or conformational coupling between proteins in the ER and plasma membrane (Irvine, 1990; Berridge, 1995). Calcium entry into the oocyte colocalizes within tens of micrometers with calcium release, arguing against involvement of a highly diffusible influx factor (Petersen and Berridge, 1996; Jaconi et al., 1997). On the other hand, our results show most puff sites located a few micrometers from the plasma membrane, a distance that could be readily spanned by a diffusible messenger, but incompatible with protein–protein interaction. A conformational coupling model may, therefore, involve only a small subset of InsP 3R or distinct regulatory proteins, present in the small part of the ER in close apposition to the plasma membrane (Gardiner and Grey, 1983).
Functional Coupling between Radial Puff Sites
In contrast to the paucity of events involving multiple lateral sites, axial scans showed many puffs with a wide radial spread, although sharply localized puffs were also observed, sometimes arising at the same sites. The blunt puffs could sometimes be resolved into two separate peaks, suggesting coupled activation of discrete, radially separated release sites, whereas the sharp puffs were consistent with calcium diffusion from a virtual point source. The much higher probability of radial, as opposed to lateral, coupling might then be explained by a closer spacing between sites in the radial, as compared with lateral direction. Consistent with this, the radial spacing was estimated to be ∼1.6 μm from the difference in mean widths of blunt and sharp radial puffs, whereas the mean lateral spacing between sites in the vegetal hemisphere is ∼2.25 μm (Callamaras et al., 1998b). An alternative possibility is that the majority of blunt puffs that do not show separate peaks arise not simply from a failure to resolve discrete release sites, but instead because InsP 3 receptors are distributed homogeneously along radially elongated structures like those visualized by immunofluorescence (Fig. 7 F).
The three-dimensional distribution of calcium ions diffusing from most puffs is, therefore, not spherically symmetrical, but resembles an hour glass, elongated along the radial axis of the oocyte. This complicates a method we had previously used to estimate the amount of calcium liberated during puffs imaged by lateral scanning, in which the fluorescence change was integrated assuming that the x-scan line passed diametrically through the center of a symmetrical sphere of calcium ions diffusing from a point source (Sun et al., 1998). The resulting errors should, nevertheless, be small, as a sharply resolved puff imaged by an x-linescan focused at the depth of one release site would detect only a small contribution from calcium diffusing from a second site 1.6 μm above or below. The amount of calcium liberated from a single site would thus have been slightly overestimated, though the coupled activation of paired radial sites, of course, involves nearly double the total amount of calcium.
Calcium Waves and Deep Release Sites
Calcium puffs and just-suprathreshold calcium waves evoked by low concentrations of InsP 3 appeared to involve calcium liberation restricted to a narrow, superficial band of calcium release sites that are preferentially activated during weak agonist stimulation of the InsP 3 pathway because of their high-sensitivity and close proximity to the source of InsP 3 formed at the plasma membrane. Nevertheless, strong photorelease of InsP 3 evoked calcium signals with radial profiles indicative of calcium liberation from deeper sites: the fluorescence ratio did not decline with increasing depth; latencies of calcium rise were too short to explain by calcium diffusing inward from superficial puff sites, and local photorelease of InsP 3 by a focused laser pulse evoked calcium release beginning at deep sites. This calcium liberation presumably arises through InsP 3R present throughout the bulk of the oocyte in yolk-free corridors of cytoplasm (Kume et al., 1997). Studies of the mechanisms underlying the deep liberation of calcium are hindered, however, both by optical limitations and because signals are evoked only by strong stimuli that already evoke superficial release. Although we were unable to detect discrete release events, it is not clear whether this was because of limited optical resolution or because deep release of calcium occurs in a more diffuse, graded manner.
Several studies have attempted to model calcium wave propagation through coupled processes of calcium diffusion and CICR, using either continuous reaction-diffusion equations (e.g., Atri et al., 1993) or, more recently, discontinuous models in which calcium liberation occurs only at discrete sites (Bugrim et al., 1997; Keizer et al., 1998). In the case of the oocyte, our results suggest that although release sites exhibit a complex three-dimensional organization on a microscopic scale, models of global signaling can be approximated as a two-dimensional process. CICR appears to be restricted to a thin, subplasmalemmal shell with moderate levels of InsP 3 that are closely suprathreshold to evoke waves, while the interior of the oocyte acts merely as a passive diffusional sink of calcium. However, it remains to be determined what roles the deeper calcium release evoked by strong stimulation may play in communicating calcium waves into the interior of the oocyte, and thereby regulate processes such as gene expression in the nucleus (Dolmetsch et al., 1998; Li et al., 1998).
Acknowledgments
We thank Dr. J.S. Kahle for editorial help.
This work was supported by a grant (GM-48071) from the National Institute of General Medical Sciences, National Institutes of Health.
Abbreviations used in this paper
- CICR
calcium-induced calcium release
- ER
endoplasmic reticulum
- FWHM
full width at half-maximal amplitude
- InsP3
inositol 1,4,5-trisphosphate
references
- Allbritton NL, Meyer T, Stryer L. Range of messenger action of calcium ion and inositol 1,4,5-trisphosphate. Science. 1992;258:1812–1815. doi: 10.1126/science.1465619. [DOI] [PubMed] [Google Scholar]
- Atri A, Admunson J, Clapham D, Sneyd J. A single pool model for intracellular calcium oscillations and waves in the Xenopus laevisoocyte. Biophys J. 1993;65:1727–1739. doi: 10.1016/S0006-3495(93)81191-3. [DOI] [PMC free article] [PubMed] [Google Scholar]
- Berridge MJ. Capacitative calcium entry. Biochem J. 1995;312:1–11. doi: 10.1042/bj3120001. [DOI] [PMC free article] [PubMed] [Google Scholar]
- Berridge MJ. Elementary and global aspects of calcium signalling. J Physiol (Camb) 1997;499:291–306. doi: 10.1113/jphysiol.1997.sp021927. [DOI] [PMC free article] [PubMed] [Google Scholar]
- Bezprozvanny I, Watras J, Ehrlich BE. Bell-shaped calcium-response curves for Ins(1,4,5)P 3- and calcium-gated channels from endoplasmic reticulum of cerebellum. Nature. 1991;351:751–754. doi: 10.1038/351751a0. [DOI] [PubMed] [Google Scholar]
- Bootman MD, Berridge MJ, Lipp P. Cooking with calcium: the recipes for composing global signals from elementary events. Cell. 1997a;91:367–373. doi: 10.1016/s0092-8674(00)80420-1. [DOI] [PubMed] [Google Scholar]
- Bootman MD, Niggli E, Berridge MJ, Lipp P. Imaging the hierarchical Ca2+signalling system in HeLa cells. J Physiol (Camb) 1997b;499:307–314. doi: 10.1113/jphysiol.1997.sp021928. [DOI] [PMC free article] [PubMed] [Google Scholar]
- Bugrim AE, Zhabotinsky AM, Epstein IR. Calcium waves in a model with a random spatially discrete distribution of Ca2+release sites. Biophys J. 1997;73:2897–2906. doi: 10.1016/S0006-3495(97)78318-8. [DOI] [PMC free article] [PubMed] [Google Scholar]
- Callamaras N, Marchant J, Sun X-P, Parker I. Activation and coordination of InsP 3-mediated elementary Ca2+ events during global calcium signals in Xenopusoocytes. J Physiol (Camb) 1998a;509:81–91. doi: 10.1111/j.1469-7793.1998.081bo.x. [DOI] [PMC free article] [PubMed] [Google Scholar]
- Callamaras N, Parker I. Inositol 1,4,5-trisphosphate receptors in Xenopus laevisoocytes: localization and modulation by calcium. Cell Calc. 1994;15:60–72. doi: 10.1016/0143-4160(94)90105-8. [DOI] [PubMed] [Google Scholar]
- Callamaras N, Parker I. Caged inositol 1,4,5-trisphosphate for studying release of Ca2+from intracellular stores. Methods Enzymol. 1998;291:380–403. doi: 10.1016/s0076-6879(98)91024-2. [DOI] [PubMed] [Google Scholar]
- Callamaras N, Sun X-P, Ivorra I, Parker I. Hemispheric asymmetry of macroscopic and elementary Ca2+ signals mediated by InsP 3 in Xenopusoocytes. J Physiol (Camb) 1998b;511:395–505. doi: 10.1111/j.1469-7793.1998.395bh.x. [DOI] [PMC free article] [PubMed] [Google Scholar]
- Campanella C, Andreucetti P, Taddei C, Talevi R. The modifications of cortical endoplasmic reticulum during in vitro maturation of Xenopus laevisoocytes and its involvement in cortical granule exocytosis. J Exp Zool. 1984;229:283–293. doi: 10.1002/jez.1402290214. [DOI] [PubMed] [Google Scholar]
- Cheng H, Lederer WJ, Cannell MB. Calcium sparks—elementary events underlying excitation–contraction coupling in heart muscle. Science. 1993;262:740–744. doi: 10.1126/science.8235594. [DOI] [PubMed] [Google Scholar]
- Dolmetsch RE, Xu K, Lewis RS. Calcium oscillations increase the efficiency and specificity of gene expression. Nature. 1998;392:933–936. doi: 10.1038/31960. [DOI] [PubMed] [Google Scholar]
- Fabiato A. Simulated calcium current can both cause calcium loading and trigger calcium release from sarcoplasmic reticulum of a skinned canine cardiac Purkinje cell. J Gen Physiol. 1985;85:291–320. doi: 10.1085/jgp.85.2.291. [DOI] [PMC free article] [PubMed] [Google Scholar]
- Finch EA, Turner TJ, Goldin SM. Calcium as a coagonist of inositol 1,4,5-trisphosphate-induced calcium release. Science. 1991;252:443–446. doi: 10.1126/science.2017683. [DOI] [PubMed] [Google Scholar]
- Gardiner DM, Grey RD. Membrane junctions in Xenopuseggs: their distribution suggests a role in calcium regulation. J Cell Biol. 1983;96:1159–1165. doi: 10.1083/jcb.96.4.1159. [DOI] [PMC free article] [PubMed] [Google Scholar]
- Gomez-Hernandez J-M, Stühmer W, Parekh AB. Calcium dependence and distribution of calcium-activated chloride channels in Xenopusoocytes. J Physiol (Camb) 1997;502:569–574. doi: 10.1111/j.1469-7793.1997.569bj.x. [DOI] [PMC free article] [PubMed] [Google Scholar]
- Irvine RF. ‘Quantal' Ca2+ release and the control of Ca2+entry by inositol phosphates—a possible mechanism. FEBS Lett. 1990;263:5–9. doi: 10.1016/0014-5793(90)80692-c. [DOI] [PubMed] [Google Scholar]
- Jaconi M, Pyle J, Bortolon R, Ou J, Clapham D. Calcium release and influx colocalize to the endoplasmic reticulum. Curr Biol. 1997;7:599–602. doi: 10.1016/s0960-9822(06)00259-4. [DOI] [PubMed] [Google Scholar]
- Kasai Y, Yamazawa T, Sakurai T, Taketani Y, Ito M. Endothelium-dependent frequency modulation of Ca2+signalling in individual vascular smooth muscle cells of the rat. J Physiol (Camb) 1997;504:349–357. doi: 10.1111/j.1469-7793.1997.349be.x. [DOI] [PMC free article] [PubMed] [Google Scholar]
- Keizer J, Smith GD, Ponce-Dawson S, Pearson JE. Saltatory propagation of Ca2+ waves by Ca2+sparks. Biophys J. 1998;75:595–600. doi: 10.1016/S0006-3495(98)77550-2. [DOI] [PMC free article] [PubMed] [Google Scholar]
- Kume S, Muto A, Aruga J, Nakagawa T, Michikawa T, Furuichi T, Nakade S, Okano H, Mikoshiba K. The Xenopus IP3receptor: structure, function, and localization in oocytes and eggs. Cell. 1993;73:555–570. doi: 10.1016/0092-8674(93)90142-d. [DOI] [PubMed] [Google Scholar]
- Kume S, Yamamoto A, Inoue T, Muto A, Okano H, Mikoshiba K. Developmental expression of the inositol 1,4,5-trisphosphate receptor and structural changes in the endoplasmic reticulum during oogenesis and meiotic maturation of Xenopus laevis. . Dev Biol. 1997;182:228–239. doi: 10.1006/dbio.1996.8479. [DOI] [PubMed] [Google Scholar]
- Lechleiter JD, Clapham DE. Molecular mechanisms of intracellular calcium excitability in X. laevisoocytes. Cell. 1992;69:283–294. doi: 10.1016/0092-8674(92)90409-6. [DOI] [PubMed] [Google Scholar]
- Li W-H, Llopis J, Whitney M, Zlokarnik G, Tsien RY. Cell-permeant caged InsP 3 ester shows that Ca2+spike frequency can optimize gene expression. Nature. 1998;392:936–941. doi: 10.1038/31965. [DOI] [PubMed] [Google Scholar]
- Marchant JS, Taylor CW. Cooperative activation of IP3 receptors by sequential binding of IP3 and Ca2+safeguards against spontaneous activity. Curr Biol. 1997;7:510–518. doi: 10.1016/s0960-9822(06)00222-3. [DOI] [PubMed] [Google Scholar]
- Miledi R, Parker I. Chloride current induced by injection of calcium into Xenopusoocytes. J Physiol (Camb) 1984;357:173–183. doi: 10.1113/jphysiol.1984.sp015495. [DOI] [PMC free article] [PubMed] [Google Scholar]
- Neely A, Olese R, Wei X, Birnbaumer L, Stefani E. Ca2+-dependent inactivation of a cloned cardiac Ca2+ channel alpha-1 subunit (alpha-1-c) expressed in Xenopusoocytes. Biophys J. 1994;66:1895–1903. doi: 10.1016/S0006-3495(94)80983-X. [DOI] [PMC free article] [PubMed] [Google Scholar]
- Parker, I. 1992. Use of caged intracellular messengers for studying the inositol trisphosphate pathway. In Neuromethods, Intracellular Messengers. Vol. 20. A.A. Boulton, G.B. Baker, and C.W. Taylor, editors. Humana Press, Totowa, NJ. 369–393.
- Parker I, Callamaras N, Wier WG. A high resolution confocal laser scanning microscope and flash photolysis system for physiological studies. Cell Calc. 1997;21:441–452. doi: 10.1016/s0143-4160(97)90055-5. [DOI] [PubMed] [Google Scholar]
- Parker I, Choi J, Yao Y. Elementary events of InsP 3- induced Ca2+ liberation in Xenopusoocytes: hot spots, puffs and blips. Cell Calc. 1996a;20:105–121. doi: 10.1016/s0143-4160(96)90100-1. [DOI] [PubMed] [Google Scholar]
- Parker I, Ivorra I. Confocal microfluorimetry of Ca2+ signals evoked in Xenopusoocytes by photoreleased inositol trisphosphate. J Physiol (Camb) 1993;461:133–165. doi: 10.1113/jphysiol.1993.sp019506. [DOI] [PMC free article] [PubMed] [Google Scholar]
- Parker I, Yao Y. Regenerative release of calcium from functionally discrete subcellular stores by inositol trisphosphate. Proc R Soc Lond B Biol Sci. 1991;246:269–274. doi: 10.1098/rspb.1991.0154. [DOI] [PubMed] [Google Scholar]
- Parker I, Yao Y. Ca2+ transients associated with openings of inositol-trisphosphate-gated channels in Xenopusoocytes. J Physiol (Camb) 1996;491:663–668. doi: 10.1113/jphysiol.1996.sp021247. [DOI] [PMC free article] [PubMed] [Google Scholar]
- Parker I, Yao Y, Ilyin V. Fast kinetics of calcium liberation induced in Xenopusoocytes by photoreleased inositol trisphosphate. Biophys J. 1996b;70:222–237. doi: 10.1016/S0006-3495(96)79565-6. [DOI] [PMC free article] [PubMed] [Google Scholar]
- Parker I, Zang W-J, Wier WG. Ca2+ sparks involving multiple Ca2+release sites along Z-lines in rat heart cells. J Physiol (Camb) 1996c;497:31–38. doi: 10.1113/jphysiol.1996.sp021747. [DOI] [PMC free article] [PubMed] [Google Scholar]
- Parys JB, Sernett SW, DeLisle S, Snyder PM, Welsh MJ, Campbell KP. Isolation, characterization and localization of the inositol 1,4,5-trisphosphate receptor protein in Xenopus laevisoocytes. J Biol Chem. 1992;267:18776–18782. [PubMed] [Google Scholar]
- Petersen CC, Berridge MJ. Capacitative calcium entry is colocalised with calcium release in Xenopusoocytes: evidence against a highly diffusible calcium influx factor. Pflügers Arch. 1996;432:286–292. doi: 10.1007/s004240050135. [DOI] [PubMed] [Google Scholar]
- Putney JWT. Capacitative calcium entry revisited. Cell Calc. 1993;11:611–624. doi: 10.1016/0143-4160(90)90016-n. [DOI] [PubMed] [Google Scholar]
- Randriamampita C, Tsien RY. Emptying of intracellular Ca2+ stores releases a novel small messenger that stimulates Ca2+influx. Nature. 1993;354:809–814. doi: 10.1038/364809a0. [DOI] [PubMed] [Google Scholar]
- Shacklock PS, Wier WG, Balke CW. Local Ca2+ transients (Ca2+sparks) originate at transverse tubules in rat heart cells. J Physiol (Camb) 1995;487:601–608. doi: 10.1113/jphysiol.1995.sp020903. [DOI] [PMC free article] [PubMed] [Google Scholar]
- Sun XP, Callamaras N, Marchant JS, Parker I. A continuum of InsP 3-mediated elementary Ca2+ signalling events in Xenopusoocytes. J Physiol (Camb) 1998;509:67–90. doi: 10.1111/j.1469-7793.1998.067bo.x. [DOI] [PMC free article] [PubMed] [Google Scholar]
- Takamatsu T, Wier WG. Calcium waves in mammalian heart: quantification of origin, magnitude, waveform and velocity. Fed Proc. 1990;4:1519–1525. doi: 10.1096/fasebj.4.5.2307330. [DOI] [PubMed] [Google Scholar]
- Terasaki M, Jaffe L. Imaging endoplasmic reticulum in living sea urchin eggs. Methods Cell Biol. 1993;38:211–220. doi: 10.1016/s0091-679x(08)61004-3. [DOI] [PubMed] [Google Scholar]
- Yao Y, Choi J, Parker I. Quantal puffs of intracellular Ca2+ evoked by inositol trisphosphate in Xenopusoocytes. J Physiol (Camb) 1995;482:533–553. doi: 10.1113/jphysiol.1995.sp020538. [DOI] [PMC free article] [PubMed] [Google Scholar]
- Zang W-J, Parker I, Balke CW, Wier WG. Ca2+ sparks triggered by L-type Ca2+currents can involve multiple sites. Biophys J. 1997;72:A342. [Google Scholar]