

Abstract
Site-3 toxins isolated from several species of scorpion and sea anemone bind to voltage-gated Na channels and prolong the time course of INa by interfering with inactivation with little or no effect on activation, effects that have similarities to those produced by genetic diseases in skeletal muscle (myotonias and periodic paralysis) and heart (long QT syndrome). Some published reports have also reported the presence of a noninactivating persistent current in site-3 toxin-treated cells. We have used the high affinity site-3 toxin Anthopleurin B to study the kinetics of this current and to evaluate kinetic differences between cardiac (in RT4-B8 cells) and neuronal (in N1E-115 cells) Na channels. By reverse transcription–PCR from N1E-115 cell RNA multiple Na channel transcripts were detected; most often isolated were sequences homologous to rBrII, although at low frequency sequences homologous to rPN1 and rBrIII were also detected. Toxin treatment induced a voltage-dependent plateau current in both isoforms for which the relative amplitude (plateau current/peak current) approached a constant value with depolarization, although the magnitude was much greater for neuronal (17%) than cardiac (5%) INa. Cell-attached patch recordings revealed distinct quantitative differences in open times and burst durations between isoforms, but for both isoforms the plateau current comprised discrete bursts separated by quiescent periods, consistent with toxin induction of an increase in the rate of recovery from inactivation rather than a modal failure of inactivation. In accord with this hypothesis, toxin increased the rate of whole-cell recovery at all tested voltages. Moreover, experimental data support a model whereby recovery at negative voltages is augmented through closed states rather than through the open state. We conclude that site-3 toxins produce qualitatively similar effects in cardiac and neuronal channels and discuss implications for channel kinetics.
Keywords: patch clamp, voltage clamp, sea anemone toxin, cnidarian venoms
introduction
Insights into the molecular basis of Na channel inactivation have been achieved through a combination of targeted structure/function studies (Fozzard and Hanck, 1996) and investigation of natural mutagenesis in a variety of genetic diseases that target Na channel inactivation in skeletal muscle (e.g., myotonias and periodic paralysis; Cannon, 1996) and the heart (long QT syndrome; Ackerman, 1998). Another important tool for increasing our understanding of inactivation in Na channels is the family of site-3 toxins (Catterall, 1980), which comprise a structurally diverse group of peptide toxins isolated from several species of scorpion (Catterall, 1977; Wang and Strichartz, 1983) and sea anemone (Narahashi et al., 1969; Bergman et al., 1976; Romey et al., 1976). These toxins bind to the extracellular face of voltage-gated Na channels and prolong the time course of sodium current (INa) by interfering with channel inactivation (Narahashi et al., 1969; Bergman et al., 1976; Romey et al., 1976). Single-channel studies (Schreibmayer et al., 1987; Nagy, 1988; Kirsch et al., 1989; El-Sherif et al., 1992) and whole-cell studies (Hanck and Sheets, 1995) suggest that the prolongation of current arises from a selective inhibition of channel inactivation from the open state, O → I, with little effect on the activation process or on inactivation from closed states (C → I), and a gating current study in cardiac channels demonstrated that toxin binding eliminates the charge movement associated with O ↔ I transitions (Sheets and Hanck, 1995).
It is unlikely that the binding of toxin alters only a single rate constant if this rate constant were located in a kinetic loop, since such a modification would violate microscopic reversibility. In addition, ionic current studies have reported that toxin induces a low-amplitude noninactivating current (Bergman et al., 1976; Siemen and Vogel, 1983; Gonoi et al., 1984; Wasserstrom et al., 1993), as reflected by the failure of steady state availability relations to reach zero, even at positive potentials. More interestingly, several studies using scorpion toxins have noted a noninactivating current component that increased in magnitude with increasing depolarization (Koppenhofer and Schmidt, 1968; Mozhayeva et al., 1980; Wang and Strichartz, 1985). That is, steady state availability reached a nadir at an intermediate voltage and increased with further depolarization. Conversely, other investigations have reported steady state availability relations that suggest that voltage-dependent inactivation is complete (Hanck and Sheets, 1995).
The lack of agreement between studies about the presence and the magnitude of a plateau current could be due to the differences among channel isoforms studied. Neuronal Na channel isoforms have an O → I inactivation rate constant that is largely voltage independent (Aldrich et al., 1983; Vandenberg and Bezanilla, 1991). On the other hand, open-state inactivation in cardiac channels is voltage dependent (Berman et al., 1989; Yue et al., 1989; Scanley et al., 1990) and is accompanied by a gating charge movement that is immobilized by site-3 toxins (Sheets and Hanck, 1995). Differences in the observed effects of toxins may, therefore, be secondary to kinetic differences in the channels they modify. Alternately, the observed biphasic availability relations might be peculiar to scorpion toxins. Finally, differences might reflect specific discrepancies in the voltage protocols and analysis methods used.
In these experiments, we studied the kinetic mechanisms underlying this plateau current. In particular, we tested whether the noninactivating current arose from a change in single-channel conductance, a persistent rate of recovery from inactivation, or a toxin-induced modal shift in channel gating. To address the issue of channel isoform specificity, we recorded from neuronal channels expressed in the neuroblastoma cell line N1E-115 and from cardiac channels expressed in the cell line RT4-B8 (Zeng et al., 1996).
methods
Cells and Cell Culture
Cells were grown in Dulbecco's Modified Eagle's Medium (GIBCO BRL) supplemented with 9% fetal bovine serum and were maintained at 37°C in a humid atmosphere containing 5% CO2. Before recording, cells were dissociated from their substrate by brief (<2 min) digestion in a solution containing 0.25% trypsin with 1 mM EDTA. Cardiac INa was recorded from the rat peripheral neurotumor cell line RT4-B8, which has been shown to express the cardiac isoform exclusively (Donahue et al., 1991; Zeng et al., 1996). Neuronal INa was recorded from the murine neuroblastoma cell line N1E-115. We used reverse transcription (RT)–PCR analysis to determine the channel isoforms present in this cell line.
RT-PCR and Sequence Analysis
Total RNA was isolated from N1E-115 cells using the RNeasy Total RNA System (QIAGEN Inc.). RNA was then treated with pancreatic DNase I (Stratagene Inc.) to remove any contaminating genomic DNA. cDNA was generated by reverse transcription using MuLV Reverse Transcriptase (Perkin-Elmer Corp.) as previously described (Zeng et al., 1996). PCR amplification was carried out using 1.75 U Expand High Fidelity polymerase enzyme mix (Hoffman-La Roche) with a reaction mixture containing 10 mM Tris-HCl, pH 8.3, 50 mM KCl, 2.25 mM MgCl2, 2% (vol/vol) DMSO, 0.1% Tween-20, and 1 μM primers as in Dib-Hajj et al. (1996). Five primer sets were selected that would detect various Na channel α subunits (Table I). Primer sets 1 and 2, which span a portion of domain IV, S5-S6, are identical to ones used by Dib-Hajj et al. (1996). Primer set 1 recognizes isoforms (with Genbank accession numbers) rBrI (X03638), rBrII (X03639), rBrIII (Y00766), mNa6 (U26707), rPN1 (U79568), mSNS (Y09108), and rSkm1 (M26643). Primer set 2 recognizes mNav2.3 (L36179), hNav2.1 (M91556), and SCL11 (Y09164). Primer set 3 recognizes sequences upstream of domain I and extends to the middle of domain I S5 in all rat brain isoforms plus mNa6. A primer set specific to glyceraldehyde-3-phosphate dehydrogenase (GAPDH)1 was included as a positive control in each PCR reaction. Although these primers were originally designed based on rat GAPDH (Genbank X02231), mouse sequence and primers would be identical except for the 5′ base of the reverse primer. For each primer set, a reaction that contained all of the reaction components except cDNA (primer only) was also run as a negative control. Using an ABI automatic sequencer, purified PCR-generated fragments were sequenced directly or were first subcloned into the pCRII vector (Invitrogen Corp.).
Table I.
RT-PCR Primer Sets Used to Identify Na Channel Isoforms Present in N1E-115 Cells
| Set | Isoforms | Sequence | Location* | Size‡ | ||||
|---|---|---|---|---|---|---|---|---|
| rBrI, rBrII, | ||||||||
| rBrIII, mNa6, | F 5′ CTGCTCTTCCTGGTCATGTTCATC | 5206 (rBrII) | ||||||
| 1 | 298 | |||||||
| rPN1, mSNS, | R 5′ GGAAGGATATGATGATGTAGCTGACAAA | 5503 (rBrII) | ||||||
| rSkm 1 | ||||||||
| mNav2.3, | F 5′ CTGCTCTTCCTGGTCATGTTCATC | 4407 (mNav2.3) | ||||||
| 2 | hNav2.1, | 300 | ||||||
| R 5′ CAACCATGATATGAGGATGTAACTGACA | 4706 (mNav2.3) | |||||||
| SCL11, | ||||||||
| F 5′ AC (T,C) TC (T,C) GCCCTGTA (C,T) ATT TTAACTCC | 526 (rBrII) | |||||||
| rBrI, rBrII, | ||||||||
| 3 | 460 | |||||||
| rBrIII, mNa6 | ||||||||
| R 5′ GACAGAACACGGTGAGGATCATGACG | 985 (rBrII) | |||||||
| F 5′ GACCCCTTCATTGACCTCAACTAC | 168 (GAPDH) | |||||||
| 4 | GAPDH | 408 | ||||||
| R 5′ GATGCCAAAGTTGTCATGGATGAC | 575 (GAPDH) |
The location of each primer's 5′ end is given with reference to the noted isoform's numbering as it appears in Genbank.
Size of expected product, given in base pairs.
Electrophysiology
For whole-cell recordings, the bath solution contained (mM) 140 Na+, 2 Ca2+, 144 Cl−, 10 HEPES. To verify accuracy of the measurement of plateau currents, in a few whole-cell experiments 130 Mes− was substituted for 130 Cl− to eliminate an endogenous Cl− current that had been observed in a few N1E-115 cells; no differences in Na channel kinetics were observed with this substitution. The pipette solution contained (mM) 140 Cs+, 10 Na+, 100 F−, 50 Cl−, 10 HEPES, set to pH 7.3 with CsOH. Pipette resistances were typically 0.8–1.2 MΩ. After high-resistance seals were achieved, cells were lifted from the bottom of the bath and transferred to a chamber containing bath solution supplemented (when applicable) with saturating concentrations of Anthopleurin B toxin (ApB) and 5 mg/ml bovine serum albumin (to prevent toxin adherence to tubing). Typically, 100 nM toxin was used with cardiac channels (K d = 0.9 nM; Khera et al., 1995), and 300–600 nM toxin was used with neuronal channels (K d = 5.1 nM; Khera et al., 1995) ApB was a kind gift of K. Blumenthal (University of Cincinnati, Cincinnati, OH). Toxin modification was monitored by the appearance of prolonged INa in response to depolarization, and experiments proceeded when modification was complete. To ensure full channel availability, holding potential was set to −150 (cardiac) or −130 (neuronal) mV.
For single-channel cell-attached recordings, the bath solution contained (mM) 140 K+, 2 Ca2+, 144 Cl−, 10 HEPES, which depolarized the membrane potential to ∼0 mV so that pipette potentials did not require correction. The pipette solution contained (mM) 280 Na+, 2 Ca2+, 284 Cl−, 10 HEPES (some early experiments used 140 Na+ and 144 Cl−), set to pH 7.3 with CsOH. Pipette resistances were typically 2–10 MΩ, with the lower resistances used for patches exposed to toxin to increase the number of channels/patch. Pipettes were heat polished, and tips were painted with Sylgard 182 (Dow Corning Corp.) or sticky wax (Kerr). We found it difficult to obtain high-resistance seals in the presence of high toxin concentrations. Therefore, in experiments requiring toxin, the tip of the pipette was filled with toxin-free solution by capillation, and the remainder of the pipette was back-filled with pipette solution supplemented with 1 μM ApB. Toxin modification was monitored by the appearance of late channel reopenings and typically occurred within 2–10 min of establishing a membrane seal.
Voltage protocols were generated using pClamp 6.0.3 (Axon Instruments) and imposed by an Axopatch 200B (Axon Instruments) amplified through a Labmaster TL-1 digital-to-analog convertor. Current waveforms were filtered at 10 (whole cell) or 2 (single channel) kHz, digitized at 50 (whole cell), 25 (single channel, control), or 10 (single channel, toxin) kHz with 12-bit resolution, and stored on an MS-DOS–based computer (Gateway 2000). Temperature was controlled with a TS-4 controller (Sensortek). To resolve single-channel events, the rapid phase of INa recovery, and tail current time course with high accuracy, we carried out all experiments at 6°C. Grouped data are reported as means ± SEM.
Analysis
Whole-cell and single-channel data were analyzed using locally written software in Matlab 5.1 (The MathWorks). For whole-cell data, traces were ohmically leak corrected based on the current at the holding potential, capacity corrected on the basis of 100 summed subthreshold pulses (20 mV each), and digitally refiltered at 5 kHz using a zero-phase filtering algorithm. Single-channel traces were capacity corrected based on the average of null sweeps and baseline-corrected by eye. Traces were idealized using a half-amplitude criterion and checked for accuracy by eye. For toxin-modified patches, late reopenings were defined as openings commencing later than 100 ms after depolarization onset and occurring subsequent to a period of at least 15 ms at the null current amplitude. As in previous single channel studies with site-3 toxins, occasional subconductance events were noted (Nagy, 1987; El-Sherif et al., 1992), and sweeps displaying such activity were excluded from kinetic analyses.
results
Na Channel Expression in N1E-115 Cells
The cell line N1E-115 has been a traditional preparation for the evaluation of mammalian neuronal INa (e.g., Aldrich et al., 1983; Goldman, 1995), and has also been studied with respect to site-3 toxins (Khera et al., 1995). To characterize the channel isoforms present in this cell line, we performed RT-PCR experiments using primer sets complementary to a variety of known Na channel α subunits. Primer sets 1 and 3 and the positive GAPDH control (Table I) produced the expected size PCR products (data not shown). No PCR products were detected using the primer set specific for the mNav2.3, hNav2.1, or SCL11 sodium channel isoforms (primer set 2). Except for mNa6, mSNS, and mNav2.3, full cDNA sequences for most mouse channel isoforms were not available. For these, we performed sequence alignments against the rat Na channel α subunits. From 11 subcloned fragments from primer sets 1 and 3, six sequences were most homologous to rBrII (>90%), two to rPN1 (>93%), and one to rBrIII (90%). The remaining two subcloned fragments were <68% homologous to any of the reference sequences but were most similar to rBrI. Excepting rBrI, sequences homologous to the above listed isoforms were also detected from the direct sequencing of the PCR-generated fragments. N1E-115 cells therefore represent an appropriate vehicle for the study of mammalian neuronal INa.
Isoform Dependence of Plateau Current
Consistent with previous results (e.g., Catterall, 1980; Strichartz et al., 1987), cardiac and neuronal INa displayed dramatically prolonged decay in the presence of saturating toxin concentrations. At the conclusion of this decay, however, a significant plateau current persisted throughout the 2-s test pulses (Fig. 1, A and B). This current was dependent on voltage and differed in magnitude with isoform, ranging from 5 ± 1% of the peak amplitude in cardiac channels to 17 ± 3% of the peak amplitude in neuronal channels (Fig. 1, C and D). Despite the differences in magnitude, the voltage dependencies of the plateau currents as evaluated in conductance transforms were similar to that for peak currents (Fig. 1, E and F).
Figure 1.

Site-3 toxins induce a persistent Na+ current. Cells were modified to completion with saturating doses of ApB. (A) Cardiac INa in response to depolarization to −10 mV; traces show INa before (top) and after (bottom) toxin modification. Inset shows expanded time scale. Arrow denotes the time at which plateau currents were measured for use in conductance calculations (cell 97n10044, Rm = 0.6 GΩ). (B) Neuronal INa in response to depolarization to +20 mV, as above (cell 98209008, Rm = 0.8 GΩ). Currents were leak- and capacity-corrected as described in methods. (C) Peak (•) and steady state (▵) current–voltage relations for cardiac channels, normalized by the peak current at −10 mV (n = 4). (D) Peak (•) and steady state (▵) current–voltage relations for neuronal channels, normalized by the peak current at +20 mV (n = 7). (E) Conductance–voltage relations of cardiac INa. Reversal potentials were constrained to those predicted by pipette and bath solutions. Fits to peak and steady state current– voltage relations with the product of the Boltzmann equation and Ohm's law yielded the following values. Peak half-point, −35 ± 3 mV; peak slope, −7.3 ± 1.1 mV; plateau half-point, −36 ± 2 mV; plateau slope, −7.4 ± 0.7 mV. For illustrative purposes, normalized current–voltage data were conductance-transformed by Ohm's law and normalized by the maximal conductance of peak current. Inset shows the plateau current independently normalized to 1.0. (F) Conductance–voltage relations of neuronal INa, as above. Peak half-point, −14 ± 2 mV; peak slope, −8.3 ± 0.2 mV; plateau half-point, −13 ± 2 mV; plateau slope, −6.4 ± 0.5 mV.
Steady state voltage-dependent availability was assessed using a uniform protocol with 2-s conditioning times for both cardiac and neuronal INa. This time was chosen because it is standard for the cardiac isoform, and although much longer than is typical in the literature for conditioning neuronal channels, gives similar results to shorter conditioning times (Fozzard and Hanck, 1996). Availability protocols in the presence of toxin yielded currents with complex waveforms. In neuronal channels (Fig. 2), test pulses to +20 mV after negative conditioning steps produced currents with time courses appropriate to activation of toxin-modified channels from closed states (time to peak, 2.8 ± 0.1 ms). After conditioning at intermediate voltages, depolarization to the test potential produced a current that started at zero magnitude and developed monotonically with a time course much slower than that typical of channel activation, reaching a plateau (reflecting the steady state current at Vt = +20 mV) by ∼40 ms. After conditioning at positive potentials, current was present immediately upon shifting to the test potential, as expected from the presence of the plateau current during the conditioning pulse and the ohmic change in driving force. These data were similar to those found with scorpion toxin in toad axons (Wang and Strichartz, 1985).
Figure 2.

Steady state availability protocol for neuronal Na channels. (A) Sample currents are shown during a test pulse to +20 mV after a 2-s conditioning pulse to (A) +30 mV, (B) −20 mV, and (C) −140 mV. Inset shows the beginning of the current on an expanded time scale. Vertical lines denote the time points used in calculating average availability relations. (B) Relative availability is shown for currents recorded shortly after test pulse onset (▪) and at the time to peak of currents after negative conditioning pulses (▵). The difference between these currents (•) is also shown. All currents were normalized by the peak current magnitude at negative potentials. Inset shows voltage protocol. Cardiac channels behaved similarly, but with a much smaller plateau current (see Fig. 3) (n = 3).
Depending on the window used for searching for peak currents and the conditioning potential employed, the steady state availability relationship would contain varying contributions from all three of these components: activation, slowly developing plateau current, and already-present plateau current. To calculate the contribution of that fraction of channels open at the end of the conditioning pulse (Fig. 2), we measured current at an isochrone immediately after the onset of the test pulse. This relationship was sigmoidal with a half-point and voltage dependence that matched the conductance relationship of the plateau currents measured in long depolarizations. Currents measured at an isochrone corresponding to the time to peak of INa for activation from a fully available conditioning potential comprised both the instantaneous plateau current measured at the earlier time and the activation of channels that remained closed and available, although this time point was still early enough to minimize the contribution of inactivated channels slowly “recovering” at the test potential of +20 mV. The difference between these two curves, therefore, reflects the “traditional” availability relationship arising from the inactivation of channels during the conditioning pulse. This relationship and the absence of current immediately after the step to +20 mV from intermediate voltages indicate that channels equilibrate completely into inactivated states at intermediate depolarizations (e.g., −30 mV in Fig. 2 B), but that the inactivated states are incompletely absorbing at more positive voltages.
Cardiac INa displayed an essentially similar, biphasic steady state availability, but the smaller amplitude of the plateau current in this isoform made this behavior more difficult to appreciate. Isochronal steady state availability relations at the time to peak of activation of fully available channels are compared with peak availability relations of control channels for both isoforms in Fig. 3.
Figure 3.
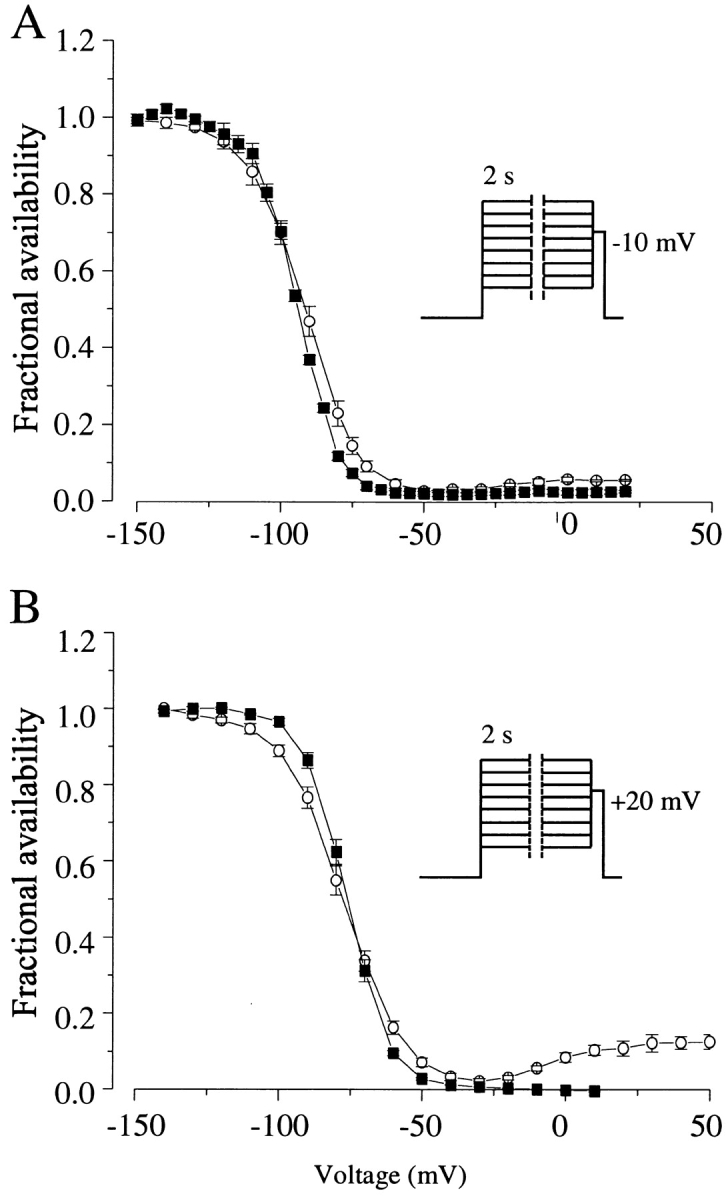
Steady state availability relations of cardiac (A) and neuronal (B) channels in the absence (▪) and presence (○) of ApB. Toxin-modified current was recorded at a uniform time point corresponding to the time to peak current in test pulses after the most negative conditioning steps; peak currents were recorded in control cells. (Inset) Voltage protocol. 2-s conditioning pulses to the indicated voltages were followed by test pulses to −10 mV (cardiac control, n = 11; cardiac toxin, n = 3; neuronal control, n = 5; neuronal toxin, n = 3).
Kinetic Basis of Plateau Current
In principle, the plateau current could occur in several ways. First, the toxin might modify the channels' gating kinetics such that the inactivated state at positive potential was not completely absorbing, as suggested in a study in toad myelinated nerve (Wang and Strichartz, 1985). Second, the toxin might induce a (voltage-dependent) fraction of the channels to fail to inactivate completely, yielding a persistent current. Such a modal failure of inactivation has been observed at low frequency in several mammalian Na channel isoforms (e.g., Patlak and Ortiz, 1985; Alzheimer et al., 1993) and has been proposed as the mechanism of disease in some human myotonias (see Cannon, 1996). It has also been suggested for the mode of action of toxin II from Anemonia sulcata in skeletal muscle (Cannon and Corey, 1993). In short, persistent recovery might occur in all the channels some of the time, or in some of the channels all of the time. Finally, toxin binding might affect the single-channel conductance of modified channels.
Previous single channel studies with site-3 toxins in a variety of preparations have not reported changes in single channel conductance (Schreibmayer et al., 1987; Kirsch et al., 1989; El-Sherif et al., 1992; Nagy, 1987), but these studies measured currents early after depolarizations. To definitely exclude conductance changes from playing a role in plateau current, single Na channel events were recorded in the cell-attached patch configuration in control and with saturating concentrations of toxin added to the pipette solution for both channel isoforms. The control amplitude was then compared with that of toxin-modified openings at late times after depolarization onset. Because of the small amplitude of the plateau current (5–17%), we typically studied toxin-modified patches with large numbers of channels. We found that modification by toxin left single-channel conductance unaltered. In [Na]out = 280 mM, conductances were as follows: cardiac control, 17.1 ± 0.6 pS (n = 3); cardiac toxin-modified, 17.6 ± 1.7 pS (n = 4); neuronal control, 23.7 ± 2.7 pS (n = 4); neuronal toxin-modified, 21.9 ± 1.2 pS (n = 4). It should be noted that, consistent with other reports (Nagy, 1987; El-Sherif et al., 1992), toxin modification also introduced occasional subconductances, particularly in cardiac channels, which typically occurred at the beginning or end of excursions to the primary conductance (Fig. 4 A, arrow).
Figure 4.

Persistent current arises from late channel reopenings. (A–D) Single-channel currents arising from cardiac (A and B) and neuronal (C and D) channels in the absence (A and C) and presence (B and D) of saturating concentrations of ApB. Contiguous traces are shown in response to depolarizations to −25 mV. Control patches typically contained three or fewer channels; patches in the presence of toxin contained many channels. (Arrow) Brief subconductance. (E–H) n*P o diaries of toxin-modified cardiac (E and G) and neuronal (F and H) channels with voltages as shown. Diaries reflect activity from 500 to 1,000 ms after the onset of depolarization, and were calculated for each sweep as Σ(conductance level * time)/Σ(time). Bars in E and H mark the sweeps depicted in B and D, respectively. (Insets) Histograms of sweeps as a function of n*P o activity. (Curves) Best fits of histogram data with gamma distributions. The fraction of excess plateau current in the high n*P o tails of the histogram is (E) −10%, (F) +8%, and (H) +9%. The data set shown in G lacked sufficient openings to produce an acceptable fit to histogram data.
In the absence of toxin, channels typically inactivated after opening at most a small number of times (Fig. 4, A and C). In channels modified by toxin, however, this behavior was replaced by initial clusters of multiple openings, followed by periodic subsequent reopenings throughout the duration of the recording (Fig. 4, B and D). In accordance with the discrete, stochastic nature of these reopenings, n*P o diaries constructed from recordings of toxin-modified openings over 500–1,000 ms after the onset of depolarizations exhibited moderate activity in a majority of sweeps (Fig. 4, E–H). In contrast, if plateau current was produced through a rare, modal failure of inactivation, n*P o diaries would have contained long trains of openings in only a fraction of sweeps, with accompanying occasional spikes on n*P o diaries. Similar data were obtained in three cardiac patches and three neuronal patches.
We employed two statistical techniques to support the qualitative observation that persistent current did not arise through a rare modal failure of inactivation. First, we employed a runs analysis using the method of Horn et al. (1984). If even one channel were to fail to inactivate in any given sweep, the overall value of n*P o during that sweep would be high. Therefore, we classified sweeps on the basis of aggregate n*P o activity, rating them as either above or below the mean value of n*P o for that patch and voltage. We then evaluated for a nonrandom association of high- or low-activity sweeps using the published statistical criterion (Horn et al., 1984). For the 27 data sets (six patches, four voltages for neuronal patches and five voltages for cardiac patches), only two sets showed any nonrandom activity (P < 0.05; a N1E-115 patch in two of four voltages tested, −5 and −25 mV). The remaining voltages of this patch, as well as the data from the other five patches analyzed in this manner, failed to show any nonrandom intersweep patterns of activity.
Although the runs analysis failed to support the hypothesis that plateau current arose from modal behavior persistent across multiple sweeps, it did not address the possibility that the persistent current arose from occasional complete failures of channels to inactivate for shorter duration; i.e., during single depolarizations. To test for such patterns for each patch and voltage, we constructed histograms that grouped sweeps by their aggregate value of n*P o and fitted these histograms with a gamma distribution (see, e.g., Johnston and Wu, 1995) (Fig. 4, E, F, and H, insets). Fits were possible for data sets with >200 openings so that all neuronal data and two data sets from RT4-B8 patches were analyzed.
Occasional failures of inactivation would be expected to produce very high n*P o values outside the otherwise smooth distribution of activities. To evaluate the extent to which high n*P o sweeps exceeded what would be expected, we identified the tail of the fitted n*P o distribution that accounted for the 10% of the current produced by sweeps with the highest activity. We then compared this with the calculated fraction of actual plateau current produced in this high activity range. Averages for all patches and voltages indicated that 94% of the observed plateau current was explained by periodic, discrete reopenings at late time periods. (Only 6 ± 3% of the plateau current comprised anomalously high n*Po activity.) This analysis and the runs analysis above effectively exclude occasional complete failures of inactivation as a significant contributor to the observed plateau current.
We next compared the mean open times of the late reopenings to those of control channels. Mean open times of late reopenings were similar to control open times at mild depolarizations close to the activation threshold, and they progressively increased with increasing voltage (Fig. 5). This behavior was similar to that previously recorded from initial, early toxin-modified openings (Kirsch et al., 1989; El-Sherif et al., 1992), suggesting that the durations of both early and late events are influenced by the toxin's inhibition of inactivation. Even though patches contained multiple channels, overlapping events at late times were infrequent, as would be expected because of the low probability of channel reopenings. Particularly in cardiac channels, late re-openings typically comprised of bursts of several openings with brief closures that were sometimes poorly resolved. To address this possible confounding factor, we constructed histograms measuring the total open time of bursts (defined as openings separated by closures ≤3 ms). The mean duration of these bursts also increased with progressive depolarization (Fig. 5), implying that the observed voltage dependence of mean open times was not an artifact of missed closures.
Figure 5.
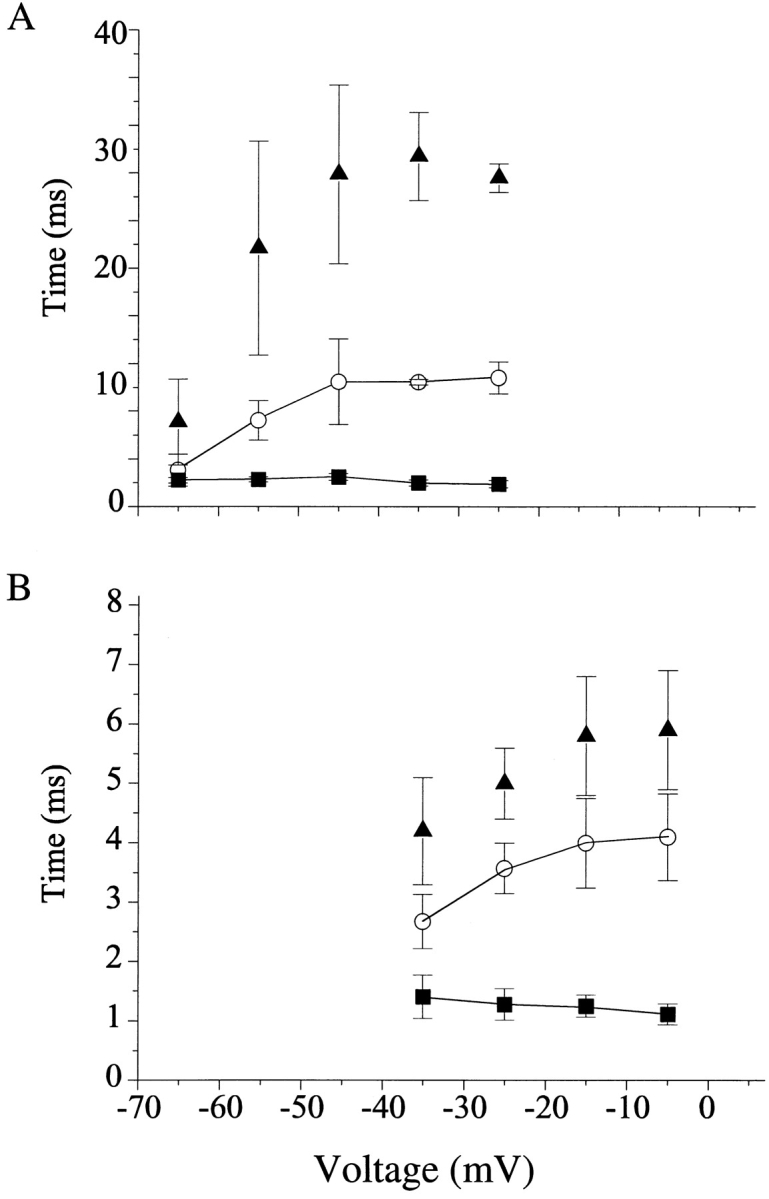
Mean open times of single channel openings recorded from cardiac (A) and neuronal (B) channels. Open-time histograms were calculated from idealized traces of control patches (▪), and patches modified by ApB (○), and were fit with single exponentials. In toxin patches, only events arising from late reopenings were included. Burst times (▴) of toxin-modified patches were taken from single exponential fits to burst-time histograms as described in the text. Cardiac/toxin, n = 4; cardiac/control, n = 5; neuronal/toxin, n = 4; neuronal/control, n = 4. Two patches from neuronal channels (one in control, one with toxin) displayed greatly prolonged mean open times and were not included in this analysis.
Augmentation of Recovery
The presence of late reopenings separated by long nonconducting periods suggested a model in which the channels' inactivated state(s) were destabilized; i.e., an increase in the rate of recovery from inactivation. We tested this conjecture by measuring whole-cell recovery rates. In both cardiac (Fig. 6) and neuronal (Fig. 7) channel isoforms, modification with ApB significantly enhanced recovery in both isoforms over a range of potentials. This effect was significant at all potentials, as measured by the decrease in the dominant time constant of recovery (Fig. 8, A and C).
Figure 6.

Toxin enhances recovery from inactivation of cardiac channels. After inactivation to steady state at 0 mV for 1,500 ms, cells expressing cardiac channels with (○) or without (▪) exposure to ApB were allowed to recover for the indicated times at (A) −145 and (B) −100 mV. Raw traces show current during test pulses after recovery times of 1, 4, 16, 64, 256, and 1,024 ms in the presence (○) and absence (▪) of toxin. (Insets) Onset of recovery on an expanded scale. (Arrow) Presence of a delay before recovery onset at positive voltages in the presence of toxin. (A) n = 7, toxin; n = 5, control. (B) n = 5, toxin; n = 3, control.
Figure 7.

Toxin enhances recovery from inactivation of neuronal channels at (A) −130 and (B) −85 mV, see Fig. 6 for details. (A) n = 4, toxin; n = 4, control. (B) n = 4, toxin; n = 4, control.
Figure 8.

Toxin enhances recovery from inactivation. Individual recovery diaries (as in Fig. 6) were fit with an initial delay, followed by a double exponential approach. The faster time constant is plotted for cardiac (A) and neuronal (C) channels in the presence (○) and absence (▪) of saturating toxin concentrations. The slower time constant typically comprised ∼25% of the total amplitude in cardiac channels and 35% in neuronal channels, with a slightly higher amplitude in toxin. It usually ranged from 100–400 ms and was somewhat faster in toxin-containing solutions. Although fits with this function yielded reasonable values for the duration of the initial delay, we achieved smaller error by defining the end of the delay empirically as the time at which current during the test pulse had grown to 2% of its asymptotic value at long recovery times. Values obtained using this objective criterion are shown for cardiac (B) and neuronal (D) channels. The grey box denotes delay times ≤1 ms, below which estimates of delay were unre- liable because this was the first time point recorded. No significant delay could be measured at the most negative potential investigated in each isoform (−145 mV for cardiac and −130 mV for neuronal).
One possible mechanism for this toxin-mediated enhancement might be the enhancement of a recovering transition directly back to the open state (that is, the I → O transition). Na channels do not normally recover via this path (Kuo and Bean, 1994). However, the demonstrated ability of these toxins to inhibit the O → I transition gives this prospect a pleasing symmetry. During recovery, inactivated Na channels must normally move through several inactivated states before reaching a state with an appreciable rate of return into the activation pathway (Scheme I; Chiu, 1977; Kuo and Bean, 1994). Thus, recovery proceeds after an initial delay, reflecting the time required for the channel's transit through one or more inactivated states. This delay was easily detectable for both channel isoforms in control at the experimental temperature of 6°C (Figs. 6 and 7, insets). Previous data noted an absence of this delay in toad myelinated nerve after channel modification (Wang and Strichartz, 1985). Also, because of the existence of a toxin-induced plateau current that persisted until the end of the inactivating prepulses, we expected some INa even at very short recovery times. Therefore, we were surprised to find that a delay persisted in toxin before any channels, in addition to those already comprising the plateau current, recovered into the activation pathway. This delay was shorter than that found in control channels and became undetectable only at the most negative recovery voltages tested. This lag is graphically evident in Figs. 6 B and 7 B (arrows) and is quantified in Fig. 8, B and D.
The continued presence of a delay even when a fraction of channels was open at the onset of the recovery interval strongly argues against significant recovery of channels through the open state at negative potentials. To further verify that toxin did not augment recovery directly into the open state, we recorded current during the recovery process. That is, cells expressing cardiac or neuronal channels were depolarized until inactivation reached steady state and were allowed to recover while current was recorded at high resolution. The protocol is depicted in Fig. 9 A. In cells expressing neuronal channels (Fig. 9 B), a current was present at the onset of the recovery interval and it rapidly decayed. We interpret this current as arising from channels open at the end of the conditioning prepulse conducting current according to the increased driving force at the recovery potential. The time constant of this current decay (290 μs at −100 mV in Fig. 9 B) was much faster than the time constant of recovery from inactivation (13.6 ms at −100 mV, from Fig. 8 C) and was similar to the time constant of deactivation of unmodified INa tail currents at −100 mV for the same cell shown in Fig. 9 B (240 μs, data not shown). The behavior of cardiac channels was qualitatively similar (Fig. 9 C), but the smaller magnitude of the plateau current in this isoform made the detection of current during recovery more difficult. In neither isoform was a discrete current arising from recovering channels detectable (see discussion).
Figure 9.

Recovering channels do not carry appreciable current. (A) Voltage protocol. Channels were inactivated to steady state at 0 mV. Channels were then allowed to recover at the indicated voltages, during which any current through open channels was recorded. A subsequent test pulse to 0 mV confirmed channel recovery. (B) Recovery from inactivation of neuronal channels. A substantial tail current is present during the recovery interval. (Inset) The beginning of the recovery interval on expanded time and current axes (cell 98211038, Rm = 0.6 GΩ). (C) Recovery from inactivation of cardiac channels at the indicated voltages (cell 97d11012, Rm = 0.7 GΩ).
discussion
In this study, we have demonstrated the existence of a noninactivating plateau current in both cardiac and neuronal isoforms of the voltage-gated Na channel when modified by a high affinity site-3 sea anemone toxin (Anthopleurin B). The voltage dependence of the equilibrium distribution between nonconducting and conducting states is biphasic. That is, toxin-modified channels reside entirely in closed states at negative potentials (as do toxin-free channels), partition completely into inactivated states at intermediate voltages, and occupy the open state with an appreciable probability at positive potentials. In this sense, our results accord strongly with those obtained from channels modified with α-scorpion toxins (Koppenhofer and Schmidt, 1968; Mozhayeva et al., 1980; Wang and Strichartz, 1985), where the steady state current relation also showed a nadir at modest depolarizations. At first glance, these results appear to conflict with a number of other reports of toxin-modified channel availability. An early study in the frog node of Ranvier with toxin II from A. sulcata (Bergman et al., 1976) produced an availability curve that reached zero, but the toxin concentrations used were near the K d for the toxin/channels studied, probably leading to an underestimation of the plateau current magnitude. A study of the action of Leiurus toxin on N18 neuroblastoma cells also demonstrated only a small plateau current, but these investigators did not probe the relationship at positive potentials (Gonoi et al., 1984). Likewise, the apparent complete inactivation noted in canine cardiac myocytes (Hanck and Sheets, 1995) undoubtedly arose because of the low amplitude of the plateau current in that channel isoform and the relatively negative voltage range tested. On the other hand, the voltage-independent plateau current noted by Wasserstrom et al. (1993) probably reflects the steady state current at their test potential (−20 mV).
Analysis of single channel recordings revealed that the plateau current arises from discrete, late channel reopenings. These late events have kinetics similar to early toxin-modified events and are separated by longer closed intervals, and so appear to reflect an increase in one or more of the rate constants in the recovery pathway, a hypothesis also supported by the toxin-mediated enhancement of whole-cell recovery from inactivation. Consistent with these observations, two previous single-channel studies reported that toxin treatment induced a second, slow component into the first-latency distribution of channel openings; that is, a subset of sweeps showed activity in which channels first opened at dramatically late times after depolarization onset (Schreibmayer et al., 1987; Kirsch et al., 1989). These papers did not consider the issue of late reopenings; however, in light of these studies, this late component may represent channels that inactivate without opening upon depolarization onset, but later recover back into the activation pathway and open for the first time.
Site-3 toxins do not induce a modal shift in gating, as evidenced by the relative homogeneity of the n*P o diaries and failure of statistical analysis to detect modal activity across or within sweeps. The suggestion of this action by toxin II from A. sulcata in skeletal muscle Na channels (Cannon and Corey, 1993) was probably a result of the low affinity for this toxin for skeletal muscle channels, causing patches to be modified during only a fraction of the sweeps.
These toxins are well known to have lower affinity for inactivated than for resting or open channels (Catterall, 1979; Mozhayeva et al., 1980; Warashina and Fujita, 1983; Strichartz and Wang, 1986). In fact, for some toxin/channel pairs, this can be dramatic and easily observed (Strichartz and Wang, 1986). Consequently, we considered whether dissociation of toxin during prolonged depolarization might occur. However, this process was minimal in these experiments. First, the Na+ current induced by the toxins included a persistent current that did not decay appreciably during a 1.5-s depolarization (see Fig. 1, A and B), a time comparable to that of the longest conditioning pulse used in these studies (2 s). By definition, therefore, toxin did not dissociate significantly during this time interval. Second, if toxin were to dissociate during extended conditioning pulses, upon repolarization it could not rebind to channels at a rate any faster than that dictated by the known toxin/channel association rates, which are slow (Khera et al., 1995). For instance, N1E-115 channels in the presence of 300 nM ApB (a commonly used concentration) would be expected to rebind toxin with a time constant of 3.5 s, but after a depolarization channels were fully modified at the earliest times channels recover (e.g., 0.25 s in Fig. 7). Finally, we directly assayed toxin dissociation by depolarizing toxin-modified neuronal cells to 0 mV in toxin-free solution for 20 and 60 s, and only 5.4 and 11.5% dissociation occurred. It is, therefore, unlikely that the dissociation of toxin from channels during depolarization affects the results.
Although there appear at first glance to be differences in the effect of toxin on INa from cardiac and neuronal channels (compare, for example, Fig. 1, A and B), these differences are most likely to be secondary to quantitative differences in the kinetics of the two isoforms. In both isoforms, toxin binding appears to augment the rate of recovery (compare Fig. 8, A and C), shorten but not eliminate the delay before recovery onset (compare Fig. 8, B and D), and produce a plateau current comprising discrete late reopenings (compare Fig. 4, B and D) with no evidence for modal inactivation failure. The relatively prolonged mean open and burst times found in cardiac channels as compared with neuronal channels (Fig. 5) probably reflect only differing rate constants in the activation pathway. Taken together, modification by toxin in cardiac channels produces a plateau current of smaller magnitude, comprising fewer, longer openings than in neuronal cells, but arising through the same enhancement of recovery from inactivation as found in neuronal channels.
Analysis of recovery in whole-cell experiments demonstrated that toxin speeds recovery at all potentials and shortens the delay in recovery from inactivation. In this regard, our data stand in contrast to those reported in toad myelinated nerve since in that preparation toxin eliminated the delay before the onset of recovery and did not change the time constant of current recovery (Wang and Strichartz, 1985).
How might toxin treatment destabilize the channels' inactivated states and enhance macroscopic recovery? The accepted existence of a delay before the onset of recovery in Na channels (Kuo and Bean, 1994) strongly suggests the presence of multiple inactivated states. In light of this observation, several kinetic modifications might produce the observed enhancement in recovery. First, toxins might augment the rate of recovery into the open state (Scheme II, 1). Second, toxins might enhance one or more of the existing rates of channel recovery to closed, available states (Scheme II, 2). Third, toxins might simply enhance one or more deactivating (i.e., “leftward”) transition rates between the multiple inactivated states, bringing channels more quickly into inactivated states from which recovery rates are high (Scheme II, 3). Finally, the action of toxin might of course comprise a combination of these effects. Site-3 toxins are already known to decrease the rate of Na channel inactivation from the open state, O → I (Schreibmayer et al., 1987; Nagy, 1988; Kirsch et al., 1989; El-Sherif et al., 1992; Hanck and Sheets, 1995; Sheets and Hanck, 1995). Therefore, it is tempting to hypothesize that the plateau current at positive voltages represents an O ↔ I equilibration that partially favors the open state, and we can predict quantitative boundaries on the unidirectional rate constants of O → I and I → O.
The rate of decay of macroscopic Na+ current after toxin modification is remarkably voltage independent. In neuronal channels treated with saturating ApB, single exponential fits to the decaying phase of current transients yielded a time constant of 31.4 ± 0.4 ms, invariant over a range of −25 to +30 mV (n = 5). At the positive end of this voltage range, the majority of channels are likely to be found in either the open state or the distal-most inactivated state. The reciprocal of this time constant can, therefore, be taken as representing the rate of equilibration between these two conformations (k OI + k IO). The O ↔ I equilibrium places 17% (plateau amplitude at ≥+20 mV in Fig. 2) of the channels in the open state [k IO/(k OI + k IO)]. Thus, k OI is calculated to be 26 s−1, and k IO is calculated as 5 s− 1. This rate of I → O transitions is significantly slower than the observed macroscopic rate of recovery from inactivation in toxin-modified N1E-115 cells (see Fig. 8 C). Even in the presence of toxin, therefore, channels at negative voltages more likely recover by traversing multiple inactivated states before returning to one of the closed states. Consistent with this conclusion, a delay in recovery from inactivation continues to be measurable except at the most negative voltages (see Fig. 8, B and D).
The issue of channel recovery through the open state during repolarization can also be addressed by the time course of current present during recovery from inactivation. We can evaluate the contribution of k IO by simulation using an irreversible, simplified Markov model of the recovery process (Fig. 10), using rate constants based on the experimental data from neuronal channels. The closing rate (k OC) was taken from the time constant of tail currents in the absence of toxin (at −100 mV), and the rate of recovery (k IC) was taken from the average rate of recovery at −100 mV in the absence of toxin. The form of the current during recovery depends on the relative magnitude of the rate constant between I and O (k IO) compared with k OC and k IC. If k IO is similar to the rate of deactivation (k OC), a “hooked” current will appear during recovery, reflecting the accumulation of channels in O (e.g., k IO = 1,500). If k IO is slower than k OC but still faster than k IC, then current will decay with an apparent exponential, but the time constant of this exponential will approximate the overall time constant of recovery (e.g., k IO = 500). If k IO is slow, but still sufficiently large to cause appreciable recovery through the open state (e.g., k IO = 77), then current decay will comprise two obvious components: a rapid deactivation and a much slower decay corresponding to recovering channels.
Figure 10.

Model of recovery through the open state. An irreversible, three-state Markov model was constructed with rate constants picked as described in the text. Initial occupancies were [O] = 0.22 and [I] = 0.78. Dotted line represents the single-exponential course of current deactivation with k IO = 0.
The observed behavior (e.g., Fig. 9 B, −100 mV) shows a complete exponential decay of current that is rapid in comparison to the rate of whole-cell recovery, which is similar to that expected when k IO is low (e.g., Fig. 10, 18 s−1) or nonexistent (Fig. 10, dotted line).
In summary, therefore, it appears that the plateau current produced in the presence of toxin arises from an O ↔ I equilibrium that partially favors the open state, but that the overall rate of I → O recovery is still not sufficiently large to cause appreciable numbers of channels to recover through the open state during repolarization. Nonetheless, toxin treatment does augment recovery from inactivation. We suggest that both of these observations can be parsimoniously rationalized under the assumption that the toxin destabilizes the terminal inactivated state of the channel. Open-state inactivation is slowed (Schreibmayer et al., 1987; Nagy, 1988; Kirsch et al., 1989; El-Sherif et al., 1992), producing the well-known prolongation of macroscopic inactivation and increase in mean open time. This slowing, combined with a possible augmentation of the open-state recovery rate I → O, produces the observed plateau current. Finally, destabilization of the final inactivated state augments the leftward I ← I transition, enhancing recovery and shortening the delay before recovery onset.
This hypothesis accounts for all of the observed kinetic features of this toxin through destabilization of a single kinetic state of the channel, raising the possibility that this toxin can be used to define the molecular determinants of a specific kinetic state. Such a molecular identification has not been previously possible, and it would be an important step towards reconciling kinetic models with gross channel conformation.
Scheme I.

Scheme II.

Acknowledgments
We thank Kenneth Blumenthal for providing the recombinant ApB toxin. We thank Jack Kyle and Ruth Martin for their on-going contributions to our research, and Michael Sheets (University of Utah, Salt Lake City, UT) for his critical reading of the manuscript.
This study was supported by National Heart, Lung and Blood Institute grant HL-PO1-20592 (D.A. Hanck) and an American Heart Association Established Investigatorship (D.A. Hanck). G.R. Benzinger is a trainee of the Medical Scientist Training Program (5-T32-GM07281).
Abbreviations used in this paper
- ApB
Anthopleurin B toxin
- GAPDH
glyceraldehyde-3-phosphate dehydrogenase
- RT-PCR
reverse transcription–PCR
Footnotes
Portions of this work were previously published in abstract form (Benzinger, G.R., and D.A. Hanck. 1997. Biophys. J. 72:A362).
references
- Ackerman MJ. The long QT syndrome: ion channel diseases of the heart. Mayo Clin Proc. 1998;73:250–269. doi: 10.4065/73.3.250. [DOI] [PubMed] [Google Scholar]
- Aldrich RW, Corey DP, Stevens CF. A reinterpretation of mammalian sodium channel gating based on single channel recording. Nature. 1983;306:436–441. doi: 10.1038/306436a0. [DOI] [PubMed] [Google Scholar]
- Alzheimer C, Schwindt PC, Crill WE. Modal gating of Na+ channels as a mechanism of persistent Na+current in pyramidal neurons from rat and cat sensorimotor cortex. J Neurosci. 1993;13:660–673. doi: 10.1523/JNEUROSCI.13-02-00660.1993. [DOI] [PMC free article] [PubMed] [Google Scholar]
- Bergman C, Dubois JM, Rojas E, Rathmayer W. Decreased rate of sodium conductance inactivation in the node of Ranvier induced by a polypeptide toxin from sea anemone. Biochim Biophys Acta. 1976;455:173–184. doi: 10.1016/0005-2736(76)90162-0. [DOI] [PubMed] [Google Scholar]
- Berman MF, Camardo JS, Robinson RB, Siegelbaum SA. Single sodium channels from canine ventricular myocytes: voltage dependence and relative rates of activation and inactivation. J Physiol (Lond) 1989;415:503–531. doi: 10.1113/jphysiol.1989.sp017734. [DOI] [PMC free article] [PubMed] [Google Scholar]
- Cannon SC. Ion-channel defects and aberrant excitability in myotonia and periodic paralysis. Trends Neurosci. 1996;19:3–10. doi: 10.1016/0166-2236(96)81859-5. [DOI] [PubMed] [Google Scholar]
- Cannon S, Corey D. Loss of Na+channel inactivation by anemone toxin (ATX II) mimics the myotonic state in hyperkalaemic periodic paralysis. J Physiol (Lond) 1993;466:501–520. [PMC free article] [PubMed] [Google Scholar]
- Catterall WA. Activation of the action potential Na+ionophore by neurotoxins. J Biol Chem. 1977;252:8669–8676. [PubMed] [Google Scholar]
- Catterall W. Binding of scorpion toxin to receptor sites associated with sodium channels in frog muscle. J Gen Physiol. 1979;74:375–391. doi: 10.1085/jgp.74.3.375. [DOI] [PMC free article] [PubMed] [Google Scholar]
- Catterall W. Neurotoxins that act on voltage-sensitive sodium channels in excitable membranes. Annu Rev Pharmacol Toxicol. 1980;20:15–43. doi: 10.1146/annurev.pa.20.040180.000311. [DOI] [PubMed] [Google Scholar]
- Chiu SY. Inactivation of sodium channels: second order kinetics in myelinated nerve. J Physiol (Lond) 1977;273:573–596. doi: 10.1113/jphysiol.1977.sp012111. [DOI] [PMC free article] [PubMed] [Google Scholar]
- Dib-Hajj SD, Hinson AW, Black JA, Waxman SG. Sodium channel mRNA in the B104 neuroblastoma cell line. FEBS Lett. 1996;384:78–82. doi: 10.1016/0014-5793(96)00273-6. [DOI] [PubMed] [Google Scholar]
- Donahue LM, Schaller K, Sueoka N. Segregation of Na-channel gene expression during neuronal-glial branching of a rat PNS-derived stem cell line, RT4-AC. Dev Biol. 1991;147:415–424. doi: 10.1016/0012-1606(91)90299-i. [DOI] [PubMed] [Google Scholar]
- El-Sherif N, Fozzard HA, Hanck DA. Dose-dependent modulation of the cardiac sodium channel by sea anemone toxin ATXII. Circ Res. 1992;70:285–301. doi: 10.1161/01.res.70.2.285. [DOI] [PubMed] [Google Scholar]
- Fozzard HA, Hanck DA. Structure and function of voltage-dependent sodium channels: comparison of brain II and cardiac isoforms. Physiol Rev. 1996;76:887–926. doi: 10.1152/physrev.1996.76.3.887. [DOI] [PubMed] [Google Scholar]
- Goldman L. Sodium channel inactivation from closed states: evidence for an intrinsic voltage dependency. Biophys J. 1995;69:2369–2377. doi: 10.1016/S0006-3495(95)80106-2. [DOI] [PMC free article] [PubMed] [Google Scholar]
- Gonoi T, Hille B, Catterall WA. Voltage clamp analysis of sodium channels in normal and scorpion toxin–resistant neuroblastoma cells. J Neurosci. 1984;4:2836–2842. doi: 10.1523/JNEUROSCI.04-11-02836.1984. [DOI] [PMC free article] [PubMed] [Google Scholar]
- Hanck DA, Sheets MF. Modification of inactivation in cardiac sodium channels: ionic current studies with anthopleurin-A toxin. J Gen Physiol. 1995;106:601–616. doi: 10.1085/jgp.106.4.601. [DOI] [PMC free article] [PubMed] [Google Scholar]
- Horn R, Vandenberg CA, Lange K. Statistical analysis of single sodium channels: effects of n-bromoacetamide. Biophys J. 1984;45:323–335. doi: 10.1016/S0006-3495(84)84158-2. [DOI] [PMC free article] [PubMed] [Google Scholar]
- Johnston, D., and S.M. Wu. 1995. Foundations of Cellular Neurophysiology. MIT Press, Cambridge, MA. p. 298.
- Khera PK, Benzinger GR, Lipkind G, Drum CL, Hanck DA, Blumenthal KM. Multiple cationic residues of Anthopleurin B that determine high affinity and channel isoform discrimination. Biochemistry. 1995;34:8533–8541. doi: 10.1021/bi00027a003. [DOI] [PubMed] [Google Scholar]
- Kirsch GE, Skattebol A, Possani LD, Brown AM. Modification of Na channel gating by an alpha scorpion toxin from Tityus serrulatus. . J Gen Physiol. 1989;93:67–83. doi: 10.1085/jgp.93.1.67. [DOI] [PMC free article] [PubMed] [Google Scholar]
- Koppenhofer E, Schmidt H. Effect of scorpion venom on ionic currents in the node of Ranvier. II. Incomplete sodium inactivation. Pflügers Arch. 1968;303:150–161. doi: 10.1007/BF00592632. [DOI] [PubMed] [Google Scholar]
- Kuo C-C, Bean BP. Na+channels must deactivate to recover from inactivation. Neuron. 1994;12:819–829. doi: 10.1016/0896-6273(94)90335-2. [DOI] [PubMed] [Google Scholar]
- Mozhayeva GN, Naumov AP, Nosyreva ED, Grishin EV. Potential-dependent interaction of toxin from venom of the scorpion Buthus eupeuswith sodium channels in myelinated fibre. Biochim Biophys Acta. 1980;597:587–602. doi: 10.1016/0005-2736(80)90230-8. [DOI] [PubMed] [Google Scholar]
- Nagy K. Subconductance states of single sodium channels modified by chloramine-T and sea anemone toxin in neuroblastoma cells. Eur Biophys J. 1987;15:129–132. doi: 10.1007/BF00263676. [DOI] [PubMed] [Google Scholar]
- Nagy K. Mechanism of inactivation of single sodium channels after modification by chloramine-T, sea anemone toxin and scorpion toxin. J Membr Biol. 1988;106:29–40. doi: 10.1007/BF01871764. [DOI] [PubMed] [Google Scholar]
- Narahashi T, Moore JW, Shapiro BI. Condylactis toxin: interaction with nerve membrane ionic conductances. Science. 1969;163:680–681. doi: 10.1126/science.163.3868.680. [DOI] [PubMed] [Google Scholar]
- Patlak JB, Ortiz M. Slow currents through single sodium channels of the adult rat heart. J Gen Physiol. 1985;86:89–104. doi: 10.1085/jgp.86.1.89. [DOI] [PMC free article] [PubMed] [Google Scholar]
- Romey G, Abita JP, Schweitz H, Wunderer G, Lazdunski M. Sea anemone toxin: a tool to study molecular mechanisms of nerve conduction and excitation–secretion coupling. Proc Natl Acad Sci USA. 1976;73:4055–4059. doi: 10.1073/pnas.73.11.4055. [DOI] [PMC free article] [PubMed] [Google Scholar]
- Scanley BE, Hanck DA, Chay T, Fozzard HA. Kinetic analysis of single sodium channels from canine cardiac Purkinje cells. J Gen Physiol. 1990;95:411–435. doi: 10.1085/jgp.95.3.411. [DOI] [PMC free article] [PubMed] [Google Scholar]
- Schreibmayer W, Kazerani H, Tritthart HA. A mechanistic interpretation of the action of toxin II from Anemonia sulcataon the cardiac sodium channel. Biochim Biophys Acta. 1987;901:273–282. doi: 10.1016/0005-2736(87)90124-6. [DOI] [PubMed] [Google Scholar]
- Sheets MF, Hanck DA. Voltage-dependent open-state inactivation of cardiac sodium channels: gating current studies with Anthopleurin-A toxin. J Gen Physiol. 1995;106:617–640. doi: 10.1085/jgp.106.4.617. [DOI] [PMC free article] [PubMed] [Google Scholar]
- Siemen D, Vogel W. Tetrodotoxin interferes with the reaction of scorpion toxin (Buthus tamulus)at the sodium channel of the excitable membrane. Pflügers Arch. 1983;397:306–311. doi: 10.1007/BF00580266. [DOI] [PubMed] [Google Scholar]
- Strichartz G, Wang GK. Rapid voltage-dependent dissociation of scorpion alpha-toxins coupled to Na channel inactivation in amphibian myelinated nerves. J Gen Physiol. 1986;88:413–435. doi: 10.1085/jgp.88.3.413. [DOI] [PMC free article] [PubMed] [Google Scholar]
- Strichartz G, Rando T, Wang GK. An integrated view of the molecular toxinology of sodium channel gating in excitable cells. Annu Rev Neurosci. 1987;10:237–267. doi: 10.1146/annurev.ne.10.030187.001321. [DOI] [PubMed] [Google Scholar]
- Vandenberg CA, Bezanilla F. A sodium channel gating model based on single channel, macroscopic ionic, and gating currents in the squid giant axon. Biophys J. 1991;60:1511–1533. doi: 10.1016/S0006-3495(91)82186-5. [DOI] [PMC free article] [PubMed] [Google Scholar]
- Wang GK, Strichartz GR. Purification and physiological characterization of neurotoxins from venoms of the scorpions Centruroides sculpturatus and Leiurus quinquestriatus. . Mol Pharmacol. 1983;23:519–533. [PubMed] [Google Scholar]
- Wang GK, Strichartz G. Kinetic analysis of the action of Leiurusalpha-toxin on ionic currents in myelinated nerve. J Gen Physiol. 1985;86:739–762. doi: 10.1085/jgp.86.5.739. [DOI] [PMC free article] [PubMed] [Google Scholar]
- Warashina A, Fujita S. Effects of sea anemone toxins on the sodium inactivation process in crayfish axons. J Gen Physiol. 1983;81:305–323. doi: 10.1085/jgp.81.3.305. [DOI] [PMC free article] [PubMed] [Google Scholar]
- Wasserstrom JA, Kelly JE, Liberty KN. Modification of cardiac Na+channels by Anthopleurin-A: effects on gating and kinetics. Pflügers Arch. 1993;424:15–24. doi: 10.1007/BF00375097. [DOI] [PubMed] [Google Scholar]
- Yue DT, Lawrence JH, Marban E. Two molecular transitions influence cardiac sodium channel gating. Science. 1989;244:349–352. doi: 10.1126/science.2540529. [DOI] [PubMed] [Google Scholar]
- Zeng DW, Kyle JW, Martin RL, Ambler KS, Hanck DA. Cardiac sodium channels expressed in a peripheral neurotumor-derived cell line, RT4-B8. Am J Physiol. 1996;270:C1522–C1531. doi: 10.1152/ajpcell.1996.270.5.C1522. [DOI] [PubMed] [Google Scholar]