Abstract
Alternative activation of macrophages (Mφ) during helminth infection is a characteristic feature of the host immune response. Alternatively activated macrophages (AAMφ) are distinguished from others by high arginase 1 (Arg-1) activity, low nitric oxide (NO), and high interleukin 10 (IL-10) production. In murine models, these cells have been shown to possess anti-inflammatory properties. They have also been implicated in exacerbating a subsequent infection with a secondary pathogen. In this study we used cattle experimentally infected with Fasciola hepatica to monitor the kinetics of IL-4 and IL-10 over the course of infection. Using naïve Mφ in vitro, we examined the effects of exposure to F. hepatica excretory/secretory products (FhepES) alone or in combination with IL-4. Our results suggest that FhepES may work in combination with IL-4 to produce AAMφ. The effects of FhepES on the subsequent responses to lipopolysaccharide (LPS) and purified protein derivative from Mycobacterium bovis (PPD-B), which are bovine Toll-like receptor 4 (TLR4) and TLR2 antagonists, respectively, were also examined. We found that Mφ stimulated with FhepES together with LPS or PPD-B have reduced NO or gamma interferon production, respectively. The ability of FhepES to produce AAMφ was found to be heat labile and partially dependent on glycan residues. A possible role for TLR recognition is discussed.
Alternative activation of macrophages (Mφ) is a common feature of the immune response to helminth parasites, and their presence has been shown in a number of model infections, including those caused by Schistosoma mansoni (14), Taenia crassiceps (25), Brugia malayi (21), and Fasciola hepatica (9, 11). These alternatively activated macrophages (AAMφ) are distinguished from classically activated macrophages by preferential use of arginase 1 (Arg-1), instead of inducible nitric oxide (13), to metabolize l-arginine. A number of other markers of AAMφ have also been identified; these include increased expression of interleukin 10 (IL-10) and the mannose receptor (13), as well as production of intelectin, chitinases, and chitinase-like proteins (22).
Immune responses to helminth infections are often polarized toward the Th2 end of the immune spectrum. These polarized responses may be associated with the development of chronic infections while avoiding parasite clearance by the host (20). Th2-dominated responses have been observed in F. hepatica infection in both mice and the natural ruminant hosts. Antibody production is dominated by the immunoglobulin G1 isotype (5, 23). In experimentally infected cattle, gamma interferon (IFN-γ) production and cellular proliferation are detected soon after infection in response to both F. hepatica antigen and the mitogen concanavalin A. However, in response to both these stimuli, cellular proliferation and IFN-γ production decrease as infection progresses, and when an animal enters the chronic stage of infection, these responses are no longer detectable (6). These highly polarized immune responses may be associated with increased host susceptibility to other pathogens. In a murine model of coinfection with Bordetella pertussis, F. hepatica was responsible for reduced bacterial clearance and specific IFN-γ production (4). Infection with F. hepatica has also been shown to have downregulatory effects on Mycobacterium bovis BCG-specific immune responses in cattle (12). A population of AAMφ identified in these coinfected animals may be responsible for some of the negative effects on M. bovis BCG-specific immune responses. AAMφ generated during T. crassiceps infections have been implicated in favoring Leishmania mexicana and Leishmania major replication in T. crassiceps-infected mice (24).
The nature of the interaction of parasites or parasite products with Mφ is still not fully clear. However, evidence suggests that carbohydrate residues on parasite products are associated with Toll-like receptor (TLR) signaling (15). There is evidence to suggest that activated Mφ have a limited ability to repolarize in response to differing and sequential signals, such as cytokines, lipopolysaccharide (LPS), or TLR ligands. Experiments using rat-derived Mφ have demonstrated that the first cytokine the cell encounters will determine the response regardless of subsequent stimulation (10). While other workers have produced evidence showing the functional plasticity of murine Mφ, these Mφ were shown to change their responses following exposure to sequential changes in stimuli (27).
In this study we present data examining the kinetics of IL-4 and IL-10 over the course of experimental infection. We then examine the interactions of IL-4 and excretory/secretory products (ES), reflecting the microenvironment of an infected host, in activating bovine Mφ in vitro. Examination of the influence of ES on the interaction of TLR 2 (TLR2) and TLR4 stimuli with Mφ reveals a negative interaction, while heat inactivation and oxidation of ES suggests that glycan residues have some role to play in parasite-host interactions.
MATERIALS AND METHODS
Experimental infection and cytokine kinetics.
Four castrated Friesian cattle were housed indoors and fed high-quality silage ad libitum at University College Dublin's Lyons Research Estate, County Kildare, Ireland. Animals were experimentally infected with metacercarie as previously described (12). These infected animals were used to measure the kinetics of IL-4 and IL-10 production.
At the indicated time points, peripheral blood mononuclear cells (PBMCs) from F. hepatica-infected animals were isolated over Ficoll-Histopaque (Sigma-Aldrich, United Kingdom) and cultured in complete RPMI 1640 (Invitrogen) containing 10% heat-inactivated fetal calf serum (Sigma-Aldrich), 200 U/ml penicillin (Sigma-Aldrich), and 200 μg/ml streptomycin (Sigma-Aldrich). Cells were plated, in triplicate, at a density of 1 × 10⁵ cells per well in 100-μl volumes. For cytokine production, F. hepatica excretory/secretory products (FhepES) were added at a concentration of 10 μg/ml with phosphate-buffered saline (PBS) as a control. Following 72 h of incubation, supernatants were harvested and stored at −20°C until analyzed. All animal work was conducted under license from the Department of Children and Health following approval by the University College Dublin Ethics Committee.
Macrophage isolation, culture, and activation.
Blood collected from naïve healthy animals was used for the generation of monocyte-derived macrophages (MDM). Blood was collected into lithium heparin-coated Vacutainers, and isolation of Mφ was performed as described elsewhere (12). Briefly, PBMCs were isolated from blood by centrifugation over Ficoll-Histopaque (Sigma-Aldrich). Cells were washed three times in warmed complete medium (RPMI 1640 [Invitrogen] containing 10% fetal calf serum [Sigma-Aldrich], 200 U/ml of penicillin [Sigma-Aldrich], 200 μg/ml of streptomycin [Sigma-Aldrich], and 1% nonessential amino acids [Invitrogen]). Cells were then labeled with mouse anti-human CD14 microbeads (Miltenyi) and isolated by positive selection on a magnetic column. CD14+ fractions were routinely checked for purity by Giemsa staining. CD14+ fractions were washed twice in complete medium and adjusted to a concentration of 1 × 10⁶ cells/ml and added to 96-well plates (Sarstedt) in 200-μl volumes. To generate MDM, cells were cultured for 7 days, with the medium changed every second day. Activating molecules were added to mature Mφ in a final volume of 20 μl of medium at the indicated concentrations, and cells were incubated for a further 48 h. LPS derived from Escherichia coli 111:B4 (1 μg/ml) was used as a TLR4 antagonist (8). M. bovis purified protein derivative, PPD-B, used at indicated concentrations, was used as a stimulus for TLR2 activity (30).
Antigen preparation.
FhepES were prepared as previously described and purified to remove contaminating endotoxin residues (12). To heat inactivate FhepES prior to use, samples were heated to 95°C for 15 min (2). Glycan residues were destroyed by oxidizing FhepES samples as described elsewhere (16).
Macrophage phenotyping.
Following stimulation for the indicated period of time, supernatants were removed from Mφ cultures and centrifuged to remove cell debris before storage at −20°C. Fifty microliters of 1% Triton X-100 was added to each of the wells on the plate, and cells were lysed by shaking for 15 min. Lysates were stored at −20°C. Mφ phenotyping was performed by measurement of arginase, NO, and acidic chitinase production as described below.
(i) Arginase activity.
Cell lysates (50 μl) were activated by heating to 55°C for 10 min with 50 μl Tris buffer (25 mM Tris-HCl buffer with 10 mM MnCl2 [pH 7.5]). An equal volume (25 μl) of this mixture was added to 0.5 M arginine (pH 9.7) and incubated for 1 h at 37°C. The reaction was stopped by the addition of 400 μl of acid stop solution (96% H2SO4, 85% H3PO4, and H2O at a ratio of 1:3:7), 25 μl of 9% isonitrosopriopherone was added and heated to 100°C for 45 min. Optical densities at 570 nm were measured and compared to a urea standard curve, where one unit of enzyme activity is equal to the amount of urea produced in the reaction. Results were expressed as milliunits of activity per 106 cells (mU/106 cells).
(ii) Nitric oxide.
Nitric oxide levels were quantified using the Griess reaction. Briefly, 50 μl of supernatant was added to 100 μl of sulfanilamide solution and incubated in the dark at room temperature for 10 min. One hundred microliters of N-1-napthylethylenediamine dihydrochloride solution was then added and incubated as described above. Optical densities at 570 nm were measured, and nitrate was quantified by comparison with a standard curve.
(iii) Acidic chitinase activity.
Chitinase activity was determined using a standard assay (3). Briefly, 10 μl of supernatant was added to 40 μl of 0.1 M sodium citrate buffer containing 0.025 mM of substrate, 4-methylumbelliferyl-β-d-N,N′,N″-diacetylchitobioside (Sigma). The assay was buffered to pH 2.5 specifically to measure acidic chitinase (AMCase) activity only. The reaction mixture was incubated at 37°C for 3 h and stopped by the addition of 200 μl of 0.25 M glycine-NaOH (pH 10.5). Fluorescence was measured by excitation at 365 nm and emission at 460 nm. Chitinase activity was quantified by comparison with a standard curve of 4-methylumbelliferone (Sigma), and activity was expressed as nanomoles/hour/milliliter.
Cytokine detection.
IFN-γ was measured using the Bovigam enzyme-linked immunosorbent assay (ELISA) test kit according to the manufacturer's instructions. IL-4 was quantified by a commercial ELISA (Endogen), and values are reported as picograms/milliliter. IL-10 was quantified by an ELISA using paired antibodies (Serotec) as previously described (17). Briefly, anti-IL-10 capture antibody (clone CC318) was added to wells of a 96-well plate (Nunc) at a concentration of 6 μg/ml in carbonate-bicarbonate coating buffer, pH 9.6, and the plate was incubated overnight at room temperature. Plates were washed three times after each step in PBS containing 0.05% Tween 20. After the wells were coated, all incubations were for 1 h at room temperature. The plate was blocked by the addition of PBS containing 0.05% Tween 20 and 1% bovine serum albumin, and samples were added in duplicate. Following this, anti-IL-10 antibody (clone CC320) coupled to biotin was added at a concentration of 2 μg/ml. Streptavidin-horseradish peroxidase was diluted to 1/1,000 in blocking buffer and added to the plate for 30 min. Color was developed by the addition of 3,3′,5,5′-tetramethylbenzidine (TMB) for 10 min, and the reaction was stopped by the addition of 1% H2SO4. Optical densities were measured at 450 nm. The results are reported as optical density index (ODI) calculated as follows; experimental reading minus background reading multiplied by 1,000.
Statistical analysis.
Cytokine, enzyme, and nitric oxide levels were tested for significant differences by the Student t test in the initial activation experiment using ES (Minitab). In experiments using IL-4 and ES and ES with TLR agonists, analysis of variance (ANOVA) (Minitab) was used to detect statistically significant differences.
RESULTS
Th2 cytokine production elicited by FhepES stimulation of lymphocytes from F. hepatica-infected animals.
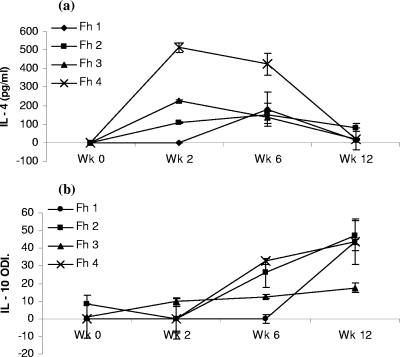
IL-4 and IL-10 production by PBMCs restimulated in vitro with FhepES was examined from four F. hepatica-infected animals over the course of a 12-week infection. Postinfection, IL-4 production peaked between weeks 2 and 6, with levels at week 6 ranging from 135.5 pg/ml to 423 pg/ml. Subsequently, decreasing levels of IL-4 were observed as the infection reaches chronic stages (Fig. 1a). IL-10 production in the same cultures were initially low with only one of four infected animals producing detectable IL-10 at week 2. By week 6, three of four infected animals were producing detectable levels, and these continued to rise steadily, reaching a peak at week 12 (Fig. 1b).
FIG. 1.
Stimulation of PBMCs from F. hepatica-infected animals with FhepES elicits Th2 cytokines. Lymphocytes isolated, at the indicated time point after infection from four animals (Fh 1, Fh 2, Fh 3, and Fh 4), were stimulated with FhepES (20 μg/ml), and after 72 h, supernatants were collected, and the relevant cytokines were measured. (a) IL-4 was measured by an ELISA, and the amounts are shown in picograms/milliliter. (b) IL-10 was measured by an ELISA, and results are shown as optical density index (ODI) calculated by subtraction of control (PBS reading) from experimental (ES-stimulated) reading, and then the optical density is multiplied by 1,000. All cells were cultured in triplicate, and results are average readings ± standard errors of the means (error bars). Wk, week.
Alternative activation of macrophages by a F. hepatica-derived molecule.
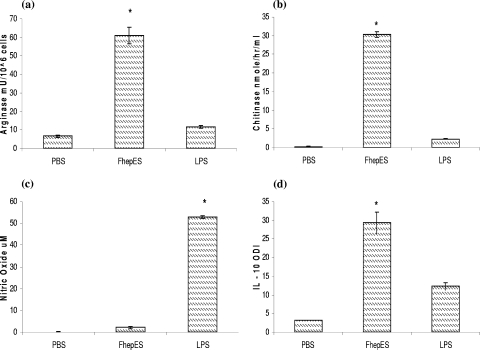
We generated AAMφ by exposing MDM from healthy uninfected cattle to FhepES concentration of 20 μg/ml (calculated from dose-response curves [data not shown]). High levels of Arg-1 (60.9 mU/106 cells), AMCase (30.3 nmol/h/ml), and IL-10 (ODI of 29.3) were produced by FhepES-stimulated cells (Fig. 2). The levels of Arg-1, AMCase, and IL-10 produced by FhepES-stimulated cells were significantly higher than those in LPS-stimulated cells. IL-10 was also detected in LPS-stimulated cultures. However, the levels of IL-10 produced by FhepES-stimulated Mφ were significantly higher than those produced by LPS stimulation (ODI of 29.3 ± 2.8 versus 12.33 ± 1.01 [P < 0.005]). LPS incubation resulted in levels of NO significantly higher than those from FhepES-stimulated cells (P < 0.005).
FIG. 2.
Matured Mφ, at a density of 2 × 10⁵ cells, were stimulated with PBS, FhepES (20 μg/ml), or LPS (1 μg/ml) for 48 h. (a) Arg-1 activity (in milliunits of activity per 106 cells) in lysates. (b) AMCase activity (in nanomoles/hour/milliliter) from supernatants. (c) NO levels (in micromolar) in supernatants. (d) IL-10 (measured as ODI) was detected by an ELISA. The values for groups given experimental treatments were significantly different (P < 0.05 by the Student t test) as indicated by the asterisk. All cells were cultured in triplicate, and values are shown as averages ± standard errors of the means (error bars). Results shown are representative of three independent experiments.
Synergy between FhepES and IL-4 in macrophage activation.
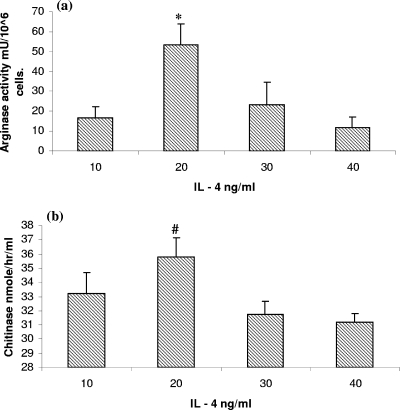
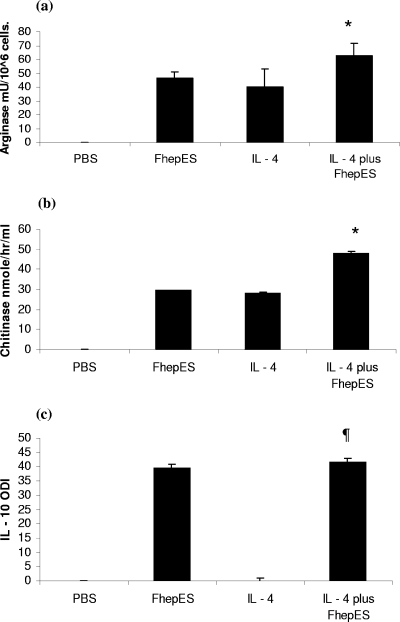
The optimal concentration of IL-4 for use in in vitro assays was determined by a dose-response curve. Using arginase and AMCase activity as markers of activation, we found 20 ng/ml to be the optimal dose (Fig. 3a and b). We exposed MDM to IL-4 and found upregulation of Arg-1 and AMCase. When cells were treated with IL-4 and FhepES together, we found increased levels of Arg-1 and AMCase (Fig. 4a and b). The levels of Arg-1 were found to be significantly greater in cultures exposed to both ES and IL-4, with costimulation producing 62.43 ± 12.94 mU/106 cells versus 40.01 ± 8.98 mU/106 cells for cells treated with IL-4 only (P < 0.02). The same pattern was found for AMCase (P < 0.01). However, we found no evidence for IL-10 production in cultures stimulated with IL-4. IL-10 release was detected only after the addition of FhepES to IL-4-stimulated cultures. Stimulation with IL-4 alone or with IL-4 plus FhepES did not result in NO production (data not shown).
FIG. 3.
Mφ were cultured at a density of 2 × 10⁵ in the presence of increasing doses (10 to 40 ng/ml) of recombinant bovine IL-4 as indicated. (a) Arg-1 activity (in milliunits of activity per 106 cells) was seen to peak at 20 ng/ml, while (b) AMCase had maximal activity at 20 ng/ml. The value for the group treated with 20 ng/ml was significantly different (P < 0.05) from the values for the other groups (indicated by the asterisk). The value for the group treated with 20 ng/ml was significantly different (P < 0.05 by ANOVA) from the values for the groups treated with 30 and 40 ng/ml (indicated by the # symbol). Values are shown as averages plus standard errors of the means (error bars).
FIG. 4.
Mφ were cultured as described in the legend to Fig. 3 in the presence or absence of IL-4 (20 ng/ml), either alone or with FhepES (20 μg/ml). (a) Arg-1 activity (in milliunits of activity per 106 cells). Cultures treated with the combination of FhepES and IL-4 had greater enzyme activation than cultures treated with either alone. (b) Effect of FhepES on IL-4-driven AMCase activity (in nanomoles/hour/milliliter). A similar upregulation was seen as with Arg-1. (c) IL-10 (measured as ODI) measured by an ELISA. All FhepES-stimulated cultures had significantly more IL-10 than those stimulated with IL-4 only. All cells were cultured in triplicate, and values are shown as means plus standard errors of the means (error bars). The values of cultures treated with IL-4 plus FhepES were significantly different (P < 0.05) from the values of cultures treated with either IL-4 or FhepES alone (indicated by the asterisk). The values of cultures treated with IL-4 plus FhepES were significantly different (P < 0.005 by ANOVA) from the values for cultures treated with IL-4 only (indicated by the ¶ symbol). Values are shown as averages plus standard errors of the means (error bars). Results shown are representative of three independent experiments.
Effects of FhepES on responses of macrophages to PPD-B and LPS.
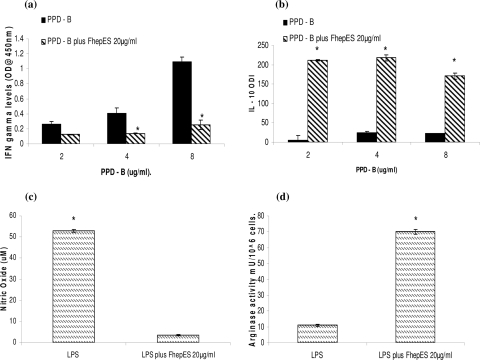
To examine the plasticity of Mφ, cells were exposed to increasing concentrations of PPD-B and simultaneously incubated with FhepES, IFN-γ, and IL-10 levels were measured in the culture supernatants. IFN-γ levels were found to increase as the dose of PPD-B was increased (Fig. 5a). However, when FhepES was added to parallel cultures, IFN-γ production was reduced. No significant difference between the low-dose PPD-B culture and the parallel PPD-B-FhepES culture was observed in terms of IFN-γ production, suggesting that a high dose of PPD-B is required to stimulate IFN-γ production. IL-10 was produced following PPD-B stimulation alone. Again, the lowest dose of PPD-B alone was not sufficient to induce IL-10 levels above background. The addition of FhepES to parallel cultures resulted in massive release of IL-10, with a four- to fivefold increase. The effect of FhepES on the ability of LPS to classically activate macrophages was evaluated. LPS alone induces high levels of NO (Fig. 2c and 5c). The addition of FhepES, however, inhibits this effect (Fig. 5c). Similarly, FhepES modulates the LPS-stimulated Mφ away from the classical phenotype, instead favoring production of Arg-1 (Fig. 5d). These results suggest that FhepES has the ability to modulate the phenotype of LPS- and PPD-B-stimulated Mφ.
FIG. 5.
Effects of FhepES on TLR2 and TLR4 stimulation. (a and b) Effect of FhepES on PPD-B stimulation. The values for cells stimulated with FhepES and PPD-B were significantly different (P < 0.005 by ANOVA) from the values for cells stimulated with PPD-B only (indicated by asterisks). (a) Simultaneous incubation of Mφ with FhepES and increasing concentrations of PPD-B (in micrograms/milliliter) result in reduced IFN-γ production (optical density at 450 nm) as measured by an ELISA. (b) IL-10 (measured as ODI) is secreted following PPD-B stimulation but massively upregulated by the addition of FhepES. (c and d) Effect of FhepES (20 μg/ml) on LPS stimulation (1 μg/ml). Values for cells stimulated with FhepES plus PPD-B were significantly different (P < 0.005) from the values for cells stimulated with LPS plus FhepES and cells stimulated with LPS only (indicated by asterisks). (c) Nitric oxide level (in micromolar) in supernatant of stimulated cells. (d) Arg-1 activity (in milliunits of activity per 106 cells) in cell lysates. All cells were cultured in triplicate, and values are means plus standard errors of the means (error bars). Results shown are representative of three independent experiments.
The effects of FhepES are heat labile and partially dependent on glycan residues.
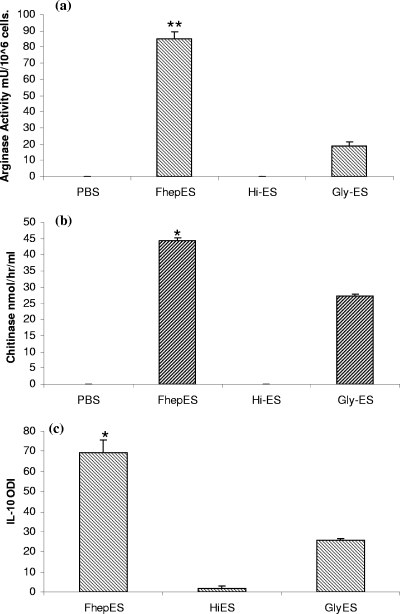
To examine the effects of heat inactivation on the capacity of FhepES (heat-inactivated FhepES [Hi-ES]) to activate Mφ, FhepES were heated to 95°C. When Hi-ES were used to stimulate cells, no response could be seen, suggesting that heat inactivation had denatured the components of FhepES responsible for Arg-1, AMCase, and IL-10 production (Fig. 6). FhepES were oxidized to destroy glycan residues, Gly-ES, within the parasite material. Stimulation of cells with this revealed a decrease in all parameters measured. While the effects of glycan removal were not as dramatic as heat inactivation, they resulted in a reduction of approximately 50% in IL-10 and AMCase production (P < 0.05). The reduction in Arg-1 production was the most pronounced with activity falling from 85.01 mU/106 cells for FhepES to 18.51 mU/106 cells for Gly-ES (P < 0.005) (Fig. 6a).
FIG. 6.
Effects of heat inactivation (Hi) and glycan destruction (Gly) on the activation of Mφ by FhepES. Cells were treated with FhepES, Hi-ES, or Gly-ES at 20 μg/ml. Measurements were made on cell lysates for Arg-1 (a) or on supernatants for AMCase (b) or IL-10 (c). Arg-1 activity is shown in milliunits of activity per 106 cells, AMCase is shown in nanomoles/hour/milliliter, and IL-10 is measured as ODI. Hi-ES-treated cells produced no response in terms of Arg-1, AMCase, and IL-10 compared to the values for FhepES-treated cells, while Gly-ES-treated cells had significantly reduced IL-10, AMCase, and Arg-1 levels as judged by the Student t test (P < 0.05 [*]; P < 0.005 [**]). All cells were cultured in triplicate, and values are means plus standard errors of the means (error bars). This experiment was repeated twice with similar results.
DISCUSSION
Here we demonstrate the production of IL-4, a key Th2 cytokine, by PBMCs of F. hepatica-infected cattle following restimulation in vitro. We also describe the shift from IL-4 production to IL-10 production as infection progresses. This is similar to other helminth infections where chronic infections occur. Previous work detailing the immune response of F. hepatica-infected animals demonstrated a strong Th2 bias, characterized by high immunoglobulin G1 production coupled with poor IFN-γ release and cellular proliferation by 4 weeks postinfection (5, 6). The results presented here, describing the kinetics of IL-4 and IL-10 production from animals infected with F. hepatica, add to the knowledge of immune responses to F. hepatica. The presence of IL-10 also explains previous findings, documenting a lack of cellular responsiveness and IFN-γ production in chronically infected animals (5). Previously published work has demonstrated that Th2 cytokine environments favor the development of AAMφ (9, 21, 25), and the presence of IL-4 is thought to play a role in their development. F. hepatica infection in the murine model also favors this, and we have previously shown the presence of AAMφ in F. hepatica-infected cattle (12). Over the course of infection, resting Mφ are exposed to parasite-driven IL-4, which favors alternative activation. Our results support this idea, and the data dealing with IL-4 in combination with FhepES suggest there may be synergy between the two.
The function of AAMφ in helminth infections is not fully clear; they have been implicated in a number of roles, including protection from immunopathology (14), parasite expulsion (1), and direct modulation of lymphocyte responses (19, 26, 28, 29). A role for AAMφ in increased susceptibility to coinfection was also demonstrated in T. crassiceps-infected mice (24). In this model, increased replication of Leishmania major and L. mexicana was due to the presence of AAMφ in cestode-infected mice and not the absence of Th1 responses. Our results suggest that AAMφ generated by F. hepatica infection or in vitro exposure to FhepES results in a phenotype that may modulate or simply be nonresponsive to another activating molecule. Incubation with PPD-B, a TLR2 antagonist, together with FhepES resulted in poor IFN-γ release yet high IL-10 production. These results suggest that IL-10 induced by FhepES is downregulating IFN-γ. This could have implications for coinfections with F. hepatica. We have previously demonstrated that F. hepatica alters the diagnostic capacity of assays designed to detect bovine tuberculosis in coinfected animals. Here we show that the high levels of IL-10 produced by Mφ stimulated by FhepES in the presence of PPD-B could be responsible for the poor skin test responses previously seen in coinfected animals (12). Modulation of the Mφ response to LPS was also another feature of cells incubated with FhepES. LPS is a potent Mφ activator and signals through TLR4 to produce NO (8). Here we found a reduction in NO levels in Mφ stimulated with both LPS and FhepES. We also found that Arg-1 production was upregulated even in the presence of LPS. This suggests that the mechanism by which FhepES signals is capable of interfering with LPS signaling. Our results also add to other evidence that Mφ possess a degree of plasticity in their response to signals promoting classical or alternative activation (27). However, the various conditions under which this may occur have yet to be explored. These include sequential stimulation, involving removal of the initial stimulus, washing steps of the cells, and finally the addition of subsequent stimuli (27).
Our results suggest that FhepES may be capable of overriding the effects of TLR2 and TLR4 antagonists on Mφ phenotype. This may occur in one of two ways; alternative activation by FhepES may alter the expression levels of TLR2 or TLR4, or conversely, FhepES may be interacting with one or both of these receptors, leaving them unavailable for additional signaling. The exact method by which helminths interact with the innate immune system is not fully understood, while their ability to modulate many facets of innate immunity is not in question. However, there is growing proof that helminths modulate the host's response though TLR interaction. There is evidence that products derived from early infective S. mansoni larvae can signal through TLR4. In particular, the glycan residues within these extracts were found to be responsible for increased IL-6 and IL-12p40 production (16). Lewis sugars and other glycans from T. crassiceps have been shown to induce IFN-γ via TLR signaling from peritoneal murine Mφ (7). Elsewhere a role for TLR2 has also been implicated in immunopathology in S. mansoni infection (18). Indeed the role of TLR2 was demonstrated to be necessary only in the priming stage of the immune response, suggesting a role for TLR in early recognition of the worm. Our results also point toward a possible interaction with the TLR system during F. hepatica infection. The blockade of other TLR stimuli by FhepES and reduction of effectiveness of Gly-ES point toward this. The majority of interactions between parasite products and the TLR system that have been documented seem to stem from parasite glycoproteins (15). The overriding Th2 nature of helminth immune responses might be explained by two possible suggestions. The possible presence of molecules other than glycans in FhepES having stronger interactions with the innate immune system or the polarization of the immune response may depend on the strength of the binding of the sugars to TLRs. This phenomenon has been demonstrated recently where antibodies directed against T-cell immunoglobulin mucin TIM-1 had differing effects on the response, with binding by one resulting in increased IFN-γ and IL-17 in experimental autoimmune encephalomyelitis, while a second antibody resulted in a Th2 response in the same model. These effects were seen to be related to the avidity with which each antibody bound their epitope (31).
The results presented here suggest that F. hepatica has a strong interaction with the host immune system that may benefit parasite survival. Evidence to suggest a parasite interaction with the TLR system and interference with subsequent signaling is also presented. This has implications for coinfections involving helminths and other pathogens and helps to outline the mechanism behind some of the effects seen in coinfected animals (12). One important unanswered question is the exact nature of the interaction between F. hepatica or its ES with the innate immune system, although the involvement of glycans is highly likely. Studies involving TLR blockade need to be undertaken to test directly the involvement of these receptors. Ultimately, the identification of these molecules and an understanding of how they direct the immune response will aid the quest for effective antiparasite vaccination strategies.
Acknowledgments
R.J.F. was supported by a postgraduate award from the Irish Research Council for Science, Engineering, and Technology. Funding was also provided by the EU Commission under Framework 6, project FOOD-CT-2005-02305-DELIVER.
We are also grateful to Vivan Gath for blood collection, Eamon Gormley for the gift of PPD-B, and Elaine McCarthy for critical reading of the manuscript.
Editor: J. F. Urban, Jr.
Footnotes
Published ahead of print on 10 December 2007.
REFERENCES
- 1.Anthony, R. M., J. F. Urban, Jr., F. Alem, H. A. Hamed, C. T. Rozo, J. L. Boucher, N. Van Rooijen, and W. C. Gause. 2006. Memory TH2 cells induce alternatively activated macrophages to mediate protection against nematode parasites. Nat. Med. 12955-960. [DOI] [PMC free article] [PubMed] [Google Scholar]
- 2.Balic, A., Y. Harcus, M. J. Holland, and R. M. Maizels. 2004. Selective maturation of dendritic cells by Nippostrongylus brasiliensis-secreted proteins drives Th2 immune responses. Eur. J. Immunol. 343047-3059. [DOI] [PubMed] [Google Scholar]
- 3.Boot, R. G., E. F. Blommaart, E. Swart, K. Ghauharali-van der Vlugt, N. Bijl, C. Moe, A. Place, and J. M. Alerts. 2001. Identification of a novel acidic mammalian chitinase distinct from chitotriosidase. J. Biol. Chem. 2766770-6778. [DOI] [PubMed] [Google Scholar]
- 4.Brady, M. T., S. M. O'Neill, J. P. Dalton, and K. H. Mills. 1999. Fasciola hepatica suppresses a protective Th1 response against Bordetella pertussis. Infect. Immun. 675372-5378. [DOI] [PMC free article] [PubMed] [Google Scholar]
- 5.Clery, D., P. Torgerson, and G. Mulcahy. 1996. Immune responses of chronically infected adult cattle to Fasciola hepatica. Vet. Parasitol. 6271-82. [DOI] [PubMed] [Google Scholar]
- 6.Clery, D. G., and G. Mulcahy. 1998. Lymphocyte and cytokine responses of young cattle during primary infection with Fasciola hepatica. Res. Vet. Sci. 65169-171. [DOI] [PubMed] [Google Scholar]
- 7.Dissanayake, S., and A. Shahin. 2007. Induction of interferon-gamma by Taenia crassiceps glycans and Lewis sugars in naïve BALB/c spleen and peritoneal exudate cells. Mol. Immunol. 441623-1630. [DOI] [PubMed] [Google Scholar]
- 8.Dobrovolskaia, M. A., and V. N. Vogel. 2002. TOLL receptors, CD14, and macrophage activation and deactivation by LPS. Microbes Infect. 4903-914. [DOI] [PubMed] [Google Scholar]
- 9.Donnelly, S., S. M. O'Neill, M. Sekiya, G. Mulcahy, and J. P. Dalton. 2005. Thioredoxin peroxidase secreted by Fasciola hepatica induces the alternative activation of macrophages. Infect. Immun. 73166-173. [DOI] [PMC free article] [PubMed] [Google Scholar]
- 10.Erwig, L. P., D. C. Kluth, G. M. Walsh, and A. J. Rees. 1998. Initial cytokine exposure determines function of macrophages and renders them unresponsive to other cytokines. J. Immunol. 1611983-1988. [PubMed] [Google Scholar]
- 11.Flynn, R. J., J. A. Irwin, M. Olivier, M. Sekiya, J. P. Dalton, and G. Mulcahy. 2007. Alternative activation of ruminant macrophages by Fasciola hepatica. Vet. Immunol. Immunopathol. 12031-40. [DOI] [PubMed] [Google Scholar]
- 12.Flynn, R. J., C. Mannion, O. Golden, O. Hacariz, and G. Mulcahy. 2007. Experimental Fasciola hepatica infection alters responses to tests used for diagnosis of bovine tuberculosis. Infect. Immun. 751373-1381. [DOI] [PMC free article] [PubMed] [Google Scholar]
- 13.Gordon, S. 2002. Alternative activation of macrophages. Nat. Rev. Immunol. 323-35. [DOI] [PubMed] [Google Scholar]
- 14.Herbert, D. R., C. Holscher, M. Mohrs, B. Arendse, A. Schwegmann, M. Radwanska, M. Leeto, R. Kirsch, P. Hall, M. Mossmann, B. Claussen, I. Forster, and F. Brombacher. 2004. Alternative macrophage activation is essential for survival during schistosomiasis and downmodulates T helper 1 responses and immunopathology. Immunity 20623-635. [DOI] [PubMed] [Google Scholar]
- 15.Hokke, C. H., and M. Yazdanbakhsh. 2005. Schistosome glycans and innate immunity. Parasite Immunol. 27257-264. [DOI] [PubMed] [Google Scholar]
- 16.Jenkins, S. J., J. P. Hewitson, S. Ferret-Bernard, and A. P. Mountford. 2005. Schistosome larvae stimulate macrophage cytokine production through TLR4-dependent and -independent pathways. Int. Immunol. 171409-1418. [DOI] [PMC free article] [PubMed] [Google Scholar]
- 17.Kwong, L. S., J. C. Hope, M. L. Thom, P. Sopp, S. Duggan, G. P. Bembridge, and C. J. Howard. 2002. Development of an ELISA for bovine IL-10. Vet. Immunol. Immunopathol. 85213-223. [DOI] [PubMed] [Google Scholar]
- 18.Layland, L. E., R. Rad, H. Wagner, and C. U. Prazeres da Costa. 2007. Immunopathology in schistosomiasis is controlled by antigen-specific regulatory T cells primed in the presence of TLR2. Eur. J. Immunol. 372174-2184. [DOI] [PubMed] [Google Scholar]
- 19.Loke, P., A. S. MacDonald, A. Robb, R. M. Maizels, and J. E. Allen. 2000. Alternatively activated macrophages induced by nematode infection inhibit proliferation via cell-to-cell contact. Eur. J. Immunol. 302669-2678. [DOI] [PubMed] [Google Scholar]
- 20.Maizels, R. M., A. Balic, N. Gomez-Escobar, M. Nair, M. D. Taylor, and J. E. Allen. 2004. Helminth parasites—masters of regulation. Immunol. Rev. 20189-116. [DOI] [PubMed] [Google Scholar]
- 21.Nair, M. G., D. W. Cochrane, and J. E. Allen. 2003. Macrophages in chronic type 2 inflammation have a novel phenotype characterized by the abundant expression of Ym1 and Fizz1 that can be partly replicated in vitro. Immunol. Lett. 85173-180. [DOI] [PubMed] [Google Scholar]
- 22.Nair, M. G., K. J. Guild, and D. Artis. 2006. Novel effector molecules in type 2 inflammation: lessons drawn from helminth infection and allergy. J. Immunol. 1771393-1399. [DOI] [PMC free article] [PubMed] [Google Scholar]
- 23.O'Neill, S. M., M. T. Brady, J. J. Callanan, G. Mulcahy, P. Joyce, K. H. Mills, and J. P. Dalton. 2000. Fasciola hepatica infection downregulates Th1 responses in mice. Parasite Immunol. 22147-155. [DOI] [PubMed] [Google Scholar]
- 24.Rodríguez-Sosa, M., I. Rivera-Montoya, A. Espinoza, M. Romero-Grijalva, R. López-Flores, J. González, and L. I. Terrazas. 2006. Acute cysticercosis favours rapid and more severe lesions caused by Leishmania major and Leishmania mexicana infection, a role for alternatively activated macrophages. Cell. Immunol. 24261-71. [DOI] [PubMed] [Google Scholar]
- 25.Rodríguez-Sosa, M., A. R. Satoskar, R. Calderón, L. Gomez-Garcia, R. Saavedra, R. Bojalil, and L. I. Terrazas. 2002. Chronic helminth infection induces alternatively activated macrophages expressing high levels of CCR5 with low interleukin-12 production and Th2-biasing ability. Infect. Immun. 703656-3664. [DOI] [PMC free article] [PubMed] [Google Scholar]
- 26.Smith, P., C. M. Walsh, N. E. Mangan, R. E. Fallon, J. R. Sayers, A. N. J. McKenzie, and P. G. Fallon. 2004. Schistosoma mansoni worms induce anergy of T cells via selective up-regulation of programmed death ligand 1 on macrophages. J. Immunol. 1731240-1248. [DOI] [PubMed] [Google Scholar]
- 27.Stout, R. D., C. Jiang, B. Matta, I. Tiezel, S. K. Watkins, and J. Suttles. 2005. Macrophages sequentially change their functional phenotype in response to changes in microenvironmental influences. J. Immunol. 175342-349. [DOI] [PubMed] [Google Scholar]
- 28.Taylor, M. D., A. Harris, M. G. Nair, R. M. Maizels, and J. E. Allen. 2007. F4/80+ alternatively activated macrophages control CD4+ T cell hyporesponsiveness at sites peripheral to filarial infection. J. Immunol. 1766918-6927. [DOI] [PubMed] [Google Scholar]
- 29.Terrazas, L. I., D. Montero, C. A. Terrazas, J. L. Reyes, and M. Rodriguez-Sosa. 2005. Role of the programmed Death-1 pathway in the suppressive activity of alternatively activated macrophages in experimental cysticercosis. Int. J. Parasitol. 351349-1358. [DOI] [PubMed] [Google Scholar]
- 30.Werling, D., J. Piercy, and T. J. Coffey. 2006. Expression of TOLL-like receptors (TLR) by bovine antigen-presenting cells—potential role in pathogen discrimination? Vet. Immunol. Immunopathol. 1122-11. [DOI] [PubMed] [Google Scholar]
- 31.Xiao, S., N. Najafian, J. Reddy, M. Albin, C. Zhu, E. Jensen, J. Imitola, T. Korn, A. C. Anderson, Z. Zhang, C. Gutierrez, T. Moll, R. A. Sobel, D. T. Umetsu, H. Yagita, H. Akiba, T. Strom, M. H. Sayegh, R. H. DeKruyff, S. J. Khoury, and V. K. Kuchroo. 2007. Differential engagement of Tim-1 during activation can positively or negatively costimulate T cell expansion and effector function. J. Exp. Med. 2041691-1702. [DOI] [PMC free article] [PubMed] [Google Scholar]


