

Abstract
A sub-dural surface microelectrode array designed to detect microfield evoked potentials has been developed. The device is comprised of an array of 350-micron square gold contacts, with bi-directional spacing of 150 microns, contained within a polyimide Kapton material. Cytotoxicity testing suggests that the device is suitable for use with animal and human patients. Implementation of the device in animal studies revealed that reliable evoked potentials could be acquired. Further work will be needed to determine how these microfield potentials, which demonstrate selectivity for one eye, relate to the distribution of the ocular dominance columns of the occipital cortex.
Keywords: surface microelectrodes, visual cortex, polyimide electrodes, visual evoked potentials, multi-electrode arrays
Introduction
Single-unit research in animal models has revealed highly detailed knowledge of how information is processed in a number of settings. For example, research has revealed that there are particular neurons in the motor cortex that, through their connections with other neurons in the motor cortex, fire in correlation with arm reach in a particular direction in primates (Georgopoulos, 1996). Other researchers have shown that neurons in the dorsolateral prefrontal cortex are activated in association with the task of directing attentional resources at keeping something actively held in memory (working memory) in primates (Goldman-Rakic, 1987). Although these lines of research have facilitated our understanding of the cortical areas responsible for processes such as motor control and working memory, similar details regarding how information is processed in areas of cortex specific to humans, such as those responsible for human language, have eluded us. There are three reasons for this lack of detailed understanding: 1) the studies involving these areas are largely limited to the macroscopic studies utilizing functional neuroimaging and lesion approaches; 2) the lack of specifically analogous areas in animal models and 3) the limited ability to use penetrating microelectrodes with human subjects due to the inherent invasive nature of the penetrating electrodes. One approach that some researchers have used to acquire a more detailed understanding of information processing within the cortex has been examining neural processing at the level of the cortical columns. Throughout the cortex, neurons are organized into functional units called columns. The cortical columns of the mammalian cortex are typically 300 to 500 microns in transverse diameter, and do not differ significantly in size between mammalian brains that vary in size over three orders of magnitude (Bugbee and Goldman-Rakic, 1983). The details of this columnar neuronal circuitry have been particularly well described for the primary visual cortex. Within the visual cortex, each cortical column receives information from each eye in an alternating (left eye, right eye) pattern (Mountcastle, 1997; Gurshumov and Yinon, 2005). Additionally, detailed studies are widely available for the somatosensory cortex, auditory cortex, and motor cortex (Mountcastle, 2003). Investigations regarding the processing of more complex information have also been performed. For example, the columnar organization of motion detection in the medial temporal area and visual object discrimination in the inferior temporal cortex have been well described (Cook and Maunsell, 2004). However, as with the research previously discussed involving investigation at the level of the single-unit, the research directed at examining neural processing at the level of the cortical columns is also limited in the relatively human-specific areas of cortex. Therefore, development of a nonpenatrating microelectrode array that is suitable for use with human patients would provide a relatively noninvasive method for investigating these cortical areas for which such detailed information is quite limited.
In order to understand how information is processed in the brain using nonpenetrating electrodes, we have developed an array of nonpenetrating electrodes designed to detect microfield potentials from the surface of the cortex. The size and arrangement of these electrodes are similar to those of the cortical columns. Previous research in a rodent model using a similar single-contact surface electrode has demonstrated the ability, using signal averaging, to detect highly anatomically specific somatosensory potentials from the primary somatosensory area (Heppelmann et al., 2001). Furthermore, research utilizing linear arrays of surface microelectrodes to investigate the ferret visual cortex has demonstrated the reliability of cortical surface microfield recordings for representing activity of the underlying neurons (Weliky et al., 2003). In this study, we demonstrate the ability to collect microfield potentials from the cortical surface of an animal model utilizing a microelectrode array that is suitable for use with human neurosurgical patients and could be used in further studies to investigate cortical areas not previously described at this level of detail.
Methods & Materials
Biocompatible polyimide and gold were selected as the desired materials for the surface microelectrode array. A microelectrode array consisting of individual electrode contacts with bidirectional spacing in the range of 200-400 microns was desired to detect microfeild potentials at a spatial resolution consistent with the geometrical spacing of cortical columns in mammals (Bugbee and Goldman-Rakic, 1983; Mountcastle, 2003). A 2 × 4 microelectrode array, consisting of 8 individual 350-micron square gold electrode contacts with bidirectional spacing of 150 microns and insulated by Kapton polyimide, was assembled from commercially available printed circuitry linear arrays. The commercially available printed circuits were 1 × 20 linear arrays of gold contacts with dimensions of 350 microns × 1.5 cm and a one-dimensional spacing of 150 microns (Flex circuit cable assembly, Samtec Inc., New Albany, IN). In order to combine multiple linear arrays to produce a multidimensional array, with dimensions similar to the cortical column distribution of mammals, the electrode contact end of two individual linear arrays were measured and cut using a #5 stainless steel blade in a microscopically guided manner in order to achieve linear arrays with the new dimensions of the electrode contacts were 350 × 350 microns in contrast to the original 350 microns by 1.5 cm. A commercial grade adhesive (UHU All Purpose solvent free, UHU GmBH & Co., Buhl, Germany) was applied to the back surface of one of the linear array strips. The second linear array strip was then applied and the correct spacing between the arrays was achieved under microscopic guidance to within 5 microns of the desired spacing. The spacing was maintained and microscopically verified after the adhesive had thoroughly sealed. The final product (2 × 4 microelectrode array, consisting of 8 individual 350-micron square gold electrode contacts with bidirectional spacing of 150 microns and insulated by Kapton polyimide) was then interfaced with the biologic data acquisition equipment, as described in previous research work, to record electrical activity form the subdural cortical surface (Kitzmiller, 2006).
A qualitative cytotoxicity evaluation of the Kapton and gold surface microelectrode array utilized optical, fluorescent, and scanning electron microscopy. Mammalian cortical cells (harvested rat pup cortical cells, embryonic day 18) and human cortical cells (obtained from America Tissue Culture Collection, cell line CRL-10442 and designation HCN-1A) were prepared according to specifications and cultured onto glass slides (control) and the surfaces of the microelectrode arrays (experimental). After 96 hours, cells were stained with FURAII, a calcium dependant fluorescent stain taken-up only by viable cells, and evaluated with fluorescent microscopy. Viable cells were observed on both the control and experimental surfaces. Test specimens and cultured cells were then coated with a monolayer of gold to facilitate imaging using Scanning Electron Microscopy (SEM). Images suggesting the appearance of dendritic and/or axonic growth on the experimental surfaces are shown in Fig. 1. The results of this qualitative analysis, which demonstrated that the microelectrode and control surfaces were not toxic to the human and mammal cells (Black, 1999), along with the widely accepted use of polymides and gold in biomedical devices (Schneider and Steiglitz, 2004; Liu et al., 2003; Kanno et al., 2002; Klinge et al., 2001), suggest that the Kapton and gold microelectrode array is suitable for use with human patients.
Fig. 1.
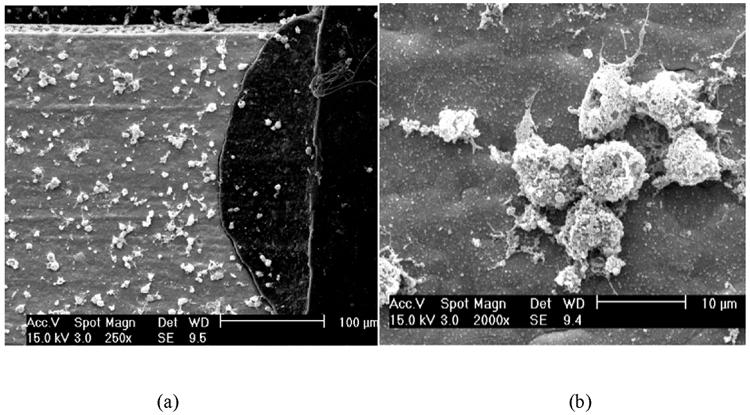
(a) SEM image of human cortical cells cultured on the Kapton and gold microelectrode surface (the light portion is a gold contact and the dark is the polyimide Kapton); (b) SEM image showing axonic and/or dendritic growth from the human cortical cells on the gold microelectrode contact surface.
Implementation of the surface microelectrode array consisted of collecting Visual Evoked Potentials (VEPs) from the subdural occipital cortex of a pig under anesthesia. All procedures involving animals were approved by The Ohio State University Institutional Animal Care and Use Committee in accordance with the NIH Guide for the Care and Use of Laboratory Animals. Anesthesia was induced in the pig using telazol intra-muscularly at a concentration of 6 mg/kg and the animal was intubated and prepped for surgery. Anesthesia was maintained for the rest of the experiment with isoflurane (2% via inhalation). A craniotomy to remove the bone overlying the occipital lobe was performed to expose the cortex. The dura matter was carefully removed, exposing the sub-dural cortical surface. Utilizing both a stereotaxic porcine brain atlas as well as detailed anatomical diagrams from other publications involving recordings from area 17 of the porcine brain, the microelectrode array was placed on the left side, mediolaterally along the caudal pole of the lateral gyrus as depicted in figure 2 (Bernadette, 1999; Eckhorn et al., 2001; Karamanlidis 1972).
Fig. 2.

Exposed sub-dural cortical surface of porcine occipital cortex. Microelectrode recordings were obtained from the left occipital cortex (area 17). Location of electrode placement is indicated.
The array, placed directly on the subdural surface of the primary visual cortex, was interfaced with the Biologic Data Acquisition equipment (Kitzmiller et al., 2006). A 1500-micron penetrating electrode was inserted into the front left shoulder of the pig, at a distance of approximately 18 cm from the recording site, to serve as a reference electrode for the recordings. A Biologic LED visual stimulation board, selected to minimize electrode artifact, was presented to each eye individually at mid-line gaze, while the visual evoked potentials were collected using the surface microelectrode array. The LED visual stimulation board was 6 cm by 6 cm, and the stimulus display was a checkerboard pattern, 1 cm by 1 cm, with an alternating frequency of 1.1 Hz. The distance from the visual stimulator check board to the eye of the pig was maintained at 8 inches and maintained at the midline of gaze.
During data collection, the computer triggered the visual stimulator to phase-lock the stimulus to each sweep. At least 100 sweeps were performed for each VEP collected. The analog signals were sent from the cortical microelectrodes to a switchbox and finally to the computer for further amplification and frequency filtering. Signal filtering (60 Hz and resonant 60 Hz) was used to remove electrical noise and a signal-capturing window of 250 milliseconds was chosen. This window is long enough to ensure the capture of a typical evoked visual potential waveform (Misulis, 1994). Furthermore, previous work with similar electrodes and stimulus presentation conditions had demonstrated that a potential resembling a P100 of a scalp VEP was detected with a positive peak and latency of approximately 120 milliseconds after stimuli presentation (Kitzmiller et al., 2006). This amplified signal was then sampled two times per millisecond and converted into a digital signal, and stored in memory for signal averaging. Gain of the amplifier was 20,000, with signal filtering for greater than 100Hz and lower than 1.0Hz.
Results
The resulting plots for each potential are shown for each eye in Fig. 3, demonstrating four runs with at least 100 sweeps per run, revealing a peak at approximately 120 milliseconds. This 20 millisecond delay from a typical P100 is likely due to the anesthesia and use of an LED visual stimulator (Misulis, 1994). Potentials averaged within each eye are shown in Fig. 4. Adequate data were obtained from six of the eight electrodes in this experiment. This is an improved yield compared to our previous microelectrode study in which a microelectrode array consisting of platinum square microelectrodes, wire-bonded to connecting wires and suspended within a biomedical grade polydimethyl siloxane (PDMS) was utilized with limited success (only single-channel activity out of four could be recorded) due to a lack of mechanical stability of the wire bonded interfaces (Kitzmiller et al., 2006).
Fig. 3.

Surface microfield potentials collected using the Kapton and gold microelectrode arrays. The individual electrode contact site and the corresponding collected potentials are shown. Right eye stimulation potentials plots are shown above left eye stimulation potential plots for each electrode contact. Each plot shows Voltage (V range = -15.0 to +15.0 mV) on the Y-axis and time (t range = 0 to +250.0 msec) on the X-axis. For each plot, the stimulus occurred at time = 0.
Fig. 4.

Averaged surface microfield potentials collected using the Kapton and gold microelectrode arrays. The individual electrode contact site and the corresponding collected potentials are shown. Right eye stimulation potentials plots are shown above left eye stimulation potential plots for each electrode contact. Each plot shows Voltage (V range = -15.0 to +15.0 mV) on the Y-axis and time (t range = 0 msec to +250.0 msec) on the X-axis. For each plot, the stimulus occurred at time = 0.
With a peak amplitude occurring at approximately 120 ms, P100-like activity is readily observed on the averaged potentials in leads 1 and 4. Statistical comparison of the peak amplitudes for four runs of the right eye and four runs of the left eye was performed for each electrode using a t-test. The right eye stimulation demonstrated a significantly greater peak than the left eye stimulation for leads 1 and 4 (p=0.05); but no statistically significant difference existed for the other electrodes. Similarly, the right and left eye potentials were compared for volume of activation, using the area under the peak ± 10 msecs. This analysis also revealed a significantly greater area for right eye stimulation in leads 1 and 4 (p=0.05). In order to demonstrate that the differences in recorded activity for each eye did not result from a failure of the detection equipment or from impaired function of the visual pathways, VEP recordings with identical stimuli, signal detection, and signal averaging parameters were subsequently conducted utilizing 1500-micron penetrating electrodes implanted into the same cortical region. Left eye and right eye stimulation readily resulted in collection of P100-like potentials for these conditions with the penetrating electrodes, opposite in polarity from the surface potentials, as demonstrated in Fig. 5.
Fig. 5.

Averaged potentials collected using the penetrating electrodes for electrodes resoponding to the left eye (a) and right eye (b). For each plot, the stimulus occurred at time = 0.
Discussion
Implementation of the microelectrode array with a porcine model demonstrated that evoked small-field cortical potentials could be collected from six of eight channels. This represents an improved yield over the platinum and PDMS wire-bonded prototype microelectrode array implemented in our previous work. This is likely due to the increased stability of the electrode wire contacts within the polyimide as compared to the fragile wire bonding in the PDMS platinum electrodes (Kitzmiller et al., 2006). The Kapton and gold microelectrode design utilized in the current study is not only more robust but will also allow for the construction of grids with an increased number of contacts than would have been possible with the original Platinum and PDMS design. Fig. 6, which shows the schematic design and electrode contact layout of a 32 channel Kapton and gold surface microelectrode, demonstrates the improved flexibility (in terms of allowing for a higher number of electrode contacts) utilizing innovative printed circuitry fabrication. Arrays of electrodes are also possible with a much greater number of channels with the Kapton and gold design.
Fig. 6.

(a) Schematic of a 32 contact gold and Kapton microelectrode array utilizing printed circuitry; (b) A gold and Kapton 32 contact microelectrode array comprised of gold contacts (200 micron squares with bidirectional pitch of 400 microns in a 4 by 8 grid pattern). (The Ohio State University and Valtronic, USA Inc. Patent pending.)
Since qualitative analysis of the cytotoxicity of the Kapton and gold electrodes demonstrated that the microelectrode grid is non toxic to the human cortical cells, this array may be suitable for use with human studies.
Our results demonstrate that multiple micro-field potentials could be collected simultaneously from a multidimensional surface array and that the activity shows resolution of eye-specific stimulation. Whereas the footprint of the electrode array was designed to resemble that of the distribution of cortical columns on the cortex surface, further investigation will be needed to determine how these micro-field potentials correspond with the electrical activity of cortical columns. As previously noted, the expected spacing of the ocular dominance columns in this animal would be in the range of 300 to 500 microns in transverse diameter. However, further study is needed for better characterization of visual pathways specifically in the porcine model, including determination of the spatial resolution of the surface potentials as they relate to the cortical columns. Future work would also be needed to determine the retinotopic organization of the microelectrode contacts, by mapping which among a range of adjacent LEDs within the segmented LED stimulus correspond to evoked electrical activity detected by the individual microelectrodes. Future data collection should also incorporate filtering at higher frequencies, ranging fro 300 to 600 Hz, in order to determine if any “spike” activity is detected (Weliky et al., 2003). These findings will compliment the macroscopic cortical localization data collected from lesion and functional neuroimaging studies. Of particular interest would be study of human-specific cortical areas, such as the language cortex, which would contribute novel information about the neural architecture of cognitive processing.
Acknowledgment
The fabrication and characterization work was primarily performed at the Ohio MicroMD facility. The testing and evaluation work was conducted at The Ohio State University departments of Neuroscience and University Laboratory Animal Resources laboratories. Financial support included a Pfizer Unrestricted Educational Grant, the Ohio MicroMD MicroGrant program, and the Ohio State University Alumni Grant program, American Academy of Neurology SIGN scholarship, and the OSU Roessler Research Scholarship program. Dr. Beversdorf receives funding from NIDA(R21 DA015734) and NINDS (K23 N343222). Portions of this research were presented at SFN 2004.
Footnotes
Publisher's Disclaimer: This is a PDF file of an unedited manuscript that has been accepted for publication. As a service to our customers we are providing this early version of the manuscript. The manuscript will undergo copyediting, typesetting, and review of the resulting proof before it is published in its final citable form. Please note that during the production process errors may be discovered which could affect the content, and all legal disclaimers that apply to the journal pertain.
Contributor Information
Joseph P. Kitzmiller, Departments of Biomedical Engineering and Neurology; College of Medicine and Public Health, The Ohio State University, 460 Means Hall, 1654 Upham Drive, Columbus, Ohio 43210.
Derek J. Hansford, Departments of Biomedical and Materials Science Engineering, The Ohio State University; Microfabrication, Ohio MicroMD Laboratory, 273 Bevis Hall, 1080 Carmack Hall, Columbus OH 43210.
Linda D. Fortin, Neurodiagnostic Services, Ohio State University Medical Center, The Ohio State University, 410 West 10th Ave, Columbus OH 43210.
Karl H. Obrietan, Department of Neuroscience, The Ohio State University, 4120 Graves Hall, 333 West 10th Ave., Columbus OH 43210.
Valerie K. Bergdall, Department of Veterinary Preventive Medicine; University Lab Animal Resources, The Ohio State University, 101 Wiseman Hall, 400 West 12th Ave., Columbus OH 43210.
David Q. Beversdorf, Department of Neurology, The Ohio State University, Ohio State University Medical Center, 469 Means Hall, 1654 Upham Drive, Columbus OH 43210, Phone (614) 293-8531, Fax: (614) 293-6111, E-mail: david.beversdorf@osumc.edu.
References
- Bernadette F. Stereotaxic atlas of the pig brain. Brain Res. Bull. 1999;49:1–138. doi: 10.1016/s0361-9230(99)00012-x. [DOI] [PubMed] [Google Scholar]
- Black J. Biological Performance of Materials: Fundamentals of Biocompatibilty. Marcel Dekker, Inc; New York: 1999. pp. 323–425. [Google Scholar]
- Bugbee NM, Goldmann-Rakic P. Columnar organization of cortico-cortical projections in squirrel and rhesus monkey: similarity of column width in species differing in cortical volume. J. Comp. Neurol. 1983;220:355–64. doi: 10.1002/cne.902200309. [DOI] [PubMed] [Google Scholar]
- Cook EP, Maunsell JH. Attentional modulation of motion integration of individual neurons in the middle temporal visual area. J. Neurosci. 2004;24:7964–77. doi: 10.1523/JNEUROSCI.5102-03.2004. [DOI] [PMC free article] [PubMed] [Google Scholar]
- Eckhorn R, Stett A, Schanze T, Gekeler F, Schwahn H, Zrenner E, Wilms M, Eger M, Hesse L. Physiological functional evaluation of retinal implants in animal models. Ophthalmologe: Zeischrift der Deutschen Ophthalmologischen Gesellschaft. 2001;98:369–75. doi: 10.1007/s003470170143. [DOI] [PubMed] [Google Scholar]
- Georgopoulos AP. Arm movements in monkeys: behavior and neurophysiology. J. Comp. Physiol. 1996;179:603–12. doi: 10.1007/BF00216125. [DOI] [PubMed] [Google Scholar]
- Goldman-Rakic PS. Circuitry of the primate prefrontal cortex and the regulation of behavior by representational memory. In: Plum F, editor. Handbook of Physology: The Nervous System. American Physiological Society; Bethesda: 1987. pp. 373–417. [Google Scholar]
- Gurshumov N, Yinon U. Columnar organization of the mammalian visual cortex and its vulnerability following lesions in adult cats. Brain Inj. 2005;19:451–7. doi: 10.1080/02699050410001720040. [DOI] [PubMed] [Google Scholar]
- Heppelmann B, Pawlak M, Schmidt RF. Cortical projection of the rat knee joint innervation and its processing in the somatosensory areas SI and SII. Exp. Brain Res. 2001;141:501–6. doi: 10.1007/s002210100888. [DOI] [PubMed] [Google Scholar]
- Kanno M, Kawakami H, Nagaoka S, Kubota S. Biocompatibility of fluorinated polyimide. J. Biomed. Mater. Res. 2002;60:53–60. doi: 10.1002/jbm.1280. [DOI] [PubMed] [Google Scholar]
- Karamanlidis AN, Magras J. Retinal projections in domestic ungulates. I. The retinal projections in the sheep and the pig. Brain Res. 1972;44:127–145. doi: 10.1016/0006-8993(72)90370-8. [DOI] [PubMed] [Google Scholar]
- Kitzmiller J, Beversdorf D, Hansford D. Fabrication and testing of microelectrodes for small-field cortical surface recordings. Biomed. Microdevices. 2006;8:81–5. doi: 10.1007/s10544-006-6386-6. [DOI] [PubMed] [Google Scholar]
- Klinge PM, Vafa MA, Brinker T, Brandis A, Walter GF, Stieglitz T, Samii M, Wewetzer K. Immunohistochemical characterization of axonal sprouting and reactive tissue changes after long-term implantation of a polyimide sieve electrode to the transected adult rat sciatic nerve. Biomaterials. 2001;22:2333–43. doi: 10.1016/s0142-9612(00)00420-8. [DOI] [PubMed] [Google Scholar]
- Liu C, Chen J, Engel J, Zou J, Wang X, Fan Z, Ryu K, Shaikh K, Bullen D. Polymer micromachining and applications in sensors, microfluidics, and nanotechnology. Polymer Preprints. 2003;44:528–9. [Google Scholar]
- Misulis KE. Spehlmann′s Evoked Potential Primer: Visual, Auditory, and Somatosensory Evoked Potentials in Clinical Diagnosis. Butterworth-Heinemann; Boston: 1994. pp. 5–116. [Google Scholar]
- Mountcastle VB. The columnar organization of the neocortex. Brain. 1997;120:701–22. doi: 10.1093/brain/120.4.701. [DOI] [PubMed] [Google Scholar]
- Mountcastle VB. Introduction. Computation in cortical columns. Cereb. Cortex. 2003;13:2–4. doi: 10.1093/cercor/13.1.2. [DOI] [PubMed] [Google Scholar]
- Schneider A, Steiglitz T. Implantable flexible electrodes for functional electrical stimulation. Med. Device Technol. 2004;15:16–8. [PubMed] [Google Scholar]
- Weliky M, Fiser J, Hunt RH, Wagner DN. Coding of natural scenes in primary visual cortex. Neuron. 2003;37:703–18. doi: 10.1016/s0896-6273(03)00022-9. [DOI] [PubMed] [Google Scholar]