Abstract
The Taq DNA polymerase is the most commonly used enzyme in DNA sequencing. However, all versions of Taq polymerase are deficient in two respects: (i) these enzymes incorporate each of the four dideoxynucleoside 5′ triphosphates (ddNTPs) at widely different rates during sequencing (ddGTP, for example, is incorporated 10 times faster than the other three ddNTPs), and (ii) these enzymes show uneven band-intensity or peak-height patterns in radio-labeled or dye-labeled DNA sequence profiles, respectively. We have determined the crystal structures of all four ddNTP-trapped closed ternary complexes of the large fragment of the Taq DNA polymerase (Klentaq1). The ddGTP-trapped complex structure differs from the other three ternary complex structures by a large shift in the position of the side chain of residue 660 in the O helix, resulting in additional hydrogen bonds being formed between the guanidinium group of this residue and the base of ddGTP. When Arg-660 is mutated to Asp, Ser, Phe, Tyr, or Leu, the enzyme has a marked and selective reduction in ddGTP incorporation rate. As a result, the G track generated during DNA sequencing by these Taq polymerase variants does not terminate prematurely, and higher molecular-mass G bands are detected. Another property of these Taq polymerase variants is that the sequencing patterns produced by these enzymes are remarkably even in band-intensity and peak-height distribution, thus resulting in a significant improvement in the accuracy of DNA sequencing.
Keywords: x-ray crystallography, DNA sequencing
The DNA polymerase I from Thermus aquaticus (Taq polymerase) has been used extensively in PCRs to amplify small quantities of DNA (1). Because of its high turnover number, lack of a proofreading activity, high-temperature optimum, and ability to incorporate 7-deaza-3-deoxyguanosine efficiently, Taq DNA polymerase also has been used extensively for DNA sequencing (2). In particular, it is the ability of this enzyme to amplify small amounts of template DNA through “thermocycling” that has made it an especially useful tool for the high-throughput demands of genome-sequencing projects.
All current sequencing protocols rely on the incorporation of dideoxynucleoside 5′ triphosphates (ddNTPs) to terminate chain extension and generate sequence ladders. Although Taq DNA polymerase yields long stretches of DNA sequence, it shows uneven peak-height or band-intensity patterns in dye-labeled or radio-labeled DNA sequence profiles, respectively (3). The bases for this detrimental behavior have been investigated (4): (i) wild-type Taq polymerase strongly selects against ddNTPs, and (ii) wild-type Taq polymerase strongly favors ddGTP incorporation over all other ddNTPs. The first problem (selection against ddNTPs) was solved by mutating a Phe residue at position 667 to Tyr (5); this mutant Taq polymerase enzyme shows increased rates of ddNTP incorporation. Unfortunately, this enzyme still generates sequencing patterns that are variable in band intensity or peak height. As a result, the sequence is not determined with complete accuracy. The second problem (uneven incorporation of ddNTPs with strong bias in favor of ddGTP incorporation) is addressed in this report: we have made Taq DNA polymerases mutated at position 660 that incorporate ddGTP at rates similar to those observed for the incorporation of ddATP, ddTTP, or ddCTP. These enzymes also produce sequencing patterns with even band intensities for all four ddNTPs during radiolabeled DNA sequencing. The inspiration for the design of these enzymes with improved properties of ddNTP incorporation was provided by a comparison of the crystal structures of four ternary closed complexes of the large fragment of the Taq DNA polymerase (Klentaq1) bound to a primer/template DNA and a ddNTP (referred to as ddNTP-trapped). One of these complexes (the ddCTP-trapped complex) has been described (6), and the other three, i.e., the ddATP-, ddTTP-, and ddGTP-trapped complexes, are described here.
MATERIALS AND METHODS
Crystallization and Structure Determination.
To form the ddATP-, ddGTP-, and ddTTP-trapped complexes, the sequence of the template used to form the ddCTP-trapped complex (6) was modified to include two Ts, two Cs, or two As, respectively, at the position of the two first single-stranded template bases. After annealing with a primer DNA as described (6), the primer/template duplexes were reacted with ddATP, ddGTP, and ddTTP, respectively. The resulting trapped complexes crystallized in conditions similar to the ddCTP-trapped complex described in ref. 6 and diffracted to a resolution of 2.3 Å. All crystals were in the same space group with cell dimensions similar to the ddCTP-trapped complex crystals (ref. 6; Table 1). All data were processed and reduced by using denzo and scalepack.‡ The ternary closed complex model of Li et al. (6), in which the incorporated ddCMP, the incoming ddCTP, the correspondingly paired template bases, and the two metal ions were omitted, was then submitted to refinement versus the various data sets (program cns; ref. 7). Simulated annealing-omit maps were generated for the regions of the structure centered around the 3′ end of the primer strand (8). Interpretable electron density for the missing template bases as well as for the incorporated ddNMP, the metal ions, and incoming ddNTP was thus obtained, into which a model for these missing elements could be unambiguously built (Table 1).
Table 1.
Data collection and refinement statistics
| Statistics | Data set
|
||
|---|---|---|---|
| Taq/DNA/ddATP | Taq/DNA/ddTTP | Taq/DNA/ddGTP | |
| Data collection | |||
| Resolution (Å) | 30–2.3 | 30–2.3 | 30–2.3 |
| Cell dimensions a, b, c* | 107.9, 107.9, 90.2 | 107.9, 107.9, 90.2 | 108.5, 108.5, 90.5 |
| Reflections, observed/unique | 290,633/26,823 | 273,847/26,152 | 193,699/27,317 |
| Completeness, %† | 94.9/87.1 | 93.8/87.3 | 94.2/85.8 |
| Rsym, %‡ | 8.0 | 8.8 | 9.3 |
| Refinement | |||
| Resolution, (Å) | 30–2.3 | 30–2.3 | 30–2.3 |
| Reflections | 25,948 | 25,649 | 26,114 |
| Completeness, % § | 90.1/82.6 | 89.0/82.5 | 89.3/81.1 |
| R/Rfree, %¶ | 23.5/27.6 | 22.7/28.0 | 22.8/28.5 |
| Average B factors, Å2 | |||
| Main chain atoms | 23.0 | 23.1 | 22.9 |
| Side chain atoms | 24.0 | 23.8 | 23.5 |
| rms Deviation | |||
| Bond length, Å | 0.007 | 0.007 | 0.009 |
| Bond angle, degrees | 1.501 | 1.472 | 1.645 |
Space group is P3121.
Completeness for I/σ(I) > 1.0.
Rsym = Σ|I − 〈I〉|/ΣI, where I = observed intensity and 〈I〉 = average intensity from multiple observations of symmetry-related reflections.
Completeness for the “working set” at F/σ(F) > 2.0.
Rfree was calculated by using 5% of the total reflections (“test set”). PDB entry codes were 1QSY, 1QTM, and 1QSS for the ddATP-, ddTTP-, and ddGTP-trapped complexes, respectively.
Mutations at Positions 660 and 667.
Site-directed mutagenesis was carried out by using reverse PCR with the Quickchange site-directed mutagenesis kit (Stratagene). For the R660D mutation, the two following oligonucleotides were designed: forward (GAC CCC CTG ATG CGC GAC GCG GCC AAG ACC ATC AAC) and reverse (GTT GAT GGT CTT GGC CGC GTC GCG CAT CAG GGG GTC). For the R660S, R660F, R660Y, and the R660L mutations, similar forward and reverse oligonucleotides were used except that the AGT, TTT, TAT, and CTG codons were used instead of the GAC codon underlined in the forward oligonucleotide sequence above. For the F667Y mutation, the two following oligonucleotides were used: forward (GCG GCC AAG ACC ATC AAC TAC GGG GTC CTC TAC GGC) and reverse (GCC GTA GAG GAC CCC GTA GTT GAT GGT CTT GGC CGC). Recombinants were selected and sequenced directly. Protein production and purification proceeded as for wild type (6).
DNA Sequencing Assays.
Activity of the wild-type and mutant Taq DNA polymerases was tested by using radio-labeled DNA sequencing (in the absence of a method to quantitate dye-labeled band peaks, we did not attempt to test the mutants by using dye-labeled DNA sequencing). The template DNA used for sequencing was from the bacteriophage M13 mp18, whereas the primer DNA was a DNA provided as a control by the manufacturer of the T7 sequenase version 2.0 DNA sequencing kit. Annealing of the primer/template and the radio-labeling reaction proceeded as indicated in the kit’s instructions with the various Taq polymerase variants added instead of the T7 polymerase (1 μg of each enzyme per reaction). Labeling was then carried out at 60°C for 10 min (for the Klentaq1 polymerase variants singly mutated at position 660) or 15 min [for Klentaq1 containing the F667Y mutation (Taq-FY) or Klentaq1 containing the F667Y mutation as well as the R660D mutation (Taq-FY&RD) or the R660F mutation (Taq-FY&RF)]. Termination reactions were performed by using the following termination mixes: for the polymerase variants singly mutated at position 660, dNTP/ddNTP ratios of 1/25 (final [dNTP] = 40 μM) were used; for Taq-FY, Taq-FY&RD, and Taq-FY&RF, dNTP/ddNTP ratios of 25/1 (final [ddNTP] = 2 μM) were used. These ratios were chosen to generate sequence ladders of optimal length with the various polymerases tested. Incubations for the termination reactions were typically performed at 60°C for 15 min. The reactions were stopped by using the stop solution provided by the manufacturer of the T7 sequenase DNA sequencing kit.
Band Intensity Measurements.
Quantification of gel bands was carried out by using a phosphorimager STORM 840 from Molecular Dynamics. Reported intensities for each band are summations over the whole area of the band, adjusted for background. Intensities were measured in relative fluorescence units. Quantification of all gels started at the sequence GGTCGACTCT near the bottom of the gel. Thus, when intensities are reported as a function of band number, the band number 1 for the G, A, T, and C tracks is the first G, first A, first T, and first C in this sequence, respectively. Trend lines derived from a linear regression fit were drawn through the data, and the goodness-of-fit parameter, R-squared (noted as R2 in the figure legends), was calculated. R-squared is |ΣYobs2 − Σ(Yobs − Ycalc)2|/ΣYobs2, where Yobs and Ycalc represent the observed and fitted values, respectively, for band intensities. An R2 value of 1 indicates a perfect fit.
RESULTS AND DISCUSSION
Crystal Structures of the ddCTP-, ddATP-, ddGTP-, and ddTTP-Trapped Ternary Complexes.
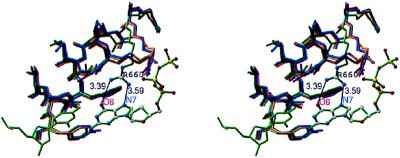
Although most parts of the four complex structures are very similar (details will be published elsewhere), there are significant differences in the conformation of two side chains in the ddGTP-trapped complex relative to the three other complexes (Fig. 1): although the side chain of Arg-660 is not observed interacting with the ddNTP in the ddATP-, the ddCTP-, or the ddTTP-trapped complexes, this side chain interacts with the base of the ddGTP in the ddGTP-trapped complex. The conformational change that affects the Arg-660 side chain in the ddGTP-trapped complex results in the formation of hydrogen-bonding interactions between the tip of its guanidinium group and the O6 and N7 atoms of the G base in the ddGTP. A second side chain, that of Arg-587, also undergoes a conformational change in the ddGTP-trapped complex (result not shown); however, Arg-587 does not contact the ddGTP.
Figure 1.
Stereo diagram of the interactions between the side chain of Arg-660 and the incoming base. In the protein, only the O helix is represented and is colored in red, gold, dark blue, and dark green for the ddCTP-, ddATP-, ddTTP-, and ddGTP-trapped complexes, respectively. In the DNA, only the dCMP/ddGTP pair is represented and is colored in green. H-bond interactions between Arg-660 and the O6 and N7 atoms in the base of the ddGTP are indicated by lines. Distances between atoms involved in H-bonds are indicated.
Kinetic methods have established that ddGTP is incorporated at a faster rate than the other ddNTPs (4). However, the structural basis for this phenomenon has remained unknown. Our structures suggest that the structural basis for higher ddGTP incorporation by the Taq polymerase is the selective interaction of residue 660 with the O6 and N7 atoms of the G base in the incoming ddGTP.
Mutagenesis Study at Position 660 in the Context of the Wild-Type Enzyme.
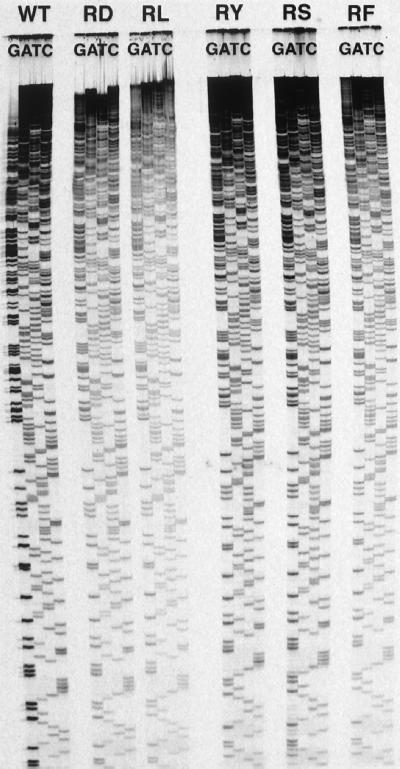
To test whether Arg-660 is the residue responsible for higher rates of ddGTP incorporation, we mutated Arg-660 to a negatively charged residue, Asp, a hydrophobic residue, Leu, a polar residue, Ser, an aromatic polar residue, Tyr, and an aromatic hydrophobic residue, Phe. The activity of the wild-type and mutant Taq DNA polymerases was tested by using DNA sequencing as described in Materials and Methods (Fig. 2). We refer to the wild-type, R660D, R660L, R660S, R660Y, and R660F Klentaq1 polymerase variants as Taq-WT, Taq-RD, Taq-RL, Taq-RS, Taq-RY, and Taq-RF, respectively.
Figure 2.
Comparison of DNA sequencing by Taq-WT, Taq-RD, Taq-RL, Taq-RY, Taq-RS, and Taq-RF. The enzymes used for sequencing are indicated above the corresponding sequences.
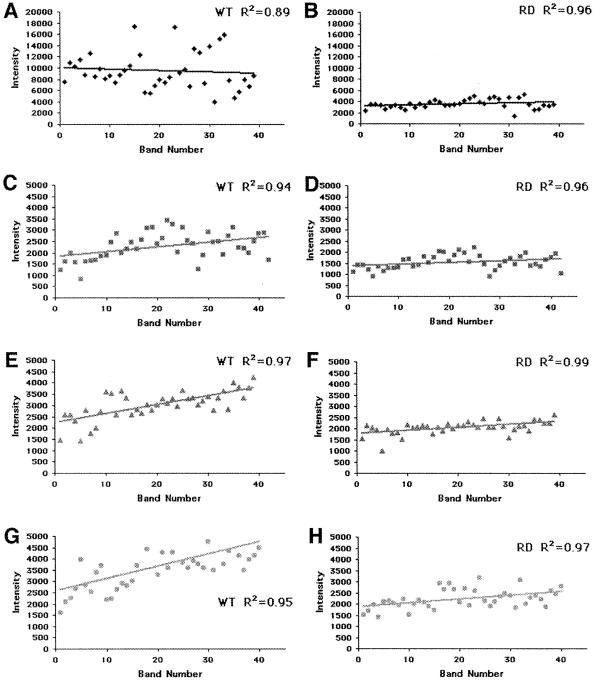
We first compared the G tracks generated by Taq-WT and the various polymerase variants. Each band was quantified by using a phosphorimager, and the intensities were plotted as a function of the band number. As shown in Fig. 3 A and B, the G track in Taq-RD is significantly less intense than in Taq-WT. This observation is consistent with the hypothesis that Taq-RD has a lower rate of ddGTP incorporation than wild type; as a result, ddGTP is incorporated less often, and consequently, the termination reaction occurs statistically less often, resulting in less intense G track DNA bands. Although similar reduction is observed for all other variants, the extent of rate reduction varies: the sharpest reduction is observed for Taq-RF and Taq-RY (65% reduction); reductions in rates of ddGTP incorporation are less sharp for Taq-RS and Taq-RL (50%), whereas Taq-RD has intermediate levels of rate reduction (58%).
Figure 3.
Comparison of band intensities in all tracks resulting from sequencing by Taq-WT and Taq-RD. The intensities (in relative fluorescence units) of bands in each track of the sequencing gel presented in Fig. 2 are reported directly as a function of the band number. (A, C, E, and G) Quantification of bands sequenced by Taq-WT. (B, D, F, and H) Quantification of the bands sequenced by Taq-RD. ♦, ddGTP; ■, ddATP; ▴, ddTTP; ●, ddCTP. The solid line through the data is the result of a linear regression fit through the data points. R2 values are reported for each panel. Because band intensities in the G track generated by Taq-WT are significantly higher than they are in the other tracks, intensity scales in A and B are different from those reported in the other panels.
When quantification is carried out on all other tracks (Fig. 3), it becomes apparent that the effect of mutations at position 660 is uniquely selective to the incorporation of ddGTP. In Fig. 3, the intensities of each band in the G, A, T, and C tracks generated by the Taq-WT and Taq-RD polymerases were plotted directly. Although a dramatic decrease in G track band intensity is observed on usage of Taq-RD (≈65% reduction in intensity), only a modest effect is observed in the A, T, or C tracks (≈7% reduction in intensity). Moreover, the intensities of the G track bands generated by Taq-RD are comparable to those measured for bands in the A, T, and C tracks: thus, sequencing by Taq-RD reduces the intensities of bands in the G track to levels similar to those observed in the A, T, and C tracks. Similar results were obtained with Taq-RS, Taq-RL, Taq-RY, and Taq-RF (results not shown).
A second effect of the decreased rate of ddGTP incorporation is also apparent on examination of the top part of the sequencing gel (Fig. 2). When Taq-WT is used, the G track terminates prematurely; however, when the various polymerase variants are used, the G track extends dramatically. Because Taq-WT incorporates ddGTP faster than the other three ddNTPs, the pool of ddGTP becomes depleted rapidly, resulting in early termination of the G track. This problem can be solved by introducing any of the described mutations at position 660, although the improvement is more significant when Taq-RS, Taq-RY, and Taq-RF are used (Fig. 2).
A comparison of Fig. 3 Right with Fig. 3 Left also reveals that the band intensities are much less variable when sequencing is performed with Taq-RD. This result is immediately apparent on examination of the spread of the intensities on either side of the trend line drawn through the data (Fig. 3): the intensities of bands generated by Taq-RD are more evenly and narrowly distributed along the linear trend line than those from Taq-WT. This effect can be quantified by determining the goodness-of-fit parameter, R2, between the data and the fitted line. In all tracks, the R2 is closer to a value of 1 when sequencing is performed by Taq-RD. This effect is particularly large for the G track [compare Fig. 3A (R2 = 0.89) and Fig. 3B (R2 = 0.96)]. The significant increase in R2 reflects the fact that, although sequencing by Taq-WT may generate G bands of widely different intensities (some of which may not be detectable—whereas some may be so strong that their signals overlap the preceding or subsequent band in the sequence), Taq-RD generates a sequencing pattern in which all bands are uniformly detectable. Hence, the sequencing patterns generated by Taq-RD are improved over those generated by Taq-WT. As indicated in Table 2, all tested mutations at position 660 result in a similar improvement of the sequencing properties of the enzyme.
Table 2.
Comparison of R2 values for sequencing by Taq-WT, Taq-RD, Taq-RS, Taq-RL, Taq-RY, and Taq-RF
| ddNTP |
Taq polymerases
|
|||||
|---|---|---|---|---|---|---|
| WT | RD | RS | RL | RY | RF | |
| ddGTP | 0.89 | 0.97 | 0.96 | 0.95 | 0.94 | 0.96 |
| ddATP | 0.93 | 0.96 | 0.96 | 0.96 | 0.97 | 0.97 |
| ddTTP | 0.98 | 0.99 | 0.98 | 0.97 | 0.96 | 0.98 |
| ddCTP | 0.96 | 0.98 | 0.98 | 0.97 | 0.95 | 0.98 |
These values for R2 result from the quantification of the bands in the G (ddGTP), A (ddATP), T (ddTTP), and C (ddCTP) tracks generated by the various Taq polymerases singly substituted at position 660 (Fig. 3).
Mutagenesis Study at Position 660 in the Context of the F667Y Enzyme.
A Taq polymerase variant that contains a Phe-to-Tyr mutation at position 667 (F667Y) is the most commonly used enzyme for sequencing. However, sequences generated by this enzyme variant are characterized by patterns of uneven band intensities. As shown below, this problem can be solved by introducing mutations at position 660 in addition to the F667Y mutation.
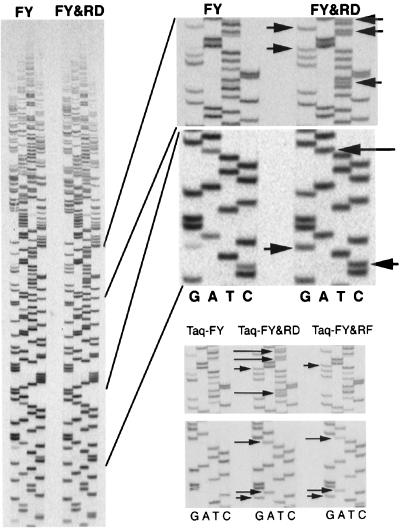
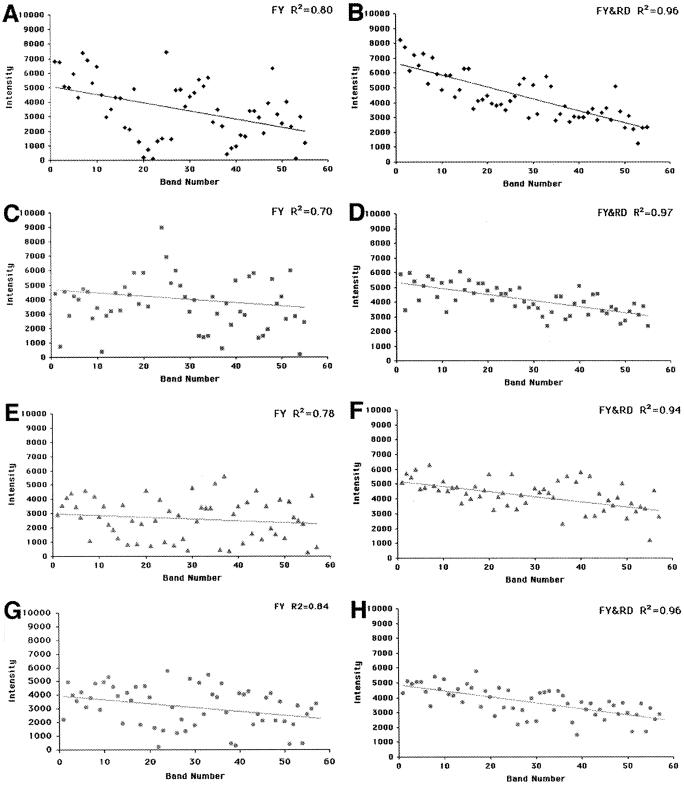
An example of the sequencing obtained with Taq-FY and with a Taq-FY in which Arg-660 has been substituted to Asp (Taq-FY&RD) or Phe (Taq-FY&RF) is shown in Fig. 4. As is immediately apparent, many bands that were weak or potentially undetectable by using Taq-FY are clearly visible when Taq-FY&RD is used. Sequences generated by Taq-FY&RF are also improved; however, the improvement is not as dramatic as for Taq-FY&RD (see Fig. 4 Lower Right).
Figure 4.
DNA sequencing by the Taq-FY, Taq-FY&RD, and Taq-FY&RF polymerases. (Left) The full sequencing gel used to assay Taq-FY and Taq-FY&RD is shown. The two Upper Right panels are zoom-up panels showing details of the sequencing gel at Left. The two Lower Right panels are zoom-up panels of the same regions of a gel on which Taq-FY, Taq-FY&RD, and Taq-FY&RF were assayed. Arrows indicate the location of bands that are detected better when Taq-FY&RD or Taq-FY&RF are used.
Fig. 5 reports the intensities of each band generated during sequencing by Taq-FY (Left) and Taq-FY&RD (Right). As is clear from the R2 values reported and also from visual inspection of the data, the spread of intensities is significantly smaller when Taq-FY&RD is used. This effect is significant at all dNTP/ddNTP ratios tested (result not shown). The larger spread of intensities for sequencing by Taq-FY reflects the fact that, as shown in Fig. 4, a significant number of bands during Taq-FY sequencing have either above or below average intensities; in many cases, these bands are not strong enough to be detected reliably or are so strong that overlaps between bands occur. In contrast, sequencing by Taq-FY&RD does not have such a drawback; all bands have similar intensities.
Figure 5.
Comparison between Taq-FY and Taq-FY&RD. Intensities (in relative fluorescence units) of the bands in the gel presented in Fig. 4 were measured. These values are plotted as a function of band number. (A, C, E, and G) Quantification of bands sequenced by Taq-FY. (B, D, F, and H) Quantification of the bands sequenced by Taq-FY&RD. ♦, ddGTP; ■, ddATP; ▴, ddTTP; ●, ddCTP. The solid line through the data is the result of a linear regression fit through the data points. R2 values are reported for each panel.
CONCLUSION
Efforts aimed at improving the performance of the Taq DNA polymerase have greatly benefited from the structural studies carried out over the last decade on DNA polymerase I enzymes (5). This report provides yet another example as to how structural data can be used to tune the properties of this important enzyme.
Although the effect of mutations at position 660 on the incorporation of ddGTP was predictable from the structures of the ternary trapped complexes, the effect of these mutations on the band-intensity distribution was unexpected. Variability in band intensity is the consequence of variations in the rates of incorporation of dideoxynucleotides caused by the local sequence of the template (9). The mechanistic details that govern sequence context sensitivity are not yet understood. However, the data presented here suggest that the residue located at a position equivalent to Arg-660 of Taq DNA polymerase may be involved in sequence-context recognition. Interestingly, the Klenow enzyme, which is very sensitive to sequence context, and the T7 enzyme, which is less affected by it (9), contain an Arg and an Asp, respectively, at positions equivalent to 660 of Taq DNA polymerase.
The Taq polymerase variants described here constitute improved biotechnological tools: not only is the sequencing of G bases greatly extended, but also, because of a more even band-intensity pattern, the sequencing of all bases is more accurate. In the present era of genome sequencing, the use of Taq DNA polymerases mutated at position 660 will help limit errors and reduce the requirement for redundancy, thereby decreasing cost and labor.
Acknowledgments
We thank W. Barnes for the generous gift of the pWB254 plasmid, as well as K. Fütterer and A. B. Herr for comments on the manuscript. This work was supported by National Institutes of Health Grant GM54033.
ABBREVIATION
- dd-
dideoxy-
Footnotes
Data deposition: The atomic coordinates have been deposited in the Protein Data Bank, www.rcsb.org (PDB ID codes 1QSS, 1QSY, and 1QTM).
Otwinowski, Z. in The CCP 4 Study Weekend: Data Collection and Processing, eds. Sawyers, L., Issacs, N. & Bailey, S. (SERC Daresbury Lab., Warrington, U.K.), pp. 56–62.
References
- 1.Saiki R K, Gelfand D H, Stoffel S, Scharf S J, Higuchi R, Horn G T, Mullis K B, Erlich H A. Science. 1988;239:487–491. doi: 10.1126/science.2448875. [DOI] [PubMed] [Google Scholar]
- 2.Innis M A, Myambo K B, Gelfand D H, Brow M A D. Proc Natl Acad Sci USA. 1988;85:9436–9440. doi: 10.1073/pnas.85.24.9436. [DOI] [PMC free article] [PubMed] [Google Scholar]
- 3.Lee L G, Connell C R, Woo S L, Cheng R D, McArdie B F, Fuller C W, Halloran N D, Wilson R K. Nucleic Acids Res. 1992;20:2471–2483. doi: 10.1093/nar/20.10.2471. [DOI] [PMC free article] [PubMed] [Google Scholar]
- 4.Brandis J W, Edwards S G, Johnson K A. Biochemistry. 1996;35:2189–2200. doi: 10.1021/bi951682j. [DOI] [PubMed] [Google Scholar]
- 5.Tabor S, Richardson C C. Proc Natl Acad Sci USA. 1995;92:6339–6343. doi: 10.1073/pnas.92.14.6339. [DOI] [PMC free article] [PubMed] [Google Scholar]
- 6.Li Y, Korolev S V, Waksman G. EMBO J. 1998;17:7514–7525. doi: 10.1093/emboj/17.24.7514. [DOI] [PMC free article] [PubMed] [Google Scholar]
- 7.Brünger A T, Adams P D, Clore G M, DeLano W L, Gros P, Grosse-Kunstleve R W, Jiang J S, Kuszewski J, Nilges M, Pannu N S, et al. Acta Crystallogr D. 1998;54:905–921. doi: 10.1107/s0907444998003254. [DOI] [PubMed] [Google Scholar]
- 8.Hodel A, Kim S-H, Brünger A T. Acta Crystallogr A. 1992;48:851–858. [Google Scholar]
- 9.Fuller C W. Methods Enzymol. 1992;216:329–354. doi: 10.1016/0076-6879(92)16031-e. [DOI] [PubMed] [Google Scholar]


