

Abstract
The differential susceptibility of inbred mouse strains DBA/2J (susceptible) and C57BL/6J (resistant) to pulmonary tuberculosis following aerosol infection is under complex genetic control. In this report, transcriptional profiling with RNAs from Mycobacterium tuberculosis-infected lungs was used to investigate the physiological response, cell type, and biochemical pathways underlying differential susceptibility to infection. Statistical analysis of cDNA-based microarrays revealed that 1,097 transcripts showed statistically significant changes in abundance (changes of ≥1.5-fold) in at least one of four experimental group comparisons (C57BL/6J [day 0] versus DBA/2J [day 0] mice, C57BL/6J [day 90] versus DBA/2J [day 90] mice, C57BL/6J [day 90] versus C57BL/6J [day 0] mice, or DBA/2J [day 90] versus DBA/2J [day 0] mice). A group of genes showing very high degrees of significance (changes of ≥2.0-fold) displayed enrichment for transcripts associated with tissue remodeling and the fibrotic response. The differential expression of fibrotic response genes (Sparc, Col1a1, Col1a2, Col4a1, and Col4a2) in the infected lungs of the two mouse strains was validated by another microarray platform (Affymetrix oligonucleotide chips) and by reverse transcription-PCR. Furthermore, the differential expression of additional genes known to be associated with fibrosis (Mmp2, Timp1, and Arg1) was also validated by these approaches. Overall, these results identify the differential fibrotic response as a pathological basis for the high susceptibility of DBA/2J mice to pulmonary tuberculosis.
Tuberculosis is caused by aerosol infection with the bacterial pathogen Mycobacterium tuberculosis. Although M. tuberculosis can infect and replicate in several organs, tuberculosis is almost exclusively a pulmonary disease. Tuberculosis still remains a global health problem of enormous proportions, with 32% of the world's population believed to be or have been infected (44) and with an estimated 8 million new cases of active disease per year (43) and 1 to 1.5 million deaths annually. Globally, migration of populations from countries where the disease is endemic, human immunodeficiency virus infection, poverty, unemployment, homelessness, overcrowding, and population aging contribute to the spread of tuberculosis in developed countries (30). Moreover, the emergence of multidrug resistance also represents an increasing threat to tuberculosis control (48).
Although the majority of people infected with M. tuberculosis remain asymptomatic, 5 to 10% of them have a lifetime risk of developing active disease. Genetic factors have long been thought to play a role in the onset, progression, and ultimate outcome of infection with M. tuberculosis (18). These include epidemiological data pointing to sex (11, 32) and racial (39) differences in susceptibility, as well as the geographical distribution and familial aggregation of disease (2). In addition, population studies in areas where the disease is endemic and during first-contact epidemics (24, 38), together with studies of twins (6), have clearly established a genetic component of susceptibility to tuberculosis in humans.
The complex genetic component of susceptibility to tuberculosis is inherently difficult to determine for humans but can be studied with mouse models of infection (see reference 25 for a recent review). In the mouse, M. tuberculosis introduced via aerosol is taken up by phagocytes but survives intracellularly by inhibiting phagolysosome fusion (33); dendritic cells migrate to peripheral lymph nodes to prime T cells, which then migrate to the lungs to initiate the formation of granulomas composed of macrophages, lymphocytes, and epithelial cells. Macrophages secrete interleukin-12 (IL-12) and IL-23 to activate a T-lymphocyte response (polarization of the Th1 phenotype). On the other hand, CD4+ and CD8+ T cells recognize bacterial antigens presented by phagocytes in association with class II and class I major histocompatibility complex molecules, respectively, and secrete type I cytokines, most importantly gamma interferon and tumor necrosis factor alpha, that result in macrophage activation. Activated macrophages produce a variety of bacteriostatic and bactericidal species, such as reactive oxygen radicals, nitric oxide, and iron chelators (lactoferrin), but also display increased maturation of M. tuberculosis phagosomes, including increased acidification, and delivery of lysosomal enzymes. T cells also produce perforin and granulysin, which contribute to microbicidal activity (reviewed in references 13 and 25). Finally, there is active remodeling of the lung during pulmonary tuberculosis, including tissue fibrosis. Although this process remains poorly understood, it is an important determinant of the ultimate outcome of infection (survival or death).
The efficacy of the host response to pulmonary tuberculosis is under complex genetic control in the mouse, with a broad spectrum of disease severities observed among different strains. Genetic analyses have located a number of tuberculosis susceptibility loci (15, 17, 22, 23, 34, 35, 47). Inbred strains have been classified as highly susceptible (CBA, C3H, DBA/2, and 129SvJ) or highly resistant (C57BL/6J and BALB/c) to intravenous or aerosol infection with M. tuberculosis (20, 21). Differential pulmonary growth of M. tuberculosis in C57BL/6J and DBA/2J mice is associated with dramatic differences in histopathology starting at 3 to 4 weeks postinfection. In susceptible DBA/2J mice, there is unrestricted pulmonary microbial replication, a massive inflammatory response in situ, and early death, with a mean survival time (MST) of 110 days. Resistant C57BL/6J mice can control the infection, but they ultimately succumb, with an MST of 245 days (21). Similar results were also obtained by intravenous infection (1 × 10⁵ CFU) of DBA/2J (MST of 105 days) and C57BL/6J (MST of 240 days) mice (22). Mapping studies by whole-genome scanning of informative [C57BL/6J × DBA/2J] F2 mice, using survival time and pulmonary microbial load as phenotypic markers of susceptibility (22, 23), detected four loci (Trl1 to Trl4) that regulate the extent of pulmonary replication of M. tuberculosis and/or survival following infection. A strong genetic interaction was detected between Trl3 and Trl4, with two-locus linkage analysis yielding a logarithm of odds of 10.09, explaining 38% of the variation in raw CFU. Remarkably, F2 mice homozygous for C57BL/6J alleles at both Trl3 and Trl4 were as resistant as C57BL/6J parents, whereas mice homozygous for DBA/2J alleles were as susceptible as DBA/2J parents (23).
For the present report, we investigated the cellular and molecular bases of the differential susceptibility to infection with M. tuberculosis of C57BL/6J and DBA/2J mice. We used RNAs isolated from the lungs of control and M. tuberculosis-infected mice to conduct transcript profiling studies, with the aim of identifying genes and pathways differentially regulated in response to M. tuberculosis in genetically resistant and susceptible mice. Expression differences were validated by reverse transcriptase PCR (RT-PCR) and by examining additional gene and protein members of identified pathways. Our results suggest that susceptible mice develop an enhanced tissue remodeling response, leading to lung fibrosis, compared to that of the resistant strain.
MATERIALS AND METHODS
Animals.
Inbred, pathogen-free C57BL/6J and DBA/2J male mice were purchased from the Trudeau Institute Animal Breeding Facility. All mice were housed under standard laboratory conditions and were free of common viral pathogens according to the results of routine testing performed by the Research Animal Diagnostic and Investigative Laboratory, University of Missouri (Columbia, MO). Mice of between 8 and 10 weeks of age were used for infection.
Infection with M. tuberculosis.
M. tuberculosis strain H37Rv was obtained from the Trudeau Mycobacterial Culture Collection as a frozen (−70°C) log-phase stock dispersed in Proskauer and Beck medium (Difco) containing 0.01% Tween 80. For the experiment, a vial was thawed, subjected to 5 s of ultrasound to break up aggregates, and diluted appropriately in phosphate-buffered saline containing 0.01% Tween 80. Mice were inoculated with 102 CFU by the aerosol route in a Middlebrook airborne infection apparatus (Tri Instruments, Jamaica, NY). Bacilli in the lungs of infected mice at 90 days postinfection were enumerated by preparing lung homogenates in phosphate-buffered saline containing 0.05% Tween 80 and by plating 10-fold serial dilutions of the homogenates on enriched agar (Middlebrook 7H11; Difco). CFU counts were performed after 3 to 4 weeks of incubation at 37°C, and the data are presented as log10 total CFU count per lung.
Histology.
Lungs were fixed by intratracheal infusion in 10% formaldehyde followed by immersion of the lungs in this fixative for 24 h at room temperature. After being washed, the lungs were dehydrated in 70% and 100% ethanol and embedded in wax according to standard procedures. Sections of 6 μm in thickness were cut with a rotary microtome, and after being dewaxed, the sections were stained for acid-fast bacteria by use of a modified basic fuchsin stain (9) and were counterstained with methylene blue. Photomicrographs were taken with a Nikon Microphot-Fx microscope fitted with a Spot RT Slider camera (Diagnostic Instruments, Sterling Heights, MI) using Spot RT software for image acquisition.
Transcriptional profiling studies.
Uninfected control and M. tuberculosis-infected C57BL/6J and DBA/2J mice were sacrificed; their lungs were harvested and rapidly homogenized in TRI reagent (Sigma), using a Polytron device. Total RNA was extracted according to the manufacturer's recommendations, and the integrity of the RNA was verified by electrophoresis on a 1% agarose gel containing formaldehyde. For cDNA labeling, 20 μg of total RNA was converted into cDNA by using RT (Super Script II; Invitrogen) and either Cy5- or Cy3-labeled dCTP (1 mM; Perkin-Elmer-Cetus/NEN) in a reaction mixture containing 1.5 μl oligo(dT) (100 pmol μl−1), 3 μl dNTP-dCTP (6.67 mM [each]), 1 μl dCTP (2 mM), 4 μl dithiothreitol (100 mM), and 8 μl 5× RT buffer (Invitrogen). The reactions were carried out at 42°C for 3 h, and the RNA was then degraded by the addition of 0.5 μl RNase A (1 μg μl−1) and 1.5 μl RNase H (5 units μl−1). Labeled cDNA was separated from unincorporated nucleotides and further concentrated by evaporation under vacuum. Labeled cDNA was then used to hybridize mouse 15k v.3 cDNA spotted arrays, purchased from the UHN Microarray Facility (http://www.microarrays.ca), containing 15,250 expressed sequence tags (NIA clone set) spotted in duplicate. Briefly, the arrays were prehybridized for 1 to 2 h with DIGEasy hybridization buffer (Roche) containing 10 μg ml−1 denatured salmon sperm DNA and 10 μg ml−1 yeast tRNA. Cy5- and Cy3-labeled cDNAs were combined and hybridized in the same medium and incubated with the arrays for 16 to 18 h at 37°C. Finally, the arrays were washed three times for 10 min each with 0.1× saline sodium citrate (SSC; 20× SSC is 3 M sodium chloride, 0.3 M sodium citrate, pH 7.0) and 0.1% sodium dodecyl sulfate (SDS) at 50°C and four times for 3 min each with 0.1× SSC at room temperature and then dried by centrifugation under vacuum. Slides were then scanned, digitized images were acquired using a ScanArray 5000 instrument (Perkin-Elmer), and the intensities of individual spots from 16-bit TIFF images were quantified using the QuantArray software package (Perkin-Elmer).
Microarray data analysis.
Raw data generated by QuantArray (Perkin-Elmer) were normalized using the GeneSpring (version 6.1.1) software package (Silicon Genetics), using the Lowess scatter smoothing algorithm. Analysis consisted of six dye-swap hybridizations for each experimental group (uninfected C57BL/6J versus uninfected DBA/2J mice, infected C57BL/6J versus infected DBA/2J mice, infected C57BL/6J versus uninfected C57BL/6J mice, and infected DBA/2J versus uninfected DBA/2J mice). Lungs from individual mice were used for each biological replicate (six per group). Genes with significant changes in transcript abundance were first selected with a t test and a Benjamini and Hochberg false discovery rate (FDR) below 0.05%. To further reduce the number of genes in the lists, we also applied different cutoffs (1.5- or 2-fold change).
Semiquantitative RT-PCR.
RNA samples (three of six per experimental group) used for transcriptional profiling were pooled together; 3 μg was reverse transcribed (Moloney murine leukemia virus RT; Invitrogen) in 20 μl, and 1 μl (5% of the first-strand reaction) was used for PCR. PCR amplification with Taq DNA polymerase (Invitrogen) included an initial denaturation step (3 min at 94°C) followed by 16 to 26 cycles (30 s at 94°C, 30 s at 55°C, and 1 min at 72°C) and a final elongation step (7 min at 72°C). A large range of PCR cycles was used to determine the exponential phase of amplification, allowing for semiquantitative analysis of each reaction. Amplicons (ranging from 277 to 500 bp) were resolved in 1% agarose gels and transferred to GeneScreenPlus membranes (Dupont, NEN Research Products). PCR primers were designed according to the reported gene sequences. The Gapdh gene was used as a constitutively expressed control gene to verify the mRNA levels of target genes. After transfer, DNA was UV cross-linked and prehybridized for at least 4 h at 65°C in a solution of 10% dextran sulfate, 1% SDS, and 1 M NaCl with 200 μg ml−1 of salmon sperm DNA. Hybridization was then performed overnight at 65°C with an [α-32P]dATP-labeled specific DNA fragment (100,000 cpm/ml of buffer) previously amplified for each target gene. After incubation, the membrane was washed two times with 2× SSC-0.1% SDS (15 min per wash, 42°C), once with 2× SSC-0.5% SDS (30 min, 65°C), and once with 0.5× SSC-0.5% SDS (30 min, 65°C). The intensities of the radioactive signals on the membranes were acquired using a phosphorimager (FX molecular imager) and quantified using Quantity One software (Bio-Rad).
RESULTS
Different replication of M. tuberculosis in the lungs of C57BL/6J and DBA/2J mice.
C57BL/6J and DBA/2J mice were infected by the aerosol route with 102 CFU of the highly virulent human strain M. tuberculosis H37Rv. Ninety days later, the lungs were harvested and the number of viable bacilli (CFU) was determined (Fig. 1A). In this representative experiment, a 100-fold difference was observed in CFU counts recovered from C57BL/6J and DBA/2J mice (Fig. 1A). Visual examination of the lungs at the time of sacrifice revealed obvious differences, with the infected DBA/2J lungs appearing larger, with larger and much more diffuse lesions than those seen in resistant C57BL/6J lungs (Fig. 1B). Further histological examination confirmed the larger number and more diffuse aspects of lesions throughout the DBA/2J lungs, with a greater proportion of the lung tissue affected than that for C57BL/6J lungs. Each lesion was seen as an area of exudative, necrotic alveolitis in which contiguous air sacs were swollen and filled with degenerating neutrophils replete with acid-fast bacilli (Fig. 1C). In contrast, the histological appearance of C57BL/6J lungs was strikingly different, with small lesions that consisted of areas of alveolitis populated predominantly by macrophages and lymphocytes and associated with large aggregates of lymphoid cells. Moreover, even if some of the macrophages contained acid-fast bacilli, the lesions contained relatively few bacilli (Fig. 1C).
FIG. 1.
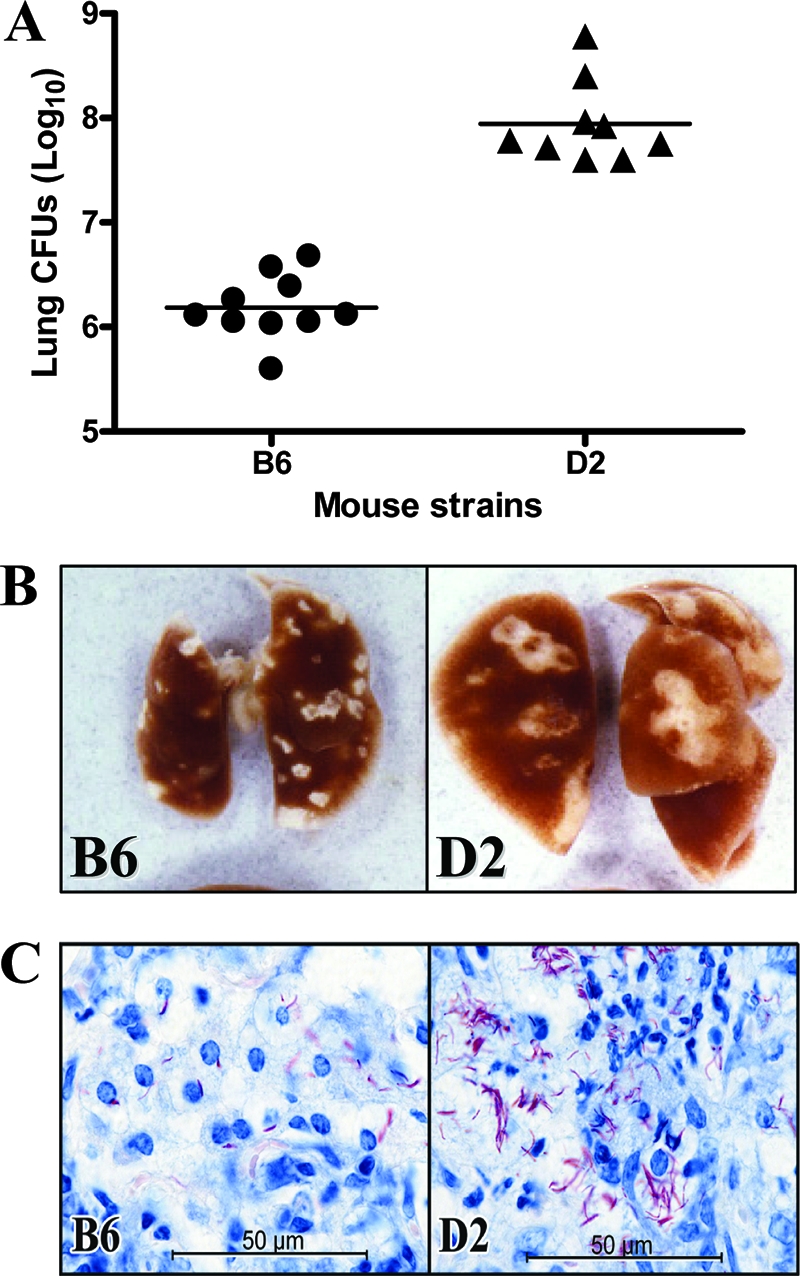
Replication of M. tuberculosis in the lungs of C57BL/6J and DBA/2J mice. (A) Resistant C57BL/6J and susceptible DBA/2J mice were infected via the aerosol route with 102 M. tuberculosis H37Rv bacilli, and the number of M. tuberculosis bacilli were enumerated in the lungs (log10 CFU) at 90 days postinfection. Horizontal bars represent means of CFU counts for each group. (B) Macroscopic examination of the lungs of C57BL/6J and DBA/2J mice 90 days after aerosol infection. (C) High-power micrographs of day 90 lung lesions of C57BL/6J and DBA/2J mice, showing the presence of a much larger number of acid-fast bacilli in the DBA/2J lesion. The C57BL/6J lesion is populated predominantly by macrophages, whereas the DBA/2J lesion is populated predominately by neutrophils undergoing degeneration.
Transcriptional profiling of C57BL/6J and DBA/2J mice.
To gain insight into the host cell types and cellular and molecular pathways possibly involved in the differential permissiveness of the C57BL/6J and DBA/2J lungs to replication of M. tuberculosis, we used transcript profiling with cDNA microarrays to detect changes in lung transcript abundance in resistant (C57BL/6J) and susceptible (DBA/2J) mice following a 90-day M. tuberculosis aerosol challenge. We compared transcript profiles between C57BL/6J and DBA/2J mice either prior to (day 0) or 90 days following M. tuberculosis infection. In addition, gene expression on day 90 was compared to that on day 0 (day 90 versus day 0) for each strain to establish a strain-specific ratio. This ratio was then used for interstrain comparison. The average expression ratios for all experimental groups (Fig. 2A) were obtained from six independent pairwise hybridizations (total of 24 microarrays). In order to verify the quality of our data set and to visualize similarities between experimental groups (pairwise hybridizations), we used principal component analysis (PCA). As illustrated in Fig. 2B, clustering by PCA divided the experiment into four clearly nonoverlapping groups, indicating homogeneity of the data within each group, with no significant outliers. PCA also showed a greater similarity of the day 90 versus day 0 comparisons for both strains (arbitrarily coded in yellow and green), whereas greater overall differences were seen for interstrain comparisons at each time point (coded in red and blue).
FIG. 2.

Transcriptional response in the lungs following M. tuberculosis infection. (A) A closed-loop strategy was applied to monitor differences in transcript abundance between lungs (n = 6) from either C57BL/6J or DBA/2J strains either prior to (t = 0) or 90 days following infection with M. tuberculosis. Each arrow represents two microarray hybridizations, including dye swaps. The fluorescence ratios between lung pairs were averaged prior to analysis. (B) The transcriptional profiles from each lung comparison were used in a PCA to separate them in a two-dimensional space according to the similarities in their most discriminating profiles. (C) A total of 1,097 genes with statistically significant changes in transcript abundance of at least 1.5-fold were organized by two-dimensional hierarchical clustering and colored according to the difference in abundance between each lung pair (more abundant transcripts are shown in red, and less abundant transcripts are shown in green). Dendrograms are used to illustrate the profile similarities between groups of genes or lung pairs. Clusters of differentially expressed genes are labeled A to D (see Results).
A total of 1,097 transcripts showed statistically significant changes in abundance (t test P value, <0.05; change, ≥1.5-fold) in at least one of the four experimental groups (multiple testing correction; Benjamini and Hochsberg FDR, 0.05%). A two-dimensional hierarchical clustering was used to organize and visualize the profiles of these transcripts for each pair of hybridizations in the four comparative experimental groups (Fig. 2C, x axis). In agreement with the PCA results (Fig. 2B), this clustering analysis showed a high degree of homogeneity between individual hybridizations in each experimental group, indicative of a robust and reproducible data set. In this analysis, few interstrain differences were noted in transcript profiles obtained from lungs of uninfected animals (C57BL/6J versus DBA/2J mice; t = 0), suggesting only a modest effect of genetic background on baseline pulmonary gene expression. In contrast, infection with M. tuberculosis resulted in a dramatic change in lung transcript profiles at 90 days for both C57BL/6J and DBA/2J mice. Transcript responses appeared similar for both experimental groups (C57BL/6J mice, day 90 versus day 0; DBA/2J mice, day 90 versus day 0) (Fig. 2C), raising the possibility that differences in expression of only a small number of genes/transcripts may account for the differential susceptibility to tuberculosis of C57BL/6J and DBA/2J mice.
Despite extensive similarity in transcript profiles detected for the two strains following infection, we detected four clusters of transcripts (identified as clusters A, B, C, and D in Fig. 2C) that were differentially expressed in C57BL/6J and DBA/2J mice following infection. These four clusters were initially identified by comparing lists of intrastrain transcripts modulated by infection (C57BL/6J mice [day 90 versus day 0] versus DBA/2J mice [day 90 versus day 0]) and were further validated by interstrain comparison of day 90 transcript profiles (C57BL/6J mice on day 90 versus DBA/2J mice on day 90). Cluster A transcripts (n = 349) were substantially more up-regulated in DBA/2J mice than in C57BL/6J mice in response to infection (detected as less expression by direct comparison of C57BL/6J versus DBA/2J mice at day 90). Conversely, cluster B transcripts (n = 58) were more up-regulated in C57BL/6J mice than in DBA/2J mice (confirmed by direct comparison of C57BL/6J versus DBA/2J mice at day 90). Cluster C transcripts (n = 213) were more down-regulated in DBA/2J mice than in C57BL/6J mice, while cluster D transcripts (n = 24) were more down-regulated in C57BL/6J mice than in DBA/2J mice. Clusters A, B, C, and D contained 84, 39, 131, and 15 known genes, respectively (data not shown). Gene ontology studies on these known genes separated cluster A transcripts into five categories, including RNA binding, proteinase inhibitors, transport, regulation of metabolism, and response to a biotic stimulus (Table 1). Cluster B was composed of ribosomal proteins and genes associated with a response to stimuli (Table 1). Transcripts in cluster C had a biased representation with respect to proteins involved in cell adhesion, extracellular matrix, actin binding, and receptors (Table 2). Finally, the majority of transcripts in cluster D were genes involved in extracellular matrix remodeling, such as Lamc1, Sparc, and several procollagen genes (Table 2).
TABLE 1.
Partial list of genes differentially expressed in clusters A and B
| Gene | Fold change in gene expressiona
|
GenBank accession no. | Description | |||
|---|---|---|---|---|---|---|
| C57BL/6J vs DBA/2J mice (day 0) | C57BL/6J vs DBA/2J mice (day 90) | C57BL/6J mice (day 90 vs day 0) | DBA/2J mice (day 90 vs day 0) | |||
| Cluster A | ||||||
| RNA binding proteins | ||||||
| Rbm12 | 1.04 | 0.66* | 2.10* | 3.86* | AU018168 | RNA binding motif protein 12 |
| Rnaset2 | 1.07 | 0.70* | 1.99* | 2.81* | C79750 | RNase T2 |
| Oas1c | 1.12 | 0.75 | 1.42* | 1.80* | C87369 | 2′-5′-Oligoadenylate synthetase 1C |
| G3bp | 1.01 | 0.93 | 1.53* | 1.66* | AW537231 | Ras-GTPase-activating protein, SH3 domain binding protein |
| Eral1 | 0.99 | 0.70* | 1.16 | 1.59* | AU019798 | Era (G-protein)-like 1 (Escherichia coli) |
| Oas1d | 1.03 | 0.83 | 1.37* | 1.52* | AU024119 | 2′-5′-Oligoadenylate synthetase 1D |
| Proteinase inhibitors | ||||||
| Serpinb9 | 1.07 | 0.76 | 1.85 | 2.67* | AW543445 | Serine (or cysteine) proteinase inhibitor, clade B, member 9 |
| Serping1 | 1.19 | 0.64* | 1.46 | 2.44* | AW556710 | Serine (or cysteine) proteinase inhibitor, clade G, member 1 |
| Serpinb9b | 1.08 | 0.71 | 1.52* | 1.99* | AW538480 | Serine (or cysteine) proteinase inhibitor, clade B, member 9b |
| Serpinb9c | 1.09 | 0.73 | 1.58 | 1.67* | AW538390 | Serine (or cysteine) proteinase inhibitor, clade B, member 9c |
| Transport proteins | ||||||
| Lcn2 | 1.38 | 0.70 | 8.32* | 17.52* | AU014847 | Lipocalin 2 |
| Snx10 | 1.05 | 0.87 | 2.03* | 2.93* | AW544893 | Sorting nexin 10 |
| Tap2 | 1.00 | 0.70* | 1.82* | 2.47* | AU043081 | Transporter 2, ATP-binding cassette, subfamily B (MDR/TAP) |
| Gatm | 0.92 | 0.62* | 1.71 | 2.28* | AW552902 | Glycine amidinotransferase (l-arginine:glycine amidinotransferase) |
| Tcirg1 | 1.05 | 0.85 | 1.75* | 2.12* | AW538198 | T-cell, immune regulator 1 |
| Txn1 | 1.11 | 0.95 | 1.56* | 1.67* | AW550880 | Thioredoxin 1 |
| Rgs12 | 1.00 | 0.71 | 1.06 | 1.60* | AU019352 | Regulator of G protein signaling 12 |
| Slc16a3 | 0.88 | 0.63* | 1.34 | 1.55* | AW536253 | Solute carrier family 16 (monocarboxylic acid transporters), member 3 |
| Regulation of metabolism | ||||||
| Socs3 | 1.11 | 0.79 | 1.85* | 2.26* | AW538538 | Suppressor of cytokine signaling 3 |
| Atf3 | 1.01 | 0.83 | 1.89* | 2.10* | C86078 | Activating transcription factor 3 |
| Tbx20 | 1.01 | 0.92 | 1.27 | 2.06* | AU019142 | T box 20 |
| Litaf | 1.03 | 0.78 | 1.43* | 1.88* | AU041939 | Lipopolysaccharide-induced TN factor |
| Stat2 | 1.01 | 0.87 | 1.67* | 1.87* | AU019391 | Signal transducer and activator of transcription 2 |
| Zfhx1b | 1.13 | 0.85 | 1.14 | 1.68* | AW554605 | Zinc finger homeobox 1b |
| Response to biotic stimulus | ||||||
| C1s | 1.05 | 0.54* | 2.14* | 4.05* | AU018982 | Complement component 1, s subcomponent |
| C1r | 0.84 | 0.65 | 2.29* | 2.86* | AW553572 | Complement component 1, r subcomponent |
| Clu | 1.25 | 0.68* | 1.55* | 2.56* | AU041878 | Clusterin |
| Ly6e | 1.02 | 0.89 | 1.45 | 1.81* | AW536803 | Lymphocyte antigen 6 complex, locus E |
| Ikbke | 1.03 | 0.82 | 1.38 | 1.72* | AW558201 | Inhibitor of κB kinase ɛ |
| Tnip1 | 0.90 | 0.60* | 1.33* | 1.64 | AU018810 | TNFAIP3 interacting protein 1 |
| Nalp6 | 0.92 | 0.75* | 1.43* | 1.62* | C78607 | NACHT, leucine-rich repeat and PYD containing 6 |
| Exo1 | 0.95 | 0.75 | 1.20 | 1.58* | AU023421 | Exonuclease 1 |
| Tirap | 1.00 | 0.82 | 1.48 | 1.54* | AW537400 | Toll-interleukin 1 receptor (TIR) domain-containing adaptor protein |
| Ptges | 1.04 | 0.68* | 1.29* | 1.53* | C81414 | Prostaglandin E synthase |
| Other categories | ||||||
| Igtp | 1.16 | 0.53* | 7.18* | 13.22* | AW558444 | Gamma interferon-induced GTPase |
| Mlp | 0.96 | 0.51* | 1.64* | 3.14* | AW536807 | MARCKS-like protein |
| Ly6a | 1.11 | 0.84 | 1.99* | 3.03* | AW546921 | Lymphocyte antigen 6 complex, locus A |
| Tnfaip2 | 1.04 | 0.47 | 2.07* | 2.89* | C76826 | Tumor necrosis factor alpha-induced protein 2 |
| Icam1 | 0.96 | 0.57* | 1.73* | 2.75* | C86961 | Intercellular adhesion molecule |
| Igsf8 | 0.95 | 0.76 | 1.45* | 1.63* | AU041109 | Immunoglobulin superfamily, member 8 |
| Cluster B | ||||||
| Ribosomal proteins | ||||||
| Rpl39 | 1.00 | 1.22 | 1.78* | 1.31 | AU041461 | Ribosomal protein L39 |
| Rps18 | 0.87 | 1.27* | 1.75* | 1.13 | AA409352 | Ribosomal protein S18 |
| Rpl12 | 0.90 | 1.23* | 1.71* | 1.16 | AU020239 | Ribosomal protein L12 |
| Rps7 | 0.99 | 1.27 | 1.63* | 1.18 | AW549691 | Ribosomal protein S7 |
| Rps15a | 0.92 | 1.40 | 1.62* | 1.17 | AW536982 | Ribosomal protein S15a |
| Rpl19 | 0.94 | 1.15 | 1.59* | 1.27 | AW546273 | Ribosomal protein L19 |
| Rps11 | 1.04 | 1.31* | 1.58* | 1.22 | AW538647 | Ribosomal protein S11 |
| Lamr1 | 1.02 | 1.10* | 1.57 | 1.12 | AW547047 | Laminin receptor 1 (ribosomal protein SA) |
| Rps5 | 0.91 | 1.18* | 1.56 | 1.05 | AW546168 | Ribosomal protein S5 |
| Rpl13a | 1.13 | 1.22 | 1.56* | 1.18 | AA408475 | Ribosomal protein L13a |
| Rps20 | 0.94 | 1.22 | 1.55* | 1.19 | AU015183 | Ribosomal protein S20 |
| Rpl10a | 0.92 | 1.21* | 1.53 | 1.08 | AW547244 | Ribosomal protein L10A |
| Rpl32 | 0.93 | 1.23* | 1.52* | 1.13 | AW556391 | Ribosomal protein L32 |
| Response to stimulus | ||||||
| Igh-6 | 1.18 | 4.68* | 7.76* | 1.73 | AU015491 | Immunoglobulin heavy chain 6 (heavy chain of immunoglobulin M) |
| Hexb | 0.90 | 1.26* | 2.20* | 1.51* | AU020105 | Hexosaminidase B |
| Man2b1 | 1.20 | 1.47* | 1.79* | 1.33* | C78951 | Mannosidase 2, alpha B1 |
| Ifi30 | 1.04 | 1.27* | 1.78* | 1.44* | C78584 | Gamma interferon-inducible protein 30 |
| Blnk | 1.05 | 1.33* | 1.73* | 1.42* | C87337 | B-cell linker |
| Lsp1 | 1.12 | 1.43* | 1.67 | 1.22 | AW556898 | Lymphocyte-specific protein 1 |
Genes with significant changes in transcript abundance (≥1.5-fold change) in at least one of the four experimental groups, selected by a t test and by having a Benjamini and Hochberg FDR of <0.05%. *, genes with significant changes in transcript abundance (≥1.5-fold change), selected by a t test and by having a Benjamini and Hochberg FDR of <0.05%. Genes with significant changes in transcript abundance (≥2-fold change) in at least one of the last two experimental groups are shown in bold.
TABLE 2.
Partial list of genes differentially expressed in clusters C and D
| Gene | Fold change in gene expressiona
|
GenBank accession no. | Description | |||
|---|---|---|---|---|---|---|
| C57BL/6J vs DBA/2J mice (day 0) | C57BL/6J vs DBA/2J mice (day 90) | C57BL/6J mice (day 90 vs day 0) | DBA/2J mice (day 90 vs day 0) | |||
| Cluster C | ||||||
| Cell adhesion proteins | ||||||
| Cd97 | 1.01 | 1.16 | 0.61 | 0.55* | AU040710 | CD97 antigen |
| Catna1 | 0.93 | 1.05 | 0.63* | 0.54* | AW544339 | Catenin alpha 1 |
| Cdh5 | 1.11 | 1.34* | 0.41* | 0.35* | AW543698 | Cadherin 5 |
| Extracellular matrix proteins | ||||||
| Adamts1 | 0.99 | 1.31 | 0.72 | 0.63* | C76514 | Disintegrin-like and metalloprotease with thrombospondin type 1 motif 1 |
| Timp2 | 1.11 | 1.12 | 0.60 | 0.52* | AW557582 | Tissue inhibitor of metalloproteinase 2 |
| Gpc3 | 0.92 | 1.56 | 0.65 | 0.42* | AW536960 | Glypican 3 |
| Actin-binding proteins | ||||||
| C76867 | 0.94 | 1.06 | 0.69 | 0.62* | C76867 | Tropomyosin 1, alpha |
| Flna | 0.99 | 1.06 | 0.71 | 0.60* | AW557788 | Filamin, alpha |
| Macf1 | 1.02 | 1.45* | 0.68 | 0.59* | AW551643 | Microtubule-actin cross-linking factor 1 |
| Epb4.1l2 | 1.01 | 1.38* | 0.65* | 0.57 | AW555191 | Erythrocyte protein band 4.1-like 2 |
| Myo1b | 1.03 | 1.31 | 0.56* | 0.51* | AA406997 | Myosin IB |
| Tpm1 | 0.98 | 1.16 | 0.55 | 0.43* | AW548270 | Tropomyosin 1, alpha |
| Spnb2 | 1.09 | 1.43* | 0.49* | 0.42* | AW538829 | Spectrin beta 2 |
| Spna2 | 1.01 | 1.27* | 0.54* | 0.41* | AW548154 | Spectrin alpha 2 |
| Gsn | 1.08 | 2.21* | 0.37* | 0.21* | AW548858 | Gelsolin |
| Receptors | ||||||
| Nr3c1 | 0.95 | 1.30* | 0.78 | 0.66 | AW556220 | Nuclear receptor subfamily 3, group C, member 1 |
| Il6st | 1.05 | 1.28* | 0.72 | 0.65* | AU016341 | Interleukin 6 signal transducer |
| Ptprd | 1.03 | 1.27* | 0.73 | 0.65* | AW551696 | Protein tyrosine phosphatase, receptor type, D |
| Igf2r | 0.97 | 1.03 | 0.72 | 0.64* | AW556534 | Insulin-like growth factor 2 receptor |
| Itga6 | 0.98 | 1.16 | 0.64 | 0.56* | AW556992 | Integrin alpha 6 |
| Pgrmc1 | 0.95 | 1.34* | 0.64 | 0.52* | AW543969 | Progesterone receptor membrane component 1 |
| Other categories | ||||||
| Prdx6 | 0.97 | 1.28 | 0.79 | 0.54* | AW536067 | Peroxiredoxin 6 |
| Por | 0.94 | 1.21 | 0.64 | 0.52* | AU016777 | P450 (cytochrome) oxidoreductase |
| Tgfb1i4 | 1.00 | 1.31 | 0.69* | 0.51* | AW546174 | Transforming growth factor beta 1-induced transcript 4 |
| Gas6 | 0.86 | 1.28 | 0.63* | 0.48* | AW557878 | Growth arrest-specific protein 6 |
| Gstm6 | 0.90 | 1.47* | 0.62* | 0.44* | AW559157 | Glutathione S-transferase, mu 6 |
| Gstm1 | 1.01 | 1.53* | 0.56 | 0.35* | AW552780 | Glutathione S-transferase, mu 1 |
| Tcf21 | 0.78 | 1.32* | 0.50* | 0.34* | AW558915 | Transcription factor 21 |
| Cav | 0.90 | 1.84* | 0.46* | 0.27* | AU016590 | Caveolin, caveola protein |
| Cluster D | ||||||
| Extracellular matrix proteins | ||||||
| Lamc1 | 1.24 | 1.06 | 0.57* | 0.66 | AW546446 | Laminin, gamma 1 |
| Sparc | 1.03 | 0.98 | 0.49* | 0.58 | AW536169 | Secreted acidic cysteine-rich glycoprotein |
| Col4a1 | 1.17 | 0.72 | 0.43* | 0.73 | AW545969 | Procollagen, type IV, alpha 1 |
| Col1a2 | 1.26 | 0.85 | 0.41* | 0.60* | AW553502 | Procollagen, type I, alpha 2 |
| Col2a1 | 1.39 | 0.75 | 0.40* | 0.62 | AW536693 | Procollagen, type II, alpha 1 |
| Col4a2 | 1.35 | 0.86 | 0.36* | 0.51* | AW554116 | Procollagen, type IV, alpha 2 |
| Col3a1 | 1.21 | 0.90 | 0.36* | 0.57 | AW550625 | Procollagen, type III, alpha 1 |
Genes with significant changes in transcript abundance (≥1.5-fold change) in at least one of the four experimental groups, selected by a t test and by having a Benjamini and Hochberg FDR of <0.05%. *, genes with significant changes in transcript abundance (≥1.5-fold change), selected by a t test and by having a Benjamini and Hochberg FDR of <0.05%. Genes with significant changes in transcript abundance (≥2-fold change) in at least one of the last two experimental groups are shown in bold.
To further increase the stringency, we raised the cutoff from a ≥1.5-fold change in expression level to a ≥2.0-fold change. In this analysis, expression on day 90 was compared to that on day 0 for the same group and used for interstrain comparison (C57BL/6J mice [day 90 versus day 0] versus DBA/2J mice [day 90 versus day 0]) (Fig. 3A), reducing the number of experimental groups from four to two. This analysis led to the identification of 251 differentially expressed transcripts in response to infection (with an FDR of <0.05%); 98 of them were in common for C57BL/6J and DBA/2J mice, whereas 24 were specific to C57BL/6J mice and 129 were specific to DBA/2J mice, respectively (Fig. 3B). We focused the rest of our analysis on these subsets of differentially expressed transcripts.
FIG. 3.

Transcriptional response in the lungs following M. tuberculosis infection. (A) Scatter plot representing the average fluorescence ratios (day 90 over day 0) from pairwise hybridizations (n = 6) for DBA/2J (y axis) and C57BL/6J (x axis) mice (n = 12 microarrays). Transcripts significantly modulated by a factor of at least 2.0-fold (FDR, <0.05%) in C57BL/6J and DBA/2J mice are colored red and green, respectively. Transcripts modulated in both strains are colored yellow, and the genes that did not pass the statistical cutoff are colored gray. (B) The numbers of transcripts differentially expressed in the two mouse strains are depicted in a Venn diagram.
Altered fibrotic response in susceptible mice.
Of the 24 transcripts modulated in C57BL/6J mice, nine were down-regulated (Table 3), and eight of those (encoding Fn1, Sparc, Col1a1, Col1a2, Col2a1, Col3a1, Col4a1, and Col4a2) were linked to the fibrotic response. These were previously detected as cluster D in Fig. 2C and Table 2. A semiquantitative RT-PCR approach was used to further validate the differential expression of fibrotic response genes detected in M. tuberculosis-infected lungs from C57BL/6J and DBA/2J mice at day 90 (Fig. 4A). In these experiments, Gapdh levels were not modulated in response to infection and were used as an internal control for normalization (Fig. 4B and C). This RT-PCR analysis validated five of the seven genes tested (encoding Sparc, Col1a1, Col1a2, Col4a1, and Col4a2), confirming the initial microarray data.
TABLE 3.
List of specific genes differentially regulated following infection
| Gene | DBA/2J mice (day 90 vs day 0)
|
C57BL/6J mice (day 90 vs day 0)
|
GenBank accession no. | Description | ||
|---|---|---|---|---|---|---|
| Fold change | t test P value | Fold change | t test P value | |||
| Fcgr3 | 2.02 | 1.44E−03 | 3.16 | 8.41E−08 | AW553460 | Fc receptor, immunoglobulin G, low-affinity III |
| Acp5 | 1.97 | 2.51E−07 | 2.83 | 6.61E−08 | AW538019 | Acid phosphatase 5, tartrate resistant |
| Itgb7 | 1.82 | 3.41E−07 | 2.63 | 9.28E−13 | AW550268 | Integrin beta 7 |
| H2-K | 1.75 | 3.02E−07 | 2.55 | 2.17E−07 | AU041598 | Histocompatibility 2, K region |
| Ctsd | 1.98 | 8.29E−07 | 2.54 | 2.67E−08 | AW558227 | Cathepsin D |
| Gm2a | 1.95 | 1.66E−05 | 2.32 | 2.36E−09 | C76954 | GM2 ganglioside activator protein |
| Mif | 1.94 | 1.13E−08 | 2.28 | 1.11E−06 | AW544543 | Macrophage migration inhibitory factor |
| Ppt | 1.56 | 3.45E−06 | 2.26 | 8.95E−08 | AW551653 | Palmitoyl-protein thioesterase |
| Hexb | 1.51 | 5.16E−06 | 2.20 | 9.66E−08 | AU020105 | Hexosaminidase B |
| B2m | 1.99 | 2.53E−08 | 2.20 | 2.40E−05 | AW541488 | Beta-2 microglobulin |
| Rac2 | 1.76 | 2.84E−07 | 2.16 | 4.56E−07 | AW557718 | RAS-related C3 botulinum substrate 2 |
| Idb2 | 1.55 | 1.41E−06 | 2.12 | 3.11E−09 | AU041192 | Inhibitor of DNA binding 2 |
| Kars | 1.87 | 1.04E−06 | 2.05 | 8.35E−09 | AU024108 | Lysyl-tRNA synthetase |
| DRAK2 | 1.31 | 2.75E−04 | 2.05 | 1.75E−08 | AW545696 | Similar to DRAK2 apoptosis-inducing kinase |
| Eno1 | 1.83 | 1.11E−06 | 2.00 | 7.19E−08 | AW536817 | Enolase 1, alpha nonneuron |
| Fn1 | 0.63 | 5.59E−04 | 0.50 | 3.16E−07 | AW547266 | Fibronectin 1 |
| Hbb-y | 0.52 | 1.60E−04 | 0.49 | 3.44E−04 | AW548068 | Hemoglobin Y, beta-like embryonic chain |
| Sparc | 0.58 | 3.85E−04 | 0.49 | 7.20E−06 | AW536169 | Secreted acidic cysteine-rich glycoprotein |
| Col1a2 | 0.61 | 4.33E−05 | 0.40 | 1.07E−05 | AW550799 | Procollagen, type I, alpha 2 |
| Col2a1 | 0.62 | 1.37E−03 | 0.40 | 7.21E−06 | AW536693 | Procollagen, type II, alpha 1 |
| Col4a1 | 0.62 | 2.84E−06 | 0.38 | 5.46E−06 | AW559158 | Procollagen, type IV, alpha 1 |
| Col1a1 | 0.64 | 2.17E−04 | 0.37 | 4.57E−05 | AW548767 | Procollagen, type I, alpha 1 |
| Col4a2 | 0.51 | 8.76E−07 | 0.36 | 1.27E−06 | AW554116 | Procollagen, type IV, alpha 2 |
| Col3a1 | 0.57 | 1.07E−04 | 0.36 | 1.67E−06 | AW550625 | Procollagen, type III, alpha 1 |
FIG. 4.

Semiquantitative RT-PCR analysis of differentially expressed genes involved in the fibrotic response. RNA samples (n = 3) from control and M. tuberculosis-infected lungs of C57BL/6J and DBA/2J mice were pooled and used for RT-PCR amplification, using the indicated PCR cycle numbers (16, 18, and 20). PCR products were separated by agarose gel electrophoresis, followed by Southern blotting and hybridization with the corresponding probes. (A) The intensities of the hybridization signals were quantitated using a phosphorimager. (B) Gapdh was used to standardize the mRNA levels of the target genes. (C) C57BL/6J and DBA/2J ratios of expression (day 90/day 0) for each target gene were established based on results from 18 PCR cycles. A ratio of expression with a relative unit of 1 indicates no gene modulation.
To further validate possible differences in the fibrotic response in infected lungs of C57BL/6J and DBA/2J mice, we also investigated the expression of genes known to be part of the fibrotic response (Mmp2, Timp1, and Arg1) (45) but not present on the 15K chips used in our study, using RT-PCR (Fig. 5). Matrix metalloproteinases (MMPs) and tissue inhibitors of metalloproteinase (TIMPs) are key enzymes that regulate tissue remodeling through turnover of the extracellular matrix under both normal and pathological conditions (7). We evaluated the expression of Mmp2 (MMP2/gelatinase A) (Fig. 5B). MMP2 is synthesized by fibroblasts and endothelial and epithelial cells and may be associated with chronically impaired tissue remodeling, leading to abnormal collagen deposition and possible pulmonary fibrosis (46). While the level of Mmp2 transcript remained unchanged in the lungs of C57BL/6J mice at 90 days postinfection, there was a marked and significant down-regulation of this transcript in infected DBA/2J mice (Fig. 5C). On the other hand, expression of Timp1 (10, 16), a natural inhibitor of MMPs, was up-regulated in both strains, but at a lower level in C57BL/6J mice (Fig. 5C). The noted Mmp2/Timp1 imbalance suggests a more prominent fibrotic response in the susceptible DBA/2J strain in response to M. tuberculosis infection than that in resistant C57BL/6J mice (Fig. 5C). The balance between Th1 and Th2 polarization has been shown to be an important determinant of the fibrotic response (45). Nos2 (nitric oxide synthase 2) is an important enzyme produced by macrophages in response to gamma interferon secretion and is a marker of Th1 polarization of the immune response. On the other hand, Arg1 (arginase 1) accelerates the development of fibrosis and is associated with a Th2 response and secretion of IL-13, IL-4, and transforming growth factor beta (45) (Fig. 5A). Consequently, the expression of Arg1 was measured in the lungs of C57BL/6J and DBA/2J mice infected with M. tuberculosis. Although no modulation of Arg1 was observed for C57BL/6J mice in response to infection, a highly significant increase was detected in DBA/2J mice (Fig. 5C). Altogether, these results are in agreement with the proposal that an increased fibrotic response in response to M. tuberculosis infection is associated with susceptibility in DBA/2J mice.
FIG. 5.

Semiquantitative RT-PCR analysis of Arg1, Mmp2, and Timp1. RNA samples were pooled (n = 3) and used for RT-PCR with various PCR cycle numbers (20, 22, 24, and 26). (A) Schematic representation of tissue remodeling regulation pathway. The expression of Arg1, Mmp2, and Timp1 was quantitated as described in the legend to Fig. 4 (B), and ratios of expression were calculated based on results obtained following 22 (Mmp2 and Timp1) and 24 (Arg1) PCR cycles (C). Gapdh was used to standardize the mRNA levels of the target genes (Fig. 4B). A ratio of expression with a relative unit of 1 indicates no gene modulation. (Panel A was adapted from reference 45 with permission of the publisher.)
Finally, we conducted a second aerosol infection of DBA/2J and C57BL/6J mice and collected lungs at day 30 (early time point) and day 70 (late time point) postinfection. While no significant difference in CFU counts was detected between C57BL/6J (6.69 log10) and DBA/2J (6.83 log10) mice on day 30, an ∼1.2-log difference (6.71 log10 for C57BL/6J mice and 7.88 log10 for DBA/2J mice) was observed on day 70 (unpublished data). RNAs were prepared from these tissues and used to generate transcript profiles with an Affymetrix platform. The results shown in Fig. S1 and S2 in the supplemental material validate those obtained with the cDNA arrays and demonstrate that Fn1, Sparc, Col1a1, Col1a2, Col3a1, Col4a1, and Col4a2 as well as Mmp2, Timp1, and Arg1 (evaluated by RT-PCR) are indeed differentially regulated in response to infection in susceptible DBA/2J and resistant C57BL/6J mice. Moreover, these results show that differences in expression of fibrotic response-associated genes are detectable at both early (day 30) and late (day 70) time points during infection. Although these differences were already detectable at day 30, they were considerably more pronounced at day 70, which correlates well with the fact that there is more tissue damage at late time points.
DISCUSSION
Replication of M. tuberculosis in the lungs of innately resistant (C57BL/6J) and susceptible (DBA/2J) inbred strains follows a biphasic course. Following aerosol infection (2 × 10² CFU), M. tuberculosis initially (1 to 3 weeks) replicates rapidly in the lungs of both C57BL/6J and DBA/2J mice. The infection is subsequently (4 weeks to 5 months) held stationary in C57BL/6J mice, while there is continuing microbial replication in the lungs of DBA/2J mice (23), which is accompanied by a strong inflammatory response and premature death. On the other hand, reduced bacterial replication in resistant mice is associated with proficient granuloma formation, less severe tissue injury, and increased survival (4). The genetic difference between C57BL/6J and DBA/2J mice is expressed phenotypically almost exclusively in the lung, as both strains can contain the infection in the spleen and liver. The genetic control of this differential susceptibility has been investigated in a series of genome scans performed with [C57BL/6J × DBA/2J] F2 mice infected by the intravenous or aerosol route, using time of survival and pulmonary bacterial replication as phenotypic markers of susceptibility (22, 23). These studies have revealed a complex genetic control, with at least four Trl genetic loci, detected on chromosomes 1 (Trl1), 3 (Trl2), 7 (Trl3), and 19 (Trl4) (22, 23).
To initiate the search for cell populations, physiological responses, and biochemical pathways that may underlie the differential permissiveness of DBA/2J and C57BL/6J mice to pulmonary replication of M. tuberculosis late during infection, we used transcript profiling with microarrays to identify genes and gene clusters differentially expressed in infected organs of both strains. In this analysis, we used two types of evaluations, i.e., intrastrain evaluation, comparing day 0 to day 90 transcript profiles, and interstrain evaluation, comparing day 0 and day 90 profiles independently. We additionally used two levels of stringency to identify differentially expressed genes, corresponding to either ≥1.5-fold or ≥2-fold changes between the different experimental groups. These two analyses identified the fibrotic response as a key physiological pathway which is differentially regulated in the lungs of the two strains in response to M. tuberculosis infection. Tissue fibrosis is characterized by the accumulation of excess insoluble collagen fibers, which causes a loss of elasticity, tissue “hardening,” and ultimately organ failure and death. Irradiation and experimental administration of drugs and particles can simulate fibroproliferation and induce pulmonary fibrosis in a variety of animal species (reviewed in reference 5). Repair of damaged tissues is a vital biological process that allows the replacement of dead or injured cells. This repair process involves a regenerative phase, in which injured cells are replaced by cells of the same type and there is no lasting evidence of damage, and a phase known as fibrosis, in which connective tissue replaces normal parenchymal tissue (45). Generally, both stages are required to slow or reverse the damage generated by an injurious agent. However, although initially beneficial, this healing process can become pathogenic if it continues unchecked, leading to substantial tissue remodeling and the formation of permanent scar tissue (45).
Our conclusion of a differentially regulated fibrotic response as a key determinant of genetically controlled susceptibility and resistance to pulmonary replication of M. tuberculosis in C57BL/6J and DBA/2J mice was based on the observation that a cluster of genes associated with the fibrotic response, namely, Sparc, Col1a1, Col1a2, Col4a1, and Col4a2 (cluster D), were more down-regulated in C57BL/6J mice than in DBA/2J animals on day 90. These differences were also validated by direct RT-PCR measurements. Moreover, we also noted a higher Mmp2-to-Timp1 ratio imbalance in susceptible DBA/2J versus resistant C57BL/6J mice. Finally, in additional experiments we observed a similar difference in expression of mRNAs for Timp1, Mmp2, and Arg1 on days 30 and 70 postinfection (see Fig. S1 and S2 in the supplemental material), suggesting that the differences in fibrotic responses to M. tuberculosis in these two strains appear fairly early in infection. An imbalance in MMP/TIMP ratios is a critical marker of the fibrogenic process. It has been proposed that a nondegrading microenvironment (increased TIMP1 levels) induces fibrogenicity (14, 36, 37). Examples of conditions/treatments known to increase TIMP1 expression in the lungs include bleomycin administration to mice (14, 19) and rabbits (46) and idiopathic pulmonary fibrosis in humans (37). More generally, MMPs and TIMPs have been implicated not only in normal lung development but also in a number of pulmonary inflammatory disorders, including asthma (41), emphysema (3, 29), acute lung injury (27), acute respiratory distress syndrome (31), and pulmonary fibrosis (28). Importantly, studies with MMP9-deficient mice have suggested that early MMP activity is an essential component of resistance to pulmonary mycobacterial infection and that MMP-9, specifically, is required for recruitment of macrophages and tissue remodeling to allow for the formation of tight, well-organized granulomas, a process that seems deficient in M. tuberculosis-infected susceptible DBA/2J mice (40).
In the Th1/Th2 polarization scheme in response to infectious agents, Arg1 (arginase 1) accelerates the development of fibrosis and is usually associated with a Th2 response and secretion of IL-13, IL-4, and transforming growth factor beta (45) (Fig. 5A). Although the marked enhanced expression of Arg1 seen in DBA/2J lungs in response to M. tuberculosis infection may be viewed as Th2 polarization in this strain, we do not believe this is the case. Previous studies from our group (unpublished data), using the C57BL/6J and DBA/2J mouse models of tuberculosis, failed to identify a major difference (by RNA expression or by serological measurements) between expression of type 1 and type 2 cytokines in the two strains. Therefore, although it is difficult to completely exclude a role for such cytokines in Arg1 expression, we propose that the higher expression of Arg1 in DBA/2J lungs is probably a result of the higher production of Timp1.
Furthermore, several fibrotic response-associated differentially expressed genes (Col1a1, Col1a2, Col3a1, fibronectin, and Timp1) noted in our study of pulmonary infection with M. tuberculosis are similar to those identified in a murine model of bleomycin-induced pulmonary fibrosis (12). In this model, bleomycin initially induces lung inflammation, followed by a progressive destruction of the normal lung architecture (1, 8). Histological analysis of M. tuberculosis-infected lungs from DBA/2J mice showed lesions filled with degenerating neutrophils replete with acid-fast bacilli, whereas C57BL/6J lesions contained mostly mononuclear cells (monocytes, lymphocytes, and macrophages) and relatively few bacilli. The predominance of neutrophils in the cellular response to infection in susceptible DBA/2J mice is also in agreement with the hypothesis of increased lung fibrosis (42). The similarities detected in these two experimental mouse models suggest the possibility that M. tuberculosis induces severe lung injury similar to that induced by high doses of bleomycin. Together, our data suggest that susceptible mice seem to develop altered tissue remodeling, leading to lung fibrosis following long-term exposure to M. tuberculosis challenge, compared to that of resistant mice. Based on our observations, we cannot exclude the possibility that intrinsic gene expression profile differences are important determinants of tuberculosis pathogenesis in mice and could contribute to differential resistance and susceptibility to M. tuberculosis infection, as recently suggested (26).
Studies with informative [C57BL/6J × DBA/2J] F2 mice showed that the genetic control of differential susceptibility of C57BL/6J and DBA/2J mice (extent of pulmonary replication and survival time) is complex, with four major Trl loci involved. It is not known which Trl locus or loci determine distinct fibrotic responses in C57BL/6J versus DBA/2J mice and whether this locus or loci act alone or through additive or epistatic interactions. These questions will be resolved with congenic mouse lines where individual chromosomal segments overlapping each Trl locus and donated by one strain are transferred to the genetic background of the other strain. We have started the derivation of independent mouse lines congenic for the Trl3 (chromosome 7; affects both microbial replication and time of survival) and Trl4 (chromosome 19; strongest logarithm-of-odds score in genetic studies) loci and have observed in preliminary experiments an effect of both loci on M. tuberculosis replication (J.-F. Marquis et al., unpublished data). The genetic intervals of the Trl3/Trl4 regions are currently being examined for the presence of positional candidates involved in tissue remodeling.
Supplementary Material
Acknowledgments
P.G. is a James McGill Professor of Biochemistry and a distinguished scientist of the Canadian Institutes of Health Research (CIHR). J.-F.M. is supported by a fellowship from the Fonds de Recherche en Santé du Québec. This work was supported by grant AI035237 from the National Institutes of Health.
Editor: J. L. Flynn
Footnotes
Published ahead of print on 15 October 2007.
Supplemental material for this article may be found at http://iai.asm.org/.
REFERENCES
- 1.Adamson, I. Y. 1984. Drug-induced pulmonary fibrosis. Environ. Health Perspect. 5525-36. [DOI] [PMC free article] [PubMed] [Google Scholar]
- 2.Casanova, J. L., and L. Abel. 2002. Genetic dissection of immunity to mycobacteria: the human model. Annu. Rev. Immunol. 20581-620. [DOI] [PubMed] [Google Scholar]
- 3.Cataldo, D., C. Munaut, A. Noel, F. Frankenne, P. Bartsch, J. M. Foidart, and R. Louis. 2000. MMP-2- and MMP-9-linked gelatinolytic activity in the sputum from patients with asthma and chronic obstructive pulmonary disease. Int. Arch. Allergy Immunol. 123259-267. [DOI] [PubMed] [Google Scholar]
- 4.Chackerian, A. A., and S. M. Behar. 2003. Susceptibility to Mycobacterium tuberculosis: lessons from inbred strains of mice. Tuberculosis (Edinburgh) 83279-285. [DOI] [PubMed] [Google Scholar]
- 5.Chua, F., J. Gauldie, and G. J. Laurent. 2005. Pulmonary fibrosis: searching for model answers. Am. J. Respir. Cell. Mol. Biol. 339-13. [DOI] [PubMed] [Google Scholar]
- 6.Comstock, G. W. 1978. Tuberculosis in twins: a re-analysis of the Prophit survey. Am. Rev. Respir. Dis. 117621-624. [DOI] [PubMed] [Google Scholar]
- 7.Corbel, M., C. Belleguic, E. Boichot, and V. Lagente. 2002. Involvement of gelatinases (MMP-2 and MMP-9) in the development of airway inflammation and pulmonary fibrosis. Cell. Biol. Toxicol. 1851-61. [DOI] [PubMed] [Google Scholar]
- 8.Elias, J. A., B. Freundlich, J. A. Kern, and J. Rosenbloom. 1990. Cytokine networks in the regulation of inflammation and fibrosis in the lung. Chest 971439-1445. [DOI] [PubMed] [Google Scholar]
- 9.Ellis, R. C., and L. A. Zabrowarny. 1993. Safer staining method for acid fast bacilli. J. Clin. Pathol. 46559-560. [DOI] [PMC free article] [PubMed] [Google Scholar]
- 10.Gueders, M. M., J. M. Foidart, A. Noel, and D. D. Cataldo. 2006. Matrix metalloproteinases (MMPs) and tissue inhibitors of MMPs in the respiratory tract: potential implications in asthma and other lung diseases. Eur. J. Pharmacol. 533133-144. [DOI] [PubMed] [Google Scholar]
- 11.Hinman, A. R., J. M. Judd, J. P. Kolnik, and P. B. Daitch. 1976. Changing risks in tuberculosis. Am. J. Epidemiol. 103486-497. [DOI] [PubMed] [Google Scholar]
- 12.Katsuma, S., K. Nishi, K. Tanigawara, H. Ikawa, S. Shiojima, K. Takagaki, Y. Kaminishi, Y. Suzuki, A. Hirasawa, T. Ohgi, J. Yano, Y. Murakami, and G. Tsujimoto. 2001. Molecular monitoring of bleomycin-induced pulmonary fibrosis by cDNA microarray-based gene expression profiling. Biochem. Biophys. Res. Commun. 288747-751. [DOI] [PubMed] [Google Scholar]
- 13.Kaufmann, S. H. 2003. Immune response to tuberculosis: experimental animal models. Tuberculosis (Edinburgh) 83107-111. [DOI] [PubMed] [Google Scholar]
- 14.Kolb, M., P. Bonniaud, T. Galt, P. J. Sime, M. M. Kelly, P. J. Margetts, and J. Gauldie. 2002. Differences in the fibrogenic response after transfer of active transforming growth factor-beta1 gene to lungs of “fibrosis-prone” and “fibrosis-resistant” mouse strains. Am. J. Respir. Cell. Mol. Biol. 27141-150. [DOI] [PubMed] [Google Scholar]
- 15.Kramnik, I., W. F. Dietrich, P. Demant, and B. R. Bloom. 2000. Genetic control of resistance to experimental infection with virulent Mycobacterium tuberculosis. Proc. Natl. Acad. Sci. USA 978560-8565. [DOI] [PMC free article] [PubMed] [Google Scholar]
- 16.Lagente, V., B. Manoury, S. Nenan, C. Le Quement, C. Martin-Chouly, and E. Boichot. 2005. Role of matrix metalloproteinases in the development of airway inflammation and remodeling. Braz. J. Med. Biol. Res. 381521-1530. [DOI] [PubMed] [Google Scholar]
- 17.Lavebratt, C., A. S. Apt, B. V. Nikonenko, M. Schalling, and E. Schurr. 1999. Severity of tuberculosis in mice is linked to distal chromosome 3 and proximal chromosome 9. J. Infect. Dis. 180150-155. [DOI] [PubMed] [Google Scholar]
- 18.Levin, M., and M. Newport. 2000. Inherited predisposition to mycobacterial infection: historical considerations. Microbes Infect. 21549-1552. [DOI] [PubMed] [Google Scholar]
- 19.Madtes, D. K., A. L. Elston, L. A. Kaback, and J. G. Clark. 2001. Selective induction of tissue inhibitor of metalloproteinase-1 in bleomycin-induced pulmonary fibrosis. Am. J. Respir. Cell. Mol. Biol. 24599-607. [DOI] [PubMed] [Google Scholar]
- 20.Medina, E., and R. J. North. 1996. Evidence inconsistent with a role for the Bcg gene (Nramp1) in resistance of mice to infection with virulent Mycobacterium tuberculosis. J. Exp. Med. 1831045-1051. [DOI] [PMC free article] [PubMed] [Google Scholar]
- 21.Medina, E., and R. J. North. 1998. Resistance ranking of some common inbred mouse strains to Mycobacterium tuberculosis and relationship to major histocompatibility complex haplotype and Nramp1 genotype. Immunology 93270-274. [DOI] [PMC free article] [PubMed] [Google Scholar]
- 22.Mitsos, L. M., L. R. Cardon, A. Fortin, L. Ryan, R. LaCourse, R. J. North, and P. Gros. 2000. Genetic control of susceptibility to infection with Mycobacterium tuberculosis in mice. Genes Immun. 1467-477. [DOI] [PubMed] [Google Scholar]
- 23.Mitsos, L. M., L. R. Cardon, L. Ryan, R. LaCourse, R. J. North, and P. Gros. 2003. Susceptibility to tuberculosis: a locus on mouse chromosome 19 (Trl-4) regulates Mycobacterium tuberculosis replication in the lungs. Proc. Natl. Acad. Sci. USA 1006610-6615. [DOI] [PMC free article] [PubMed] [Google Scholar]
- 24.Motulsky, A. G. 1960. Metabolic polymorphisms and the role of infectious diseases in human evolution. Hum. Biol. 3228-62. [PubMed] [Google Scholar]
- 25.North, R. J., and Y. J. Jung. 2004. Immunity to tuberculosis. Annu. Rev. Immunol. 22599-623. [DOI] [PubMed] [Google Scholar]
- 26.Orlova, M. O., K. B. Majorov, I. V. Lyadova, E. B. Eruslanov, C. E. M'Lan, C. M. Greenwood, E. Schurr, and A. S. Apt. 2006. Constitutive differences in gene expression profiles parallel genetic patterns of susceptibility to tuberculosis in mice. Infect. Immun. 743668-3672. [DOI] [PMC free article] [PubMed] [Google Scholar]
- 27.Pardo, A., R. Barrios, V. Maldonado, J. Melendez, J. Perez, V. Ruiz, L. Segura-Valdez, J. I. Sznajder, and M. Selman. 1998. Gelatinases A and B are up-regulated in rat lungs by subacute hyperoxia: pathogenetic implications. Am. J. Pathol. 153833-844. [DOI] [PMC free article] [PubMed] [Google Scholar]
- 28.Pardo, A., M. Selman, R. Ramirez, C. Ramos, M. Montano, G. Stricklin, and G. Raghu. 1992. Production of collagenase and tissue inhibitor of metalloproteinases by fibroblasts derived from normal and fibrotic human lungs. Chest 1021085-1089. [DOI] [PubMed] [Google Scholar]
- 29.Parks, W. C., and S. D. Shapiro. 2001. Matrix metalloproteinases in lung biology. Respir. Res. 210-19. [DOI] [PMC free article] [PubMed] [Google Scholar]
- 30.Parry, C., and P. D. Davies. 1996. The resurgence of tuberculosis. Soc. Appl. Bacteriol. Symp. Ser. 2523S-26S. [PubMed] [Google Scholar]
- 31.Ricou, B., L. Nicod, S. Lacraz, H. G. Welgus, P. M. Suter, and J. M. Dayer. 1996. Matrix metalloproteinases and TIMP in acute respiratory distress syndrome. Am. J. Respir. Crit. Care Med. 154346-352. [DOI] [PubMed] [Google Scholar]
- 32.Rieder, H. L., G. D. Kelly, A. B. Bloch, G. M. Cauthen, and D. E. Snider, Jr. 1991. Tuberculosis diagnosed at death in the United States. Chest 100678-681. [DOI] [PubMed] [Google Scholar]
- 33.Russell, D. G. 2001. Mycobacterium tuberculosis: here today, and here tomorrow. Nat. Rev. Mol. Cell. Biol. 2569-577. [DOI] [PubMed] [Google Scholar]
- 34.Sanchez, F., T. V. Radaeva, B. V. Nikonenko, A. S. Persson, S. Sengul, M. Schalling, E. Schurr, A. S. Apt, and C. Lavebratt. 2003. Multigenic control of disease severity after virulent Mycobacterium tuberculosis infection in mice. Infect. Immun. 71126-131. [DOI] [PMC free article] [PubMed] [Google Scholar]
- 35.Sapoval, B., M. Filoche, and E. R. Weibel. 2002. Smaller is better—but not too small: a physical scale for the design of the mammalian pulmonary acinus. Proc. Natl. Acad. Sci. USA 9910411-10416. [DOI] [PMC free article] [PubMed] [Google Scholar]
- 36.Selman, M., T. E. King, and A. Pardo. 2001. Idiopathic pulmonary fibrosis: prevailing and evolving hypotheses about its pathogenesis and implications for therapy. Ann. Intern. Med. 134136-151. [DOI] [PubMed] [Google Scholar]
- 37.Selman, M., V. Ruiz, S. Cabrera, L. Segura, R. Ramirez, R. Barrios, and A. Pardo. 2000. TIMP-1, -2, -3, and -4 in idiopathic pulmonary fibrosis. A prevailing nondegradative lung microenvironment? Am. J. Physiol. Lung Cell. Mol. Physiol. 279L562-L574. [DOI] [PubMed] [Google Scholar]
- 38.Sousa, A. O., J. I. Salem, F. K. Lee, M. C. Vercosa, P. Cruaud, B. R. Bloom, P. H. Lagrange, and H. L. David. 1997. An epidemic of tuberculosis with a high rate of tuberculin anergy among a population previously unexposed to tuberculosis, the Yanomami Indians of the Brazilian Amazon. Proc. Natl. Acad. Sci. USA 9413227-13232. [DOI] [PMC free article] [PubMed] [Google Scholar]
- 39.Stead, W. W., J. W. Senner, W. T. Reddick, and J. P. Lofgren. 1990. Racial differences in susceptibility to infection by Mycobacterium tuberculosis. N. Engl. J. Med. 322422-427. [DOI] [PubMed] [Google Scholar]
- 40.Taylor, J. L., J. M. Hattle, S. A. Dreitz, J. M. Troudt, L. S. Izzo, R. J. Basaraba, I. M. Orme, L. M. Matrisian, and A. A. Izzo. 2006. Role for matrix metalloproteinase 9 in granuloma formation during pulmonary Mycobacterium tuberculosis infection. Infect. Immun. 746135-6144. [DOI] [PMC free article] [PubMed] [Google Scholar]
- 41.Vignola, A. M., L. Riccobono, A. Mirabella, M. Profita, P. Chanez, V. Bellia, G. Mautino, P. D'Accardi, J. Bousquet, and G. Bonsignore. 1998. Sputum metalloproteinase-9/tissue inhibitor of metalloproteinase-1 ratio correlates with airflow obstruction in asthma and chronic bronchitis. Am. J. Respir. Crit. Care Med. 1581945-1950. [DOI] [PubMed] [Google Scholar]
- 42.Ward, P. A., and G. W. Hunninghake. 1998. Lung inflammation and fibrosis. Am. J. Respir. Crit. Care Med. 157S123-S129. [DOI] [PubMed] [Google Scholar]
- 43.World Health Organization. 2002. Global tuberculosis control: surveillance, planning, financing. WHO report. WHO, Geneva, Switzerland.
- 44.World Health Organization. 2000. The world health report 2000. Health systems: improving performance. WHO, Geneva, Switzerland.
- 45.Wynn, T. A. 2004. Fibrotic disease and the T(H)1/T(H)2 paradigm. Nat. Rev. Immunol. 4583-594. [DOI] [PMC free article] [PubMed] [Google Scholar]
- 46.Yaguchi, T., Y. Fukuda, M. Ishizaki, and N. Yamanaka. 1998. Immunohistochemical and gelatin zymography studies for matrix metalloproteinases in bleomycin-induced pulmonary fibrosis. Pathol. Int. 48954-963. [DOI] [PubMed] [Google Scholar]
- 47.Yan, B. S., A. Kirby, Y. V. Shebzukhov, M. J. Daly, and I. Kramnik. 2006. Genetic architecture of tuberculosis resistance in a mouse model of infection. Genes Immun. 7201-210. [DOI] [PubMed] [Google Scholar]
- 48.Young, D. B., and K. Duncan. 1995. Prospects for new interventions in the treatment and prevention of mycobacterial disease. Annu. Rev. Microbiol. 49641-673. [DOI] [PubMed] [Google Scholar]
Associated Data
This section collects any data citations, data availability statements, or supplementary materials included in this article.