Abstract
Enzyme-linked immunosorbent assay (ELISA) and related assays are representative of methods currently used for antibody tests. However, they occasionally produce nonspecific reactions, thus making it difficult to reliably measure low levels of specific antibodies. To find a test method that minimizes nonspecific reactions, we introduced the principle of antibody-mediated complement-dependent cytotoxicity (CDC) into an antibody assay. The procedure has three steps: (i) the mixing of test samples with a suspension of cells expressing the antigen of interest on their surfaces, (ii) the addition of rabbit complement, and (iii) the measurement of lactose dehydrogenase (LDH) activities by adding a chromogenic substrate to the reaction mixture. When the specific antibodies exist in the sample, complement activation triggered by antibody binding on the surface of the antigen-expressing cells may lyse the cells, releasing LDH into the medium. Mouse and rabbit sera hyperimmune to nonstructural protein 1 (NS1) of Japanese encephalitis virus (JEV) lysed NS1-expressing cells in a dose-dependent manner. Evaluations using sera from horses naturally infected with JEV showed that the CDC assay had quantitative correlation and qualitative agreement with previously established NS1 antibody-detecting immunostaining and ELISA methods. The assay method also detected NS1 antibodies in sera of mice 2 days after experimental infection with JEV; specific, but not natural, immunoglobulin M antibodies were detected. Since almost all sera examined in this study showed no nonspecific reactions, the CDC assay was shown to be a reliable method for measuring low levels of specific antibodies.
Enzyme-linked immunosorbent assay (ELISA) and related assays are representative of methods currently used for testing antibodies induced by viral infections (22). These assays are based on measurements of antibody molecules of a certain immunoglobulin class(es) bound to antigen molecules, irrespective of the biological functions of the antibody. Although these methods are simple, easy, and rapid, they also detect antibodies that are not specifically bound to the antigen, resulting in nonspecific reactions. These include naturally occurring low-affinity polyreactive antibodies (natural antibodies) that are secreted by a subset of long-lived B cells termed B-1 cells, many of which are CD5 positive (6, 9). This nonspecific reaction is thought to make it difficult for these methods to reliably detect low levels of specific antibodies.
Our laboratory has developed methods to measure relatively low levels of antibodies to the nonstructural protein 1 (NS1) of Japanese encephalitis virus (JEV) elicited by natural infections with JEV (12-14). The test methods we have developed to measure NS1 antibodies are useful for surveying natural JEV infections in populations vaccinated with inactivated JE vaccine. Since levels of NS1 antibodies induced by asymptomatic infections are considerably lower than those induced in JE patients, an ELISA established for measuring NS1 antibodies induced in JE patients (21) cannot detect those induced by natural infections. We therefore established a method based on immunostaining that was sufficiently sensitive to measure NS1 antibodies induced in naturally infected humans (14) and horses (13). We have established an ELISA method for horses (12); however, because of the relatively high levels of nonspecific reactions, even this ELISA was unable to detect NS1 antibodies induced in naturally infected humans. The success in establishing an ELISA for horse sera seems to be attributed to the relatively high levels of NS1 antibodies in this animal species, which is more frequently exposed to infective mosquito bites in nature than are humans, though the levels of exposure are not so high as to cause disease.
Antibody-mediated complement-dependent cytotoxicity (CDC) frequently has been used for specific cell depletion (3). The mechanism is based on complement activation triggered by a specific antibody binding to the antigen appearing on the cell surface and the subsequent formation of the C5b-9 membrane attack complex that may lyse the cells. CDC also is likely to be a mechanism of host defense against viral infections (24). For JEV infection, protection from a lethal challenge in mice that have JEV NS1 antibodies but not neutralizing ones is considered to be related in part to this mechanism (16). This also has been assumed for NS1 antibody-induced protection of mice from infection with other flaviviruses, such as yellow fever (19, 20), dengue (4), and tick-borne encephalitis (8) viruses; however, a complement-independent mechanism in protection by NS1 antibodies with a West Nile virus system recently has been reported (2). Considering the specificity of the CDC phenomenon, its principle is applicable to antibody testing.
This study aimed to utilize the principle of CDC to establish a novel method for testing JEV NS1 antibodies. Although CDC assays originally were performed for functional evaluations of antibodies to estimate an in vivo role of the CDC mechanism in flaviviruses (4, 16, 20) and other systems (1, 5, 7, 17, 18, 23), the present study sought to use CDC to measure low levels of specific antibodies with high reliability in general antibody assays. For our initial evaluation of this method, we used sera from mice and rabbits hyperimmune to NS1, along with sera from horses naturally infected with JEV that we had used in our earlier study to establish immunostaining and ELISA methods. We also used sera of mice experimentally infected with JEV. The results we obtained indicated that the principle of CDC could be applied to testing for NS1 antibodies.
MATERIALS AND METHODS
Serum samples.
With the exception of naïve mouse sera, all sera used in the present study also were used in or prepared for our earlier studies (10, 12, 13, 15) and were stored at −30°C. Naïve mouse sera were prepared for this study and used as normal mouse sera (NMS) or for obtaining cutoff values to differentiate positive from negative samples for the CDC assay and ELISA. Hyperimmune mouse serum (HMS) (10) was obtained by repeated immunization of adult BALB/c mice with an affinity-purified NS1 antigen obtained from culture fluids of Vero cells infected with the Nakayama strain of JEV. A monoclonal antibody to JEV NS1, JE-2D5 (12), was used for the affinity purification. Hyperimmune rabbit serum (HRS) (12) was obtained by repeated immunization of a Japan White rabbit with an NS1 antigen affinity purified from culture fluids of Nakayama-infected Vero cells. Normal rabbit serum (NRS) was obtained from the same rabbit prior to immunization. Horse sera (13) were collected from 1996 through 2000 from thoroughbred yearlings that had been born and kept on Hokkaido Island (a northern nonenzootic area). These horses were without JEV vaccination and were negative for hemagglutination-inhibiting (HAI) antibody. Sera also were collected at this time from clinically healthy thoroughbred racehorses aged 2 to 4 years and kept in the prefectures Hokkaido, Gumma, Saitama, Chiba, Aichi, Oita, and Saga. Experimentally infected mouse sera (15) were obtained from ICR mice immunized with 10 or 100 μg of a pcDNA3-based plasmid expressing premembrane and envelope genes of the JEV Nakayama strain (pcJEME) (15) or inoculated with phosphate-buffered saline (PBS); all mice then were infected with 10,000 50% lethal doses of the Beijing 3 strain. All sera were heat inactivated prior to use for antibody testing.
Monoclonal antibodies.
Hybridoma clones 1D12, 5A5, and 6A11, which secrete natural immunoglobulin M (IgM) antibodies, have been described previously (11). Briefly, spleen cells were collected from naïve mice, fused with mouse myeloma P3U1 cells, screened for the production of antibodies to the protozoan parasite Toxoplasma gondii, and then cloned. Antibodies were obtained in an ascites form from pristane-primed BALB/c mice. Control ascitic fluids were obtained from pristane-primed mice inoculated with P3U1 cells.
NS1-expressing cells.
The generation of cells stably transfected with the NS1 gene (MF6 cells [14]) or NS1 and NS2A genes (3G8 cells [12]) of JEV has been described already. Briefly, CHO-K1 cells were transfected with a pcDNA3-based plasmid expressing NS1 or NS1/NS2A genes of the JEV Nakayama strain, selected in G418-containing medium, and then cloned by limiting dilution. Approximately 80 to 100% of cells expressed NS1 antigen in both MF6 and 3G8 cells, as determined by immunostaining. Live MF6 cells were used as the antigen for the CDC assay, while the fixed MF6 cells for the immunostaining assay (13) and culture fluids of 3G8 cells for ELISA (12) had been used in our earlier studies to measure NS1 antibodies in horse sera.
Fluorescent antibody staining.
Cells were fixed with 2% paraformaldehyde in PBS. Next, they were incubated with a monoclonal against NS1 (JE-2D5) and then with fluorescein isothiocyanate-labeled anti-mouse IgG. Cells then were observed under a fluorescent microscope.
ELISA to measure NS1 antibody levels.
All ELISA data from horse sera were obtained as previously described (12). ELISAs for detecting NS1 antibodies in mouse and rabbit sera were performed essentially by following the method previously described for measuring NS1 antibody levels in horse sera (12). Briefly, microplates sensitized with NS1 antigen affinity purified from culture fluids of MF6 cells were incubated serially with test sera, conjugates, and p-nitrophenyl phosphate. The amount of NS1 antigen used for sensitization was 3 ng/well, unless otherwise specified. Conjugates were alkaline phosphatase-conjugated goat anti-mouse IgG or IgM (Zymed, San Francisco, CA) or goat anti-rabbit IgG (Sigma Chemical, St. Louis, MO). Tests were done in duplicate, and absorbances obtained from the two wells were averaged. To minimize nonspecific reactions, a nonsensitized control plate was run in parallel and the difference in absorbances from antigen-sensitized wells was obtained, unless otherwise specified. When the subtraction provided a negative value, 0.000 was assigned to the result.
CDC assay.
For the CDC assay, an MF6 cell suspension containing 5 × 10⁴ cells in 50 μl of serum-free minimal essential medium (SF-MEM) was mixed with an equal volume of test serum diluted in SF-MEM and incubated on ice for 30 min. Eleven microliters of rabbit complement (Low-Tox-M rabbit complement; Cedarlane, Hornby, Canada) was added to make a final concentration of 10% and was incubated at 37°C for 2 h. Following centrifugation at 500 rpm for 5 min, 50 μl of the supernatant was mixed with 50 μl of a lactose dehydrogenase (LDH) substrate (cytotoxicity detection kit plus [LDH]; Roche, Mannheim, Germany) and incubated at room temperature for 15 min, followed by spectrophotometry at 490 nm. All procedures were done in duplicate in 96-well microplates, and absorbances obtained from the two wells were averaged. The percentage of specific cell lysis was calculated according to the manufacturer's instructions by using the following formula: 100 × [(A − C)/(B − C)], where A represents an absorbance obtained with test serum (experimental release), B represents an absorbance obtained by lysing all of the target cells with 1% Triton X-100 (maximum release), and C represents an absorbance obtained with target cells incubated in SF-MEM containing rabbit complement at 10% (minimum release). When this calculation provided a negative value, 0.00% was assigned to the result. Reactions showing greater than 4.32 or 5% specific lysis were determined to be positive for NS1 antibodies in horse and mouse sera, respectively. In the one-dilution method, the percentage of specific cell lysis obtained at a 1:10 dilution of sera was used as the NS1 antibody level. In the endpoint method, the NS1 antibody titer was expressed as the highest serum dilution giving greater than 4.32 or 5% specific lysis for horse and mouse sera, respectively.
Depletion of IgG or IgM from serum.
A 1:250 dilution of HMS or a 1:40 dilution of serum pooled from mice 4 days after infection with JEV was used for the depletion of IgG or IgM. Fifty microliters of each serum sample was mixed with an equal volume of serial 10-fold dilutions (from 1:101 to 1:104) of goat anti-mouse IgG (Chemicon, Temecula, CA) or sheep anti-mouse IgM (Binding Site, Birmingham, England). Following incubation at 37°C for 1 h and then at 4°C overnight, the mixture was centrifuged at 16,000 × g for 1 h, and the supernatant was examined for IgG or IgM levels by ELISA and for NS1 antibody levels by the CDC assay.
ELISA to measure IgG or IgM levels.
A sandwich ELISA was performed essentially as previously described (10). Briefly, microplates sensitized with a goat anti-mouse IgG or sheep anti-mouse IgM were incubated with a 1:2 dilution of depleted sera (described above) and then alkaline phosphatase-conjugated goat anti-mouse IgG or IgM (Zymed, San Francisco, CA), respectively. The enzyme activity bound on the plate was measured with p-nitrophenyl phosphate. The absorbances obtained with depleted sera were divided by the control absorbance obtained with nondepleted sera and were expressed as relative IgG or IgM levels.
Statistical analysis.
Correlation coefficients were calculated by means of the Microsoft Excel statistical package. Probability levels (P) of less than 0.05 were considered significant.
RESULTS
Selection of antigen-expressing cells used for the CDC assay.
Since the CDC assay uses a mechanism involving complement-dependent cytotoxicity, cells expressing the antigen of interest on their surfaces are a prerequisite. We therefore looked for the presence of the NS1 antigen on the surfaces of cells stably expressing the NS1 gene (MF6 cells) and the NS1 and NS2A genes (3G8 cells). Cells were fixed without permeabilization and incubated with JE-2D5 and fluorescein isothiocyanate conjugate to stain their surfaces. Since MF6 cells stained more strongly than 3G8 cells (data not shown), we selected MF6 cells for the antigens in the CDC assay. The stronger surface staining of cells expressing the NS1 gene alone than of those expressing the NS1 and NS2A genes was consistent with a report that examined the expression of JEV NS1 on the surface of cells expressing the NS1 gene with or without a part of the NS2A gene (16).
Preliminary evaluation of the CDC assay using HMS and HRS.
The preliminary evaluation of the applicability of CDC for the antibody assay was done using hyperimmune animal sera. MF6 cells were incubated with serial 10-fold dilutions of HMS or HRS and then with complement. Following brief centrifugation, the supernatant was incubated with the LDH substrate. Nonimmune animal sera (NMS or NRS) were used as a control. For comparison, the same dilutions of these specimens were examined by an ELISA for measuring NS1 antibodies.
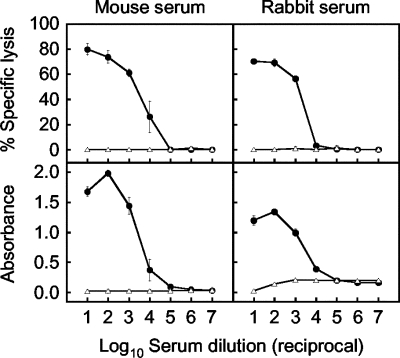
As shown in Fig. 1, high percentages of specific cell lysis (approximately 60 to 80%) were found in highly concentrated sera (dilutions of 1:101 to 1:103), which steeply declined in the dilution range between 1:103 and 1:105 in both HMS and HRS. In contrast, NMS and NRS showed 0.00% specific lysis even at high concentrations. The dose-response curves obtained from the CDC assay were essentially similar to those obtained by ELISA. The results indicated that the CDC mechanism can be used for antibody testing.
FIG. 1.
Comparison between the CDC assay and ELISA for measuring antibodies to JEV NS1 in mouse and rabbit sera. Percentages of specific cell lysis in the CDC assay (upper graphs) and ELISA absorbances (lower graphs) were obtained with serial 10-fold dilutions of hyperimmune (closed circles) or nonimmune (open triangles) serum from a mouse (left graphs) or rabbit (right graphs). Each datum represents an average obtained in two separate experiments (standard deviations are indicated by bars).
Evaluation of the CDC assay using sera from naturally infected horses.
Since we had previously developed two methods, based on immunostaining (13) and ELISA (12), for measuring NS1 antibodies in horse sera, the CDC assay could be evaluated using horse sera with known NS1 antibody levels/titers.
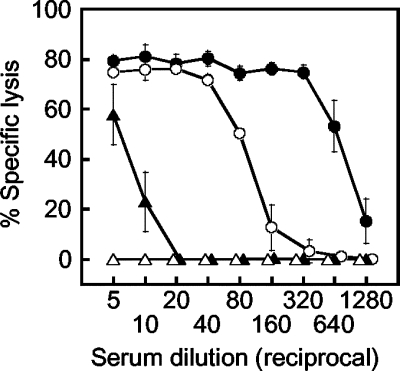
First, we obtained the percentages of specific cell lysis using serial twofold dilutions of horse sera with different NS1 antibody levels as determined by ELISA (Fig. 2). The ELISA values for these sera were 1.362 (highly positive), 0.883 (moderately positive), 0.258 (weakly positive), and 0.058 (negative). The dose-response curves were consistent with those obtained with mouse and rabbit sera, as shown in Fig. 1. Specifically, highly and moderately positive sera showed high percentages of specific lysis at high concentrations followed by steep declines, whereas the negative serum did not show detectable levels of specific lysis even at the highest concentration. The steep declines in the dose-response curves were nearly parallel in three positive samples and shifted to the right with increasing ELISA antibody levels. For sera showing percentages of specific lysis between the minimum (0%) and maximum (75 to 81%) values, higher percentages of specific lysis were shown for sera with higher ELISA antibody levels at any dilution point. These results indicated that the CDC assay also can measure NS1 antibody levels in equine sera and that the results can be expressed by both the one-dilution and the endpoint methods.
FIG. 2.
Percentages of specific cell lysis obtained with serial twofold dilutions of highly positive (closed circles), moderately positive (open circles), weakly positive (closed triangles), and negative (open triangles) horse sera as determined by the CDC assay for measuring antibodies to JEV NS1. Each datum represents an average obtained in two separate experiments (standard deviations are indicated by bars).
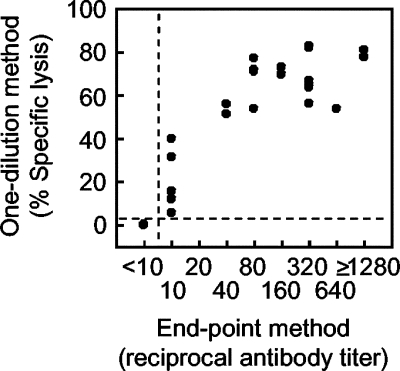
Second, we used 40 horse sera for comparisons of results obtained by the one-dilution and endpoint methods (Fig. 3). Since the weakly positive serum used in the above-described experiment did not show detectable specific lysis at a dilution of 1:20 (Fig. 2), we tentatively used a dilution of 1:10 in the one-dilution method. The cutoff value differentiating positive from negative samples was obtained with negative control sera from 42 horses that were negative for NS1 antibodies in ELISA, aged 1 to 4 years, and born and kept in a nonepizootic area of northern Japan (Hokkaido Island). Most samples (40 of 42 samples; 95.2%) showed 0.00% specific lysis, while the other two showed 1.57 and 6.40%, respectively, at a dilution of 1:10 (data not shown); the mean percentage of specific lysis was 0.19%, and the standard deviation was 1.01%. In line with a method used to obtain the cutoff value in ELISA (12), the confidence limit at a probability level of 0.01% was used for the cutoff value in the one-dilution method and was calculated to be 4.32%. We also used this value for determining the NS1 antibody titer for the endpoint method: the NS1 antibody titer was expressed as the highest serum dilution providing greater than 4.32% specific lysis. Since a 1:10 dilution was used in the one-dilution method, serum samples showing NS1 antibody titers of 1:10 or higher were determined to be positive for NS1 antibodies by the endpoint method. As shown in Fig. 3, the percentages of specific lysis obtained by the one-dilution method significantly correlated with antibody titers obtained by the endpoint method, with a correlation coefficient of 0.933 (P < 0.001).
FIG. 3.
Comparison between the one-dilution and endpoint methods of the CDC assay for measuring antibodies to JEV NS1 in horse sera. Percentages of specific cell lysis obtained by the one-dilution method were compared to NS1 antibody titers obtained by the endpoint method. Dotted lines indicate cutoff values for differentiating positive from negative samples. In the one-dilution method, 4.32% specific cell lysis was calculated from the averages and standard deviations obtained with negative samples; in the endpoint method, titers of 1:10 or higher were determined to be positive.
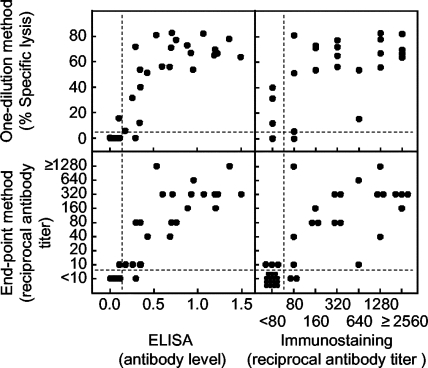
Third, we compared the CDC assay (both one-dilution and endpoint methods) to each of the two previously established methods of ELISA (12) and immunostaining (13). Quantitative comparisons (Fig. 4) provided significant correlation coefficients in all combinations between the one-dilution method and ELISA (0.848; P < 0.001) or immunostaining (0.784; P < 0.001) and between the endpoint method and ELISA (0.884; P < 0.001) or immunostaining (0.799; P < 0.001). Higher correlation coefficients were shown with ELISA than with the immunostaining method, and the correlation coefficients of the endpoint method were higher than those of the one-dilution method. Additionally, qualitative comparisons (Table 1) showed high levels of agreement between the CDC assay and ELISA (38 of 40; 95.0%) or the CDC assay and the immunostaining method (35 of 40; 87.5%). Consistent with quantitative comparisons (Fig. 4), the CDC assay results showed higher agreement with those of the ELISA than did the immunostaining method (Table 1). We did not separate the results of the qualitative comparison by one-dilution and endpoint methods, since the qualitative agreement between these methods was 100% (Fig. 3). The sensitivity and specificity of the CDC assay were, respectively, 95.7% (22 of 23) and 94.1% (16 of 17) against ELISA and 90.9% (20 of 22) and 83.3% (15 of 18) against the immunostaining method (Table 1). These results indicated that the CDC assay correctly measured NS1 antibodies in horse sera.
FIG. 4.
Comparison of the CDC assay to two previously developed methods for measuring JEV NS1 antibodies in horse sera. Percentages of specific cell lysis shown by the one-dilution method (upper graphs) and NS1 antibody titers shown by the endpoint method (lower graphs) obtained in the present study using the CDC assay were compared to NS1 antibody levels shown by ELISA (left graphs) or NS1 antibody titers shown by the immunostaining method (right graphs), which were obtained in our earlier studies (12, 13). Dotted lines indicate cutoff values for differentiating positive from negative samples. NS1 antibody levels/titers of 4.32% (the one-dilution method), 1:10 (the endpoint method), 0.122 (ELISA), and 1:80 (the immunostaining method) or higher were determined to be positive.
TABLE 1.
Qualitative comparison between the CDC assay and the ELISA or immunostaining method for measuring JEV NS1 antibodies in horse sera
| CDC assay result | No. of sera with indicated result by:
|
|||||
|---|---|---|---|---|---|---|
| ELISA
|
Immunostaining
|
|||||
| Positive | Negative | Total | Positive | Negative | Total | |
| Positive | 22 | 1 | 23 | 20 | 3 | 23 |
| Negative | 1 | 16 | 17 | 2 | 15 | 17 |
| Total | 23 | 17 | 40 | 22 | 18 | 40 |
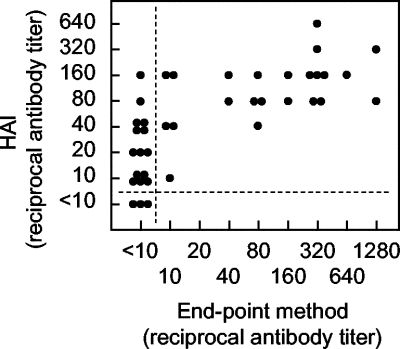
Finally, NS1 antibody titers obtained by the endpoint method of the CDC assay were compared to HAI antibody titers, using 40 sera used in the experiments shown in Fig. 3 and 4 and Table 1; HAI antibody titers of these sera were previously determined (13). Although racehorses in Japan are vaccinated with inactivated JE vaccine every year, it is considered that natural infections inducing NS1 antibodies increase HAI antibody titers. As shown in Fig. 5, a significant correlation was obtained between NS1 and HAI antibodies, with a correlation coefficient of 0.711 (P < 0.001). All sera positive for NS1 antibodies were positive for HAI antibodies, while all of the sera negative for HAI antibodies were negative for NS1 antibodies. These results suggested that the increase in NS1 antibody titers as determined by the CDC assay was accompanied by an increase in HAI antibody titers.
FIG. 5.
Comparison between the CDC assay (endpoint method) and HAI test. NS1 antibody titers shown by the endpoint method obtained in the present study were compared to HAI antibody titers obtained in our earlier studies (13). Dotted lines indicate cutoff values for differentiating positive from negative samples for both tests.
In addition, five repeated antibody titrations by the endpoint method using highly and moderately positive sera provided assay variations within just a twofold range (data not shown), indicating the reproducibility of the CDC assay.
Evaluation of the CDC assay using sera from experimentally infected mice.
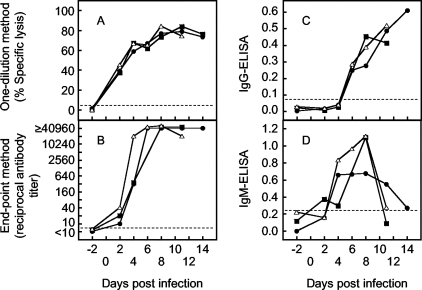
To evaluate the CDC assay for its ability to detect antibodies in an early phase of infection, we measured NS1 antibody levels/titers in sera successively collected from mice after experimental infection with JEV (Fig. 6). These sera were the same as those obtained in our earlier study to evaluate a candidate vaccine that did not contain or express NS1 antigens (15); thus, sera collected following viral infection could be used to show increases in NS1 antibody levels/titers. There were three groups of mice, one immunized with 100 μg of pcJEME, one immunized with 10 μg of pcJEME, and one inoculated with PBS, after which all three groups were infected with JEV. Sera pooled from five mice in each group were evaluated. As a reference, these pooled sera were tested by ELISA to measure IgG and IgM class antibodies to NS1. Cutoff values differentiating positive from negative samples were obtained using sera from 10 naïve mice. Since all of the sera showed 0.00% specific lysis, we set the arbitrary cutoff value as 5% for the CDC assay. For ELISA, 0.076 and 0.217 cutoff values were calculated for IgG and IgM antibodies, respectively, from the averages (plus two times the standard deviation) of ELISA antibody levels obtained with the naive mouse sera.
FIG. 6.
Time course of NS1 antibody levels/titers in mice infected with JEV. Sera were examined by the one-dilution (A) or endpoint (B) method of the CDC assay and ELISA for measuring IgG (C) or IgM (D) antibodies. The sera used in this experiment were collected in a previous study (15), in which five mice in one group were immunized with 100 μg (closed circles) or 10 μg (closed squares) of pcJEME or were inoculated with PBS (open triangles), followed by infection with JEV. Because of the small volumes of stored sera, sera pooled from the five mice were used for this experiment. Sera were not available from PBS-inoculated mice on day 14, since the mice died of JEV infection. The volume of stored sera from mice immunized with 10 μg of pcJEME on days 6 and 14 was not enough for examination by all assay methods. For ELISA, the antigen amount used for sensitization was 3 or 20 ng/well to measure IgG or IgM antibodies, respectively, and test sera were used at a 1:200 dilution. Dotted lines indicate cutoff values to differentiate positive from negative samples. Antibody levels/titers of 5% (the one-dilution method), 1:10 (the endpoint method), 0.076 (IgG ELISA), and 0.217 (IgM ELISA) or higher were determined to be positive (see the text for details).
NS1 antibodies were detectable by the CDC assay in sera 2 days after infection in all groups of mice (Fig. 6). Percentages of specific lysis obtained by the one-dilution method increased sharply until day 4 and then increased gradually until day 8 in all groups. However, NS1 antibody titers obtained by the endpoint method increased to high levels by day 4 in the PBS-inoculated group and by day 6 or 8 in the two pcJEME-immunized groups. By ELISA, IgG antibodies were first detected on day 6 in all groups, whereas IgM antibodies were first detected on day 2 in one of the three groups and on day 4 in all three groups. These results suggested that the CDC assay can detect IgM antibodies.
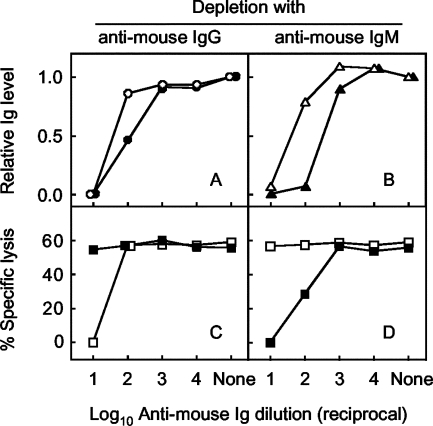
Depletion experiments were performed to determine if the antibodies detected by the CDC assay in the early phase of infection were of the IgM class. Sera pooled from pcJEME (100 μg)-immunized mice 4 days after infection (hereafter termed day-4 serum) were incubated with serial 10-fold dilutions of anti-mouse IgG or IgM, centrifuged, and examined for Ig levels by a sandwich ELISA and for NS1 antibodies by the CDC assay (Fig. 7). As a reference, HMS was examined in parallel. The dose-dependent curve obtained from the sandwich ELISA indicated that IgG or IgM fractions were almost completely depleted from the day-4 serum and HMS by incubation with anti-mouse IgG or IgM at a 1:10 dilution (Fig. 7A, B). Under this condition, the day-4 serum depleted of IgM did not show any specific cell lysis (Fig. 7D), whereas the day-4 serum depleted of IgG showed a percentage of specific cell lysis similar to that shown by the nondepleted control (Fig. 7C). In contrast, depleted HMS showed the opposite pattern: no detectable specific lysis was shown by depletion of IgG (Fig. 7C), but depletion of IgM did not change the value (Fig. 7D). As controls, anti-mouse IgG or IgM used for depletion showed 0.00% specific lysis at a 1:10 dilution. These results indicated that the CDC assay can detect IgM class NS1 antibodies.
FIG. 7.
Percentages of specific cell lysis obtained with the day-4 serum or HMS depleted of IgG or IgM as determined by the one-dilution method of the CDC assay. Serum was incubated with anti-mouse IgG or IgM and examined for depletion by a sandwich ELISA for measuring IgG (A) or IgM (B) levels and for percentages of specific lysis in sera depleted of IgG (C) or IgM (D). IgG levels obtained from the day-4 serum (closed circles) or HMS (open circles), IgM levels obtained from the day-4 serum (closed triangles) or HMS (open triangles), and percentages of specific lysis obtained from the IgG/IgM-depleted day-4 sera (closed squares) or HMS (open squares) are shown. The abscissa indicates dilutions of anti-mouse IgG or IgM used for depletion. None indicates a control in which sera were incubated with PBS in place of diluted anti-mouse IgG or IgM. The ordinate indicates relative IgG or IgM levels contained in depleted serum as determined by a sandwich ELISA (upper graphs) or percentages of specific lysis obtained with depleted serum by the CDC assay (lower graphs).
No detectable nonspecific reactions against natural IgM antibodies.
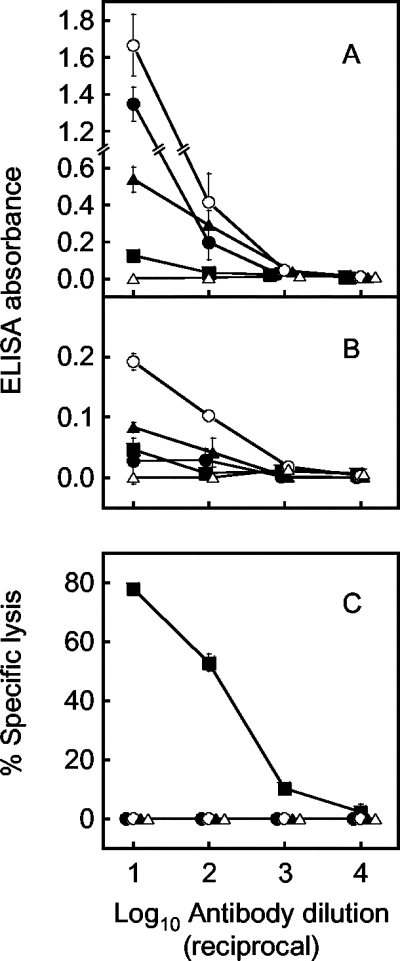
The results depicted in Fig. 6 show that ELISA was able to detect IgM antibodies in only one of the three groups on day 2, whereas the CDC assay determined that all three groups were positive. A probable factor affecting the ELISA result is the natural IgM antibodies that are contained in almost all sera (6). To investigate the effects of the natural IgM antibodies on the assay results, three monoclonal antibodies generated from naïve mice, as well as the day-4 serum, were examined for NS1 antibodies by the CDC assay and ELISA (Fig. 8). In Fig. 8, ELISA absorbances obtained only with antigen-sensitized wells, which more effectively exhibit net reactivities caused by natural antibodies (Fig. 8A), are shown, as well as the absorbance differences from nonsensitized wells (Fig. 8B).
FIG. 8.
Comparison of ELISA (A and B) to the CDC assay (C) using natural IgM antibodies. The ELISA results show absorbances obtained with antigen-sensitized wells (A) and differences from those obtained with nonsensitized wells (B). Natural antibodies were obtained in an ascites form from mice inoculated with hybridoma clones 1D12 (closed circles), 5A5 (open circles), and 6A11 (closed triangles), as well as with control P3U1 cells (open triangles). For comparison, the day-4 serum (closed squares) was used. Each datum represents an average obtained in two separate experiments (standard deviations are indicated by bars).
All three monoclonal antibodies showed ELISA reactions at higher levels than did the day-4 serum at dilutions of 1:101 and 1:102 in antigen-sensitized wells (Fig. 8A), whereas these monoclonal antibodies did not show any specific lysis. This is in contrast to the day-4 serum, which showed high percentages of specific lysis (Fig. 8C). Subtraction of absorbances obtained with nonsensitized wells from those obtained with antigen-sensitized wells still showed positive values (Fig. 8B). Ascites from P3U1-inoculated mice used as controls did not show any reactions on either ELISA or the CDC assay. These results clearly indicated that the CDC assay detects specific, but not natural, IgM antibodies.
DISCUSSION
The present study demonstrated that the antibody-mediated complement-dependent cytotoxicity mechanism can be used for measuring low levels of antibodies to JEV NS1 induced in naturally infected horses or during the early phase of experimental infection in mice. Specific NS1 antibodies, when present in a test sample, may bind to the NS1 antigen expressed on the surface of MF6 cells. The antigen-antibody complex may induce complement activation, and the final product (the C5b-9 membrane attack complex) may lyse the cells. Thus, the LDH activity released into the medium represents the level of NS1 antibodies in the test sample. In the present experiments, the percentages of specific cell lysis depended on the level of dilution of the serum samples. Quantitative and qualitative comparisons using horse sera indicated that the CDC assay correlated and agreed with two different previously established methods for measuring NS1 antibodies.
Almost all sera from nonimmune animals (10 of 10 mice and 40 of 42 horses) showed no nonspecific cell lysis in the CDC assay, at least at the dilution used for the one-dilution method (1:10). In addition, monoclonal antibodies exhibiting a low-affinity and multireactive nature (natural antibodies) did not show any detectable specific lysis. CDC is considered a specific host immune mechanism against viral infections (24), and here it seems to have brought that high specificity to the antibody assays. That is, the CDC assay established in the present study for measuring NS1 antibodies is based on the ability of the complement to differentiate specific from nonspecific antigen-antibody reactions. The specificity of the assay system increases the reliability for measurements of low levels of antibodies.
It has been reported that CDC is induced by antibodies of the IgM class as well as of the IgG class (1, 18). The assay method developed here, which utilized the principle of CDC, measured specific IgM antibodies with consistency, suggesting that this CDC assay can be applied to early serodiagnoses. Experiments using sera successively collected from mice after infection indicated that, on day 2, all three of the pooled sera showed detectable specific lysis, but only one showed a positive result in the ELISA that measured IgM antibodies. The basic reason for this difference is the level of the cutoff value. More precisely, nonspecific reactions were completely blocked in all nonimmune mouse sera in the CDC assay, whereas some levels of nonspecific reactions provided by nonimmune mouse sera in ELISA increased the cutoff value, which was calculated from their average values and the standard deviations.
Subtraction of the absorbances obtained with nonsensitized wells from those obtained with antigen-sensitized wells generally has been the method used to minimize nonspecific reactions occurring in ELISA. The ELISA results shown in Fig. 8A are absorbances obtained only with antigen-sensitized wells, which decreased when those obtained with nonsensitized wells were subtracted (Fig. 8B). However, even when such a subtraction method is used, the experimental variations shown in both antigen-sensitized and nonsensitized wells lead to positive values, resulting in relatively high cutoff values for ELISA, as shown in Fig. 6. However, the CDC assay detects specific but not natural IgM antibodies, making it a more reliable testing method for detecting low levels of IgM antibodies in an early phase of infection. An advantage of the CDC assay is that it can measure both IgG and IgM antibodies at the same time; a disadvantage is that IgM antibodies are not differentiated from IgG ones. However, a simple depletion of IgG or IgM from the serum, for example, by incubation with anti-IgM or anti-IgG at a 1:10 dilution, as performed in the present study (Fig. 7), can overcome this disadvantage.
The CDC assay presented here has some other advantages over the two previously established methods for measuring NS1 antibodies, immunostaining (13, 14) and ELISA (12). Since the results are obtained as numerals, the CDC assay is more objective than the immunostaining method; this is probably the reason for the finding that the CDC assay was more significantly correlated and consistent with ELISA than with the immunostaining method (Fig. 4, Table 1). Unlike the procedure for ELISA, the CDC assay does have a cumbersome element in its procedure, since the method requires live cells. However, the number of incubation steps is smaller for the CDC assay (three steps) than the ELISA (five steps), and the time period required for the CDC assay (3 to 4 h) is shorter than that for the ELISA (approximately 5 h). Thus, this procedure is considered suitable for testing large numbers of samples in a limited time period. We are currently undertaking a survey of JEV NS1 antibodies from recently collected equine sera and also are investigating the establishment of a CDC assay to detect NS1 antibodies in human sera.
Reliable measurements of low levels of specific antibodies greatly contribute to diagnoses of infectious diseases, such as those for identifying asymptomatic infections for safety tests of donated blood samples and for the early screening of infections with teratogenic agents in pregnant women. Theoretically, the newly developed method utilizing complement-dependent cytotoxicity can measure antibodies in any animal species by using the same test reagents, thus being useful for applications in both medical and veterinary fields.
Acknowledgments
This study was supported in part by a grant from Research on Emerging and Re-emerging Infectious Diseases, the Ministry of Health and Welfare of Japan, Research for Promoting Technological Seeds, Japan Science and Technology Agency, and the Japan Racing Association.
Footnotes
Published ahead of print on 21 November 2007.
REFERENCES
- 1.Boere, W. A., B. J. Benaissa-Trouw, T. Harmsen, T. Erich, C. A. Kraaijeveld, and H. Snippe. 1986. The role of complement in monoclonal antibody-mediated protection against virulent Semliki Forest virus. Immunology 58:553-559. [PMC free article] [PubMed] [Google Scholar]
- 2.Chung, K. M., G. E. Nybakken, B. S. Thompson, M. J. Engle, A. Marri, D. H. Fremont, and M. S. Diamond. 2006. Antibodies against West Nile virus nonstructural protein NS1 prevent lethal infection through Fc gamma receptor-dependent and -independent mechanisms. J. Virol. 80:1340-1351. [DOI] [PMC free article] [PubMed] [Google Scholar]
- 3.Coligan, J. E., A. M. Kruisbeek, D. H. Margulies, E. M. Shevach, and W. Strober. 1996. Current protocols in immunology. John Wiley & Sons, Inc., New York, NY.
- 4.Falgout, B., M. Bray, J. J. Schlesinger, and C. J. Lai. 1990. Immunization of mice with recombinant vaccinia virus expressing authentic dengue virus nonstructural protein NS1 protects against lethal dengue virus encephalitis. J. Virol. 64:4356-4363. [DOI] [PMC free article] [PubMed] [Google Scholar]
- 5.Gates, D., A. Brown, and C. J. Wust. 1982. Comparison of specific and cross-reactive antigens of alphaviruses on virions and infected cells. Infect. Immun. 35:248-255. [DOI] [PMC free article] [PubMed] [Google Scholar]
- 6.Herzenberg, L. A. 2000. B-1 cells: the lineage question revisited. Immunol. Rev. 175:9-22. [PubMed] [Google Scholar]
- 7.Inoue, Y., Y. Ohashi, Y. Shimomura, R. Manabe, M. Yamada, S. Ueda, and S. Kato. 1990. Herpes simplex virus glycoprotein D. Protective immunity against murine herpetic keratitis. Investig. Ophthalmol. Vis. Sci. 31:411-418. [PubMed] [Google Scholar]
- 8.Jacobs, S. C., J. R. Stephenson, and G. W. G. Wilkinson. 1994. Protection elicited by a replication-defective adenovirus vector expressing the tick-borne encephalitis virus non-structural glycoprotein NS1. J. Gen. Virol. 75:2399-2402. [DOI] [PubMed] [Google Scholar]
- 9.Kipps, T. J. 1989. The CD5 B cell. Adv. Immunol. 47:117-185. [DOI] [PubMed] [Google Scholar]
- 10.Kitai, Y., M. Shoda, T. Kondo, and E. Konishi. 2007. Epitope-blocking enzyme-linked immunosorbent assay to differentiate West Nile virus from Japanese encephalitis virus infections in equine sera. Clin. Vaccine Immunol. 14:1024-1031. [DOI] [PMC free article] [PubMed] [Google Scholar]
- 11.Konishi, E. 1997. Monoclonal antibodies multireactive with parasite antigens produced by hybridomas generated from naive mice. Parasitology 115:387-393. [DOI] [PubMed] [Google Scholar]
- 12.Konishi, E., M. Shoda, N. Ajiro, and T. Kondo. 2004. Development and evaluation of an enzyme-linked immunosorbent assay for quantifying antibodies to Japanese encephalitis virus nonstructural 1 protein to detect subclinical infections in vaccinated horses. J. Clin. Microbiol. 42:5087-5093. [DOI] [PMC free article] [PubMed] [Google Scholar]
- 13.Konishi, E., M. Shoda, and T. Kondo. 2004. Prevalence of antibody to Japanese encephalitis virus nonstructural 1 protein among racehorses in Japan: indication of natural infection and need for continuous vaccination. Vaccine 22:1097-1103. [DOI] [PubMed] [Google Scholar]
- 14.Konishi, E., and T. Suzuki. 2002. Ratios of subclinical to clinical Japanese encephalitis (JE) virus infections in vaccinated populations: evaluation of an inactivated JE vaccine by comparing the ratios with those in unvaccinated populations. Vaccine 22:98-107. [DOI] [PubMed] [Google Scholar]
- 15.Konishi, E., M. Yamaoka, K.-S. Win, I. Kurane, K. Takada, and P. W. Mason. 1999. Anamnestic neutralizing antibody response is critical for protection of mice from challenge following vaccination with a plasmid encoding Japanese encephalitis virus premembrane and envelope genes. J. Virol. 73:5527-5534. [DOI] [PMC free article] [PubMed] [Google Scholar]
- 16.Lin, Y. L., L. K. Chen, C. L. Liao, C. T. Yeh, S. H. Ma, J. L. Chen, Y. L. Huang, S. S. Chen, and H. Y. Chiang. 1998. DNA immunization with Japanese encephalitis virus nonstructural protein NS1 elicits protective immunity in mice. J. Virol. 72:191-200. [DOI] [PMC free article] [PubMed] [Google Scholar]
- 17.Massari, I., A. Donnini, K. Argentati, S. Straino, A. Mangoni, C. Gaetano, C. Viticchi, M. Capogrossi, and M. Provinciali. 2002. Age-dependent effects of repeated immunization with a first generation adenovirus vector on the immune response and transgene expression in young and old rats. Exp. Gerontol. 37:823-831. [DOI] [PubMed] [Google Scholar]
- 18.McLain, L., and N. J. Dimmock. 1993. A monoclonal antibody produced during infection which recognizes an epitope of influenza hemagglutinin only in the context of H-2k MHC class I antigen. J. Immunol. 150:3421-3426. [PubMed] [Google Scholar]
- 19.Schlesinger, J. J., M. W. Brandriss, C. B. Cropp, and T. P. Monath. 1986. Protection against yellow fever in monkeys by immunization with yellow fever virus nonstructural protein NS1. J. Virol. 60:1153-1155. [DOI] [PMC free article] [PubMed] [Google Scholar]
- 20.Schlesinger, J. J., M. Foltzer, and S. Chapman. 1993. The Fc portion of antibody to yellow fever virus NS1 is a determinant of protection against YF encephalitis in mice. Virology 192:132-141. [DOI] [PubMed] [Google Scholar]
- 21.Shu, P. Y., L. K. Chen, S. F. Chang, Y. Y. Yueh, L. Chow, L. J. Chien, C. Chin, T. H. Lin, and J. H. Huang. 2001. Antibody to the nonstructural protein NS1 of Japanese encephalitis virus: potential application of mAb-based indirect ELISA to differentiate infection from vaccination. Vaccine 19:1753-1763. [DOI] [PubMed] [Google Scholar]
- 22.Storch, G. A. 2001. Diagnostic virology, p. 493-531. In D. M. Knipe and P. M. Howley (ed.), Fields virology, 4th ed. Lippincott Williams & Wilkins, Philadelphia, PA.
- 23.West, K., and J. Ellis. 1997. Functional analysis of antibody responses of feedlot cattle to bovine respiratory syncytial virus following vaccination with mixed vaccines. Can. J. Vet. Res. 61:28-33. [PMC free article] [PubMed] [Google Scholar]
- 24.Whitton, J. L., and M. B. A. Oldstone. 2001. The immune response to viruses, p. 285-320. In D. M. Knipe and P. M. Howley (ed.), Fields virology, 4th ed. Lippincott Williams & Wilkins, Philadelphia, PA.


