Abstract
The ability of Saccharomyces cerevisiae to form morphologically complex colony-like structures called mats requires expression of the cell surface glycoprotein Flo11p and growth on a semisolid surface. As the mat grows, it forms two visually distinct populations called the rim (edge of the mat) and the hub (interior of the mat), which can be physically separated from one another based on their agar adherence properties. Here, we show that growth of the mat on a semisolid agar surface creates concentric glucose and pH gradients in the medium that are required for the differentiation of the hub and rim. Disruption of the pathways that respond to changing levels of glucose block mat formation by decreasing FLO11 expression. However, in wild-type cells, Flo11p is expressed in both portions of the structure. The difference in adherence between the rim and hub appears to be a consequence of the reduced adherence of Flo11p at the elevated pH of the rim.
Microbes exhibit “multicellular” behaviors such as swarming and the formation of colonies, fruiting bodies, and biofilms (1, 12, 26, 27, 28). All of these behaviors depend on cells that interact with one another and the local environment. For example, fruiting body formation in Myxococcus xanthus occurs in response to starvation conditions (12). Biofilm formation is regulated by more diverse stimuli, depending on the microbe, but can be divided into two basic categories, surface conditions and nutrient conditions (15, 16, 20). Many of these multicellular behaviors depend upon a solid support and are not manifest in liquid cultures.
Mat formation in the baker's yeast Saccharomyces cerevisiae has many of the features of other microbial multicellular behaviors. The formation of mats is dependent upon the nature of the surface, the concentration of glucose, and the genetic background of the strain (24). Mats are formed on semisolid agar surfaces (0.3%) and not in liquid, and experiments have shown that the surface is required for the initial formation of this structure (19).
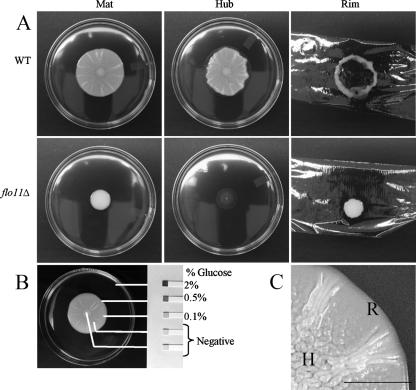
As S. cerevisiae grows on the wet surface of a semisolid agar petri plate, it forms a mat that spreads over the agar. The mat is a structure with an interior region called the hub, which is distinguished by channels and wrinkles, and a smooth periphery called the rim (Fig. 1C). Mat formation has been shown to be dependent on the FLO11 gene: a flo11Δ null mutant fails to form a mat but, instead, grows as a poorly spreading mass of cells (Fig. 1A) (24). FLO11 is a member of a superfamily of genes encoding cell-surface adhesin proteins found in S. cerevisiae and other yeasts including Candida albicans and Candida glabrata (31).
FIG. 1.
The mat adheres to the agar plate in a Flo11p-dependent manner and forms a glucose gradient. (A) Wild-type (WT) and flo11Δ strains were inoculated on the center of YPD plates containing 0.3% agar and grown at 23°C for 5 days (Mat). The strains were then overlaid with plastic wrap. This was removed by gripping both sides of the wrap and pulling up. The cells remaining adhered to the agar where photographed (Hub). The plastic wrap and cells that were removed with it were inverted and photographed (Rim). (B) Urinalysis strips (Bayer) were used to measure the glucose levels in different sections of the mat as indicated. The percentage (weight/volume) of glucose in the agar is indicated to the side of the strip. The lines indicate the sampling points. (C) The hub (H) and rim (R) of a wild-type mat are shown in greater detail. Bar, 0.5 cm.
In this report, we designed experiments to identify aspects of the semisolid surface that create differences between the rim and hub. We found that the mat forms glucose and pH gradients in the agar, and these gradients lead to alterations in mat formation. These results suggest that a higher pH in the rim may alter Flo11p function so that the mat is less adherent, thereby permitting the vanguard of the structure to continue spreading radially across the surface. The expression of FLO11 is maintained in both the rim and hub.
MATERIALS AND METHODS
Media.
The medium used in this study consisted of YPD made with yeast extract (VWR or Fisher), Bacto peptone (VWR), and dextrose (Fisher) (29). Plates were made with 2% agar for standard cell growth and maintenance. Low-agar plates were made with YPD medium and 0.3% agar (24). YPD plates containing 200 μg/ml G418 (Sigma or Fisher) were used to select transformants. YPD plates were buffered to pH 4.9, 5.4, or 5.8 by the addition of citrate buffer at pH 4.0, 4.5, or 5.0, respectively, to the medium to a final concentration of 20 mM.
Yeast strains.
All of the strains used in this study are from the yeast genetic background Σ1278b. They are all isogenic to the strain TBR1 (24) except where noted. The strains and their genotypes are shown in Table 1. Mutants were made by PCR-based gene disruptions using deletion mutants from the Yeast Knock Out Collection (Open Biosystems/Research Genetics) as templates (33). Strains in the Yeast Knock Out Collection carry gene disruptions in which the open reading frame (ORF) is replaced by the G418 resistance cassette kanMX4 (32). Primers (Table 2) were used to amplify DNA encompassing each deleted ORF plus ∼300 bp flanking either side of the ORF. The resulting PCR product was then transformed into TBR1 by standard lithium acetate transformation protocols (8), and transformants were selected on YPD plates containing 200 μg/ml G418 (24). PCR with primers (Table 2) that annealed outside of the disruption construct and inside the TEF promoter of the kanMX4 cassette (32) were used to confirm each disruption. Strains that were created by this approach were yak1Δ and ras2Δ. The snf1Δ mutant was made using the kanMX6 cassette from plasmid pFA6a-kanMX6 by a method described previously (17). The yeast strain L6906 (9, 10) carrying a hemagglutinin (HA)-tagged form of FLO11 (FLO11-HA) was used for the immunofluorescence analyses. The Flo11-HA protein carries a triple HA tag inserted between amino acids 30 and 31 in the N terminus of the protein.
TABLE 1.
Yeast strains used in this study
| Strain | Genotype | Reference |
|---|---|---|
| TBR1 | MATαura3-52 leu2::hisG his3::hisG | 24 |
| TRB5 | MATαura3-52 leu2::hisG his3::hisG flo11::kanMX6 | 24 |
| YTR140 | MATαura3-52 leu2::hisG his3::hisG yak1::kanMX4 | This study |
| YTR141 | MATαura3-52 leu2::hisG his3::hisG snf1::kanMX6 | This study |
| YTR142 | MATαura3-52 leu2::hisG his3::hisG ras2::kanMX4 | This study |
| L6906 | MATaura3-52 his3::hisG FLO11::HA | 10 |
TABLE 2.
Primers used in this study
| Primera | Purpose | Sequence |
|---|---|---|
| TRO369 | Confirm disruptions | GCACGTCAAGACTGTCAAGG |
| TRO158 | Disrupt YAK1 | TATCAAAATAGCGCGATGGC |
| TRO159 | Disrupt YAK1 | CTAGCCTCCTTTACGTTTTTACTT |
| TRO160 | Confirm yak1Δ | AGAATGACAATATCACTATTGTCGC |
| TRO309 | Disrupt SNF1 | ATAGAAGTTTTTTTTTGTAACAAGTTTTGCTACACTCCCTTAATAAAGTCCAGCTGAAGCTTCGTACGC |
| TRO310 | Disrupt SNF1 | AAGGGAACTTCCATATCATTCTTTTACGTTCCACCATCAATTGCTTTGACGCATAGGCCACTAGTGGATCTG |
| TRO94 | Confirm snf1Δ | CCAAGACATAGCTTTGGGCTT |
| TRO311 | Disrupt RAS2 | CAAGGTTCACATCAGCAAACA |
| TRO312 | Disrupt RAS2 | ATTCCAGGTGGAACACCTCTT |
| TRO313 | Confirm ras2Δ | TGACATTTAGGACGGTGAAGC |
| FLO11 fw | RT primer FLO11 Sybr Green | CACTTTTGAAGTTTATGCCACACAAG |
| FLO11 rev | RT primer FLO11 Sybr Green | CTTGCATATTGAGCGGCACTAC |
| ACT1 fw | RT primer ACT1 Sybr Green | CTCCACCACTGCTGAAAGAGAA |
| ACT1 rev | RT primer ACT1 Sybr Green | CCAAGGCGACGTAACATAGTTTT |
| SNR190 fw | RT primer SNR190 Sybr Green | TCTTTCCTCGTCCGATTCGA |
| SNR190 rev | RT primer SNR190 Sybr Green | TCATTCGCATTAAGAGAACGAGAT |
TRO369 was used as a reverse primer in combination with the primers listed as confirming primers to confirm disruptions on the chromosome by PCR. fw, forward; rev, reverse.
Overlay adhesion assay.
Strains were grown on low-agar plates at ∼23°C for 5 days, and then a piece of either Saran or Reynolds brand commercial plastic wrap was laid over the top of the strain and allowed to adhere to the surface by capillary action. Enough plastic was left on either side so that it could be gripped without touching the agar, and it was then removed by pulling up evenly on both sides. The plastic was inverted and laid on a copy stand and photographed in order to document the non-agar-adherent cells (rim). The cells remaining on the agar were also photographed to document agar-adherent cells (hub).
Northern blotting.
Northern blotting was performed as described by Sambrook and Russell (25) using Church buffer for prehybridization and hybridization steps (6). A Techne Hybrigene oven set at 65°C was used for all incubation and wash steps. The cells were grown in liquid YPD medium to logarithmic phase (optical density at 600 nm [OD600] of between 0.5 and 1.0) or post-logarithmic phase (diauxy; OD600 of ∼4.0; cells began growing very slowly and doubled only once more over the next 24 h). The cells were collected by centrifugation, aspirated, flash-frozen in a bath of dry ice and methanol, and stored at −80°C. Total RNA was collected by acid-phenol extraction (13), and 10 μg of total RNA was subjected to Northern blotting analysis. A PCR product (using primer TRO367, ATGCAAAGACCATTTCTACTCG, and primer TRO368, TGCCAGGAGCTTGCATATTGAG) corresponding to the first 484 bp of the FLO11 ORF was used to probe the total RNA. The probe was labeled with [α-32P]dATP using a Stratagene Prime-It II random primer kit, and following probing, the blots were visualized on a Storm Phosphorimager. The data were quantified using ImageQuant software, and FLO11 expression for each strain was normalized to bands from 28S rRNA quantified on a Bio-Rad Chemidoc XRS photodocumentation system using QuantityOne software from Bio-Rad.
Real-time RT-PCR.
Seven-day-old mats were utilized for real-time reverse transcription-PCR (RT-PCR). A Pipetman was used to pipette up cells from the rim, the hub, or what was referred to as the “middle,” an intermediate area in between the rim and the hub. The isolated cells were added to ∼25 ml of ice-cold water, pelleted by centrifugation at 4°C, and washed with 1 ml of ice-cold water (during which time they were transferred to a microcentrifuge tube), and the washed pellet was frozen at −80°C. This process was carried out on ice for each sample within 10 min to ensure optimal preservation of the mRNA. Total RNA was isolated as described previously (23). Total RNA was further purified and treated with DNase twice using an RNeasy Mini Kit (Qiagen 74104). Reverse transcription was performed using TaqMan reverse transcription reagents (catalog no. N808-0234; Applied Biosystems) according to the manufacturer's standard protocol, and real-time PCR was performed with Sybr Green PCR Master Mix (catalogue no. 4309155; Applied Biosystems) or TaqMan Universal PCR Master Mix without AmpErase uracil-N-glycosylase (catalog no. 4326614; Applied Biosystems) on an Applied Biosystems 7500 RT-PCR system using a two-step program (15 s melting at 95°C and 60 s annealing-extension at 60°C).
Immunofluorescence of Flo11 on the cell surface of cells from the rim and hub.
Mats were grown on low-agar plates for 5 days, and then a pipette tip, cut off at the end to create a wider bore, was used to collect cells from the rim or hub of the mat. The cells were resuspended in phosphate-buffered saline (PBS) with 4% formaldehyde and fixed for 1 h at room temperature. The cells were washed with PBS, blocked with PBS-2% bovine serum albumin (BSA), and incubated with anti-HA antibody (HA.11; Covance) for 1 h. The cells were washed three times with PBS-2% BSA, incubated with goat anti-mouse secondary antibody conjugated to Cy3 (Jackson Immunobiology), washed three times with PBS-2% BSA again, resuspended in PBS-2% BSA, and viewed on an Olympus BX50 microscope.
RESULTS
Fractionation of cells from the rim and hub of the mat.
Growth on low-agar plates produced a clear visual differentiation between the cells at the rim and those at the hub of a wild-type mat (Fig. 1C). In order to analyze the two populations of cells, we overlaid the mat with plastic wrap. When the plastic wrap was withdrawn, the nonadherent cells at the rim were drawn up with the wrap (Fig. 1A, rim), whereas the agar-adherent cells in the hub remained behind (Fig. 1A, hub).
This analysis revealed a new aspect of mat formation: the growing mat could be partitioned into two distinct subpopulations based on agar adherence properties. The point on the growing mat at which the appearance changed from smooth (rim) to channel-ridden (hub) (Fig. 1C) is also the point at which the adherence phenotype changed. By contrast, the flo11Δ strain, which is uniformly smooth, failed to adhere to the agar and was completely removed from the agar by the plastic wrap (Fig. 1A).
A glucose gradient is present in the mat and influences its development.
Since a low glucose concentration promotes adhesion of Saccharomyces cells to polystyrene (24), we determined whether there was a gradient of glucose that correlated with the different cell populations revealed by the overlay adhesion assay. This analysis revealed that the uniform glucose level present prior to growth of the mat (2%) was replaced during growth by a concentration gradient that decreased from the rim toward the hub (Fig. 1B). Thus, there is a gradient of glucose in the growing mat such that the concentration is higher at the rim and lower at the hub.
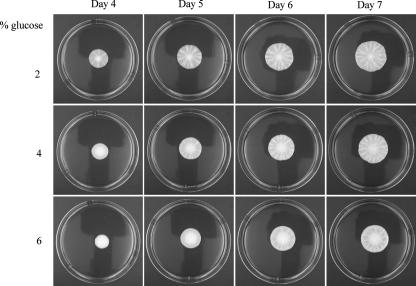
Glucose limitation appeared to be an important signal for regulating mat formation, but other nutrients could be depleted in the hub and might play a role as well. If glucose is the key nutrient in regulating mat formation, then medium containing increased levels of glucose, but identical levels of all other components, should slow mat formation. Plates were poured that contained 1% yeast extract, 2% peptone, and 2%, 4%, or 6% glucose. It was found that, in comparison to 2% glucose plates, hub formation was delayed by 1 day or 2 days in plates containing 4% or 6% glucose, respectively (Fig. 2).
FIG. 2.
Increased glucose concentrations delay mat formation. The wild-type (TBR1) strain was inoculated onto the center of YPD plates with 0.3% agar containing 2%, 4%, or 6% glucose and grown at 23°C for 7 days.
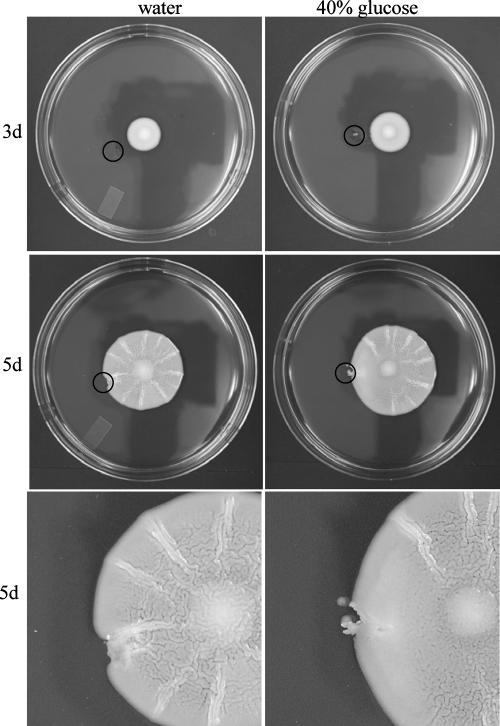
Although a glucose gradient is formed in the growing mat (Fig. 1B), it was unclear if the gradient itself was required for mat formation. In order to test this, the gradient was perturbed in a mat by the addition of glucose to the medium outside of the growing mat. If a glucose gradient were required for maturation of the mat, then the addition of glucose to one side of the mat should slow maturation of the mat on the side to which glucose was added. After a wild-type mat had grown for 3 days, a small pit was dug in the agar outside of the mat with a pipette tip, and 50 μl of 40% glucose or water was added to the pit (Fig. 3, 3d). After an additional 2 days of growth, the mat growing near the pit containing 40% glucose underwent mat formation normally except for a large smooth region of the mat immediately adjacent to the pit. This region lacked the channels typical of the developing mat (Fig. 3). Conversely, the mat facing the pit containing water underwent mat formation normally on all sides (Fig. 3).
FIG. 3.
Disruption of the glucose gradient perturbs mat formation. The glucose gradient set up within the growing mat was perturbed by adding 50 μl of 40% glucose or water as a negative control to a pit dug in the agar at day 3 (3d). After two more days (5d) the plates were examined and photographed. The black circles mark the pit in the agar where the glucose or water was added.
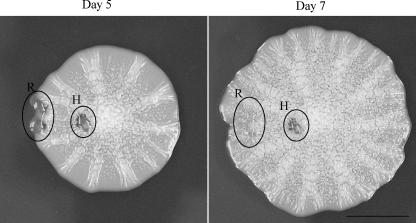
The fact that a gradient of glucose drives mat formation and that the hub is depleted of glucose compared to the rim suggested that cells in the rim were actively growing whereas those in the hub had stopped growing. This was tested by a “healing” assay. The mat was damaged by using a pipette tip to tear a hole in both the rim and the hub on day 5 (Fig. 4). Two days later (day 7), the hole made in the rim was detectable only as a depression in the agar beneath the mat as cells had proceeded to grow over it. Conversely, the hole in the hub looked much like it had at day 5 with only slight changes in appearance (Fig. 4). This result indicated that the cells in the hub exhibited little to no growth, whereas the cells in the rim continued to divide and spread.
FIG. 4.
Cells in the rim (R) are actively growing whereas cells in the hub (H) exhibit very little growth. Wild-type (TBR1) yeast was grown on YPD-0.3% agar plates, and at day 5 a pipette tip was used to gouge a hole in the hub and rim. The mat was then grown for an additional 2 days.
Glucose-sensing genes control mat formation and FLO11 expression.
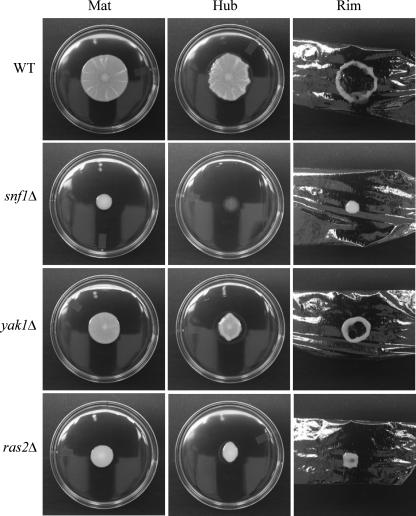
Several signaling pathways are associated with sensing glucose levels and regulating filamentous growth in S. cerevisiae. These pathways include the Ras/cyclic AMP, Snf1p kinase, and Yak1p kinase pathways. Genes representing these pathways include SNF1 (3), YAK1 (18), and RAS2 (11). SNF1 has been shown to be required for mat formation on low agar (21), biofilm formation on plastic, FLO11 expression (14), and filamentous growth on solid 2% agar (7). Isogenic mutants for these genes were generated in the strain TBR1 (24) and tested for mat formation. Disruptions of SNF1, YAK1, or RAS2 all caused defects in mat formation (Fig. 5). Although they differed in the extent of their adhesion defects (Fig. 5), all three mutants formed few or no discernible channels and spread poorly.
FIG. 5.
Strains carrying mutations that interfere with glucose signaling exhibit defects in mat formation. Strains were inoculated onto the center of YPD plates containing 0.3% agar, grown at 23°C for 5 days (Mat), and subjected to the overlay adhesion assay. Strain names are marked to the left. The snf1Δ mutant did not spread or form patterns and was nonadherent to the agar surface. The ras2Δ mutant was more adhesive than the snf1Δ mutant but spread poorly and formed no channels. The yak1Δ mutant spread better than the snf1Δ or ras2Δ mutants and formed a few shallow channels which correlated with the formation of a reduced, but distinguishable hub. WT, wild type.
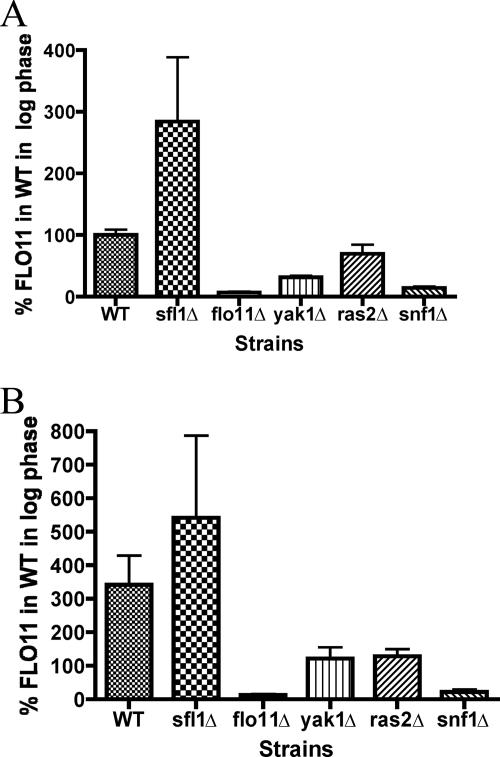
The three glucose-sensing mutants, yak1Δ, ras2Δ, and snf1Δ, were tested for their effects on FLO11 expression. It was found that all three mutants caused a decrease in FLO11 expression compared to the wild-type strain when grown to exponential phase in liquid YPD medium containing 2% glucose (Fig. 6A). The ras2Δ mutant did not cause a strong decrease in FLO11 expression compared to the yak1Δ or snf1Δ mutants. However, when the three mutants were compared to wild type in liquid YPD medium during glucose stress (growth to post-exponential phase), the ras2Δ mutant, like the yak1Δ and snf1Δ mutants, showed a significant decrease in FLO11 expression (Fig. 6B).
FIG. 6.
Mutants in glucose-sensing pathways have variable effects on FLO11 expression. Wild-type and mutant strains were grown in YPD medium to logarithmic phase (OD600 of 0.5 to 1.0) (A) or post-logarithmic phase (OD600 of ∼4.0) (B) where the cells are beginning to experience the diauxic shift. The cells were then collected by centrifugation, and RNA was extracted, Northern blotted, and probed for FLO11. The results were visualized and quantified on a Storm Phosphorimager with ImageQuant software. The quantification of FLO11 was normalized to the amount of rRNA isolated from each sample. The graphs represent the results of three biological replicates and are presented as the percentage of FLO11 expressed by the wild-type strain (WT) at log phase. The flo11Δ and sfl1Δ (overexpresses FLO11) strains were included as controls for specificity of the FLO11 probe.
Flo11p is expressed on the surface of cells in the rim and hub.
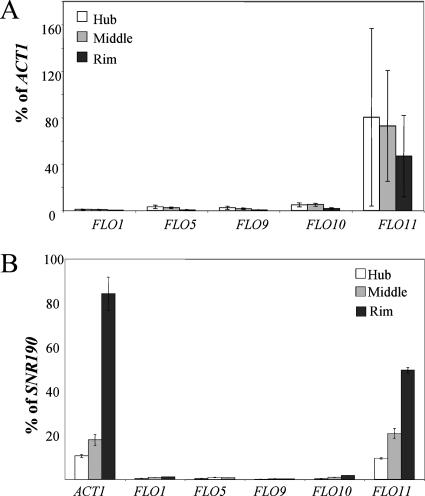
Since the glucose-sensing genes affect the expression of FLO11 and glucose levels are lower in the hub, the morphological differences between the rim and the hub could be a consequence of FLO11 expression. FLO11 mRNA levels were measured in the rim, the intermediate region where the rim and hub meet (middle), and the center of the hub by real-time RT-PCR. If ACT1 is used to normalize the FLO11 levels, there is no significant difference in FLO11 mRNA levels between the rim and hub (Fig. 7A). By contrast, if SNR190 is used for normalization, FLO11 mRNA levels appear highest in the rim and lowest in the hub (Fig. 7B). This difference in expression is also observed in the ACT1 mRNA levels, which appear to be higher in the rim than the hub when SNR190 is used for normalization (Fig. 7B). ACT1 levels are affected by the growth state of cells (5, 22), but SNR190 levels are stable between cells in logarithmic and stationary phase (7a). The indeterminate growth state of cells in the hub makes an accurate measurement of FLO11 mRNA levels difficult, but it is clear that FLO11 mRNA is expressed in both parts of the mat.
FIG. 7.
FLO11 is expressed in the rim, hub, and intermediate (middle) regions of the mat, but the other FLO genes are not expressed. (A) Real-time RT-PCR was used to measure the expression of FLO11 and the other FLO genes, and the levels of expression were normalized to ACT1. (B) Real-time RT-PCR was used to measure the expression of FLO11, the other FLO genes, and ACT1, and the levels of expression were normalized to SNR190.
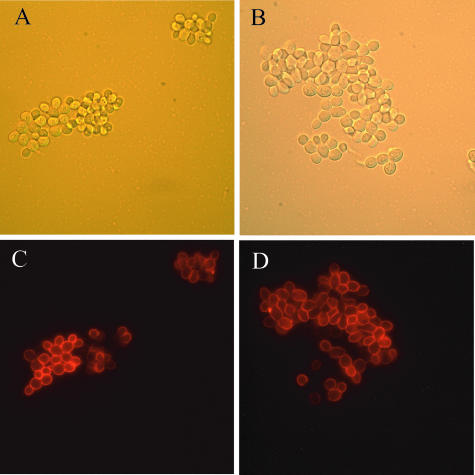
The availability of a strain expressing a functional version of Flo11p with an HA tag (10) permitted a direct assessment of the levels of Flo11p on the surface of cells in the rim and hub. This strain, containing the FLO11::HA construct inserted into the chromosome at the FLO11 locus, forms mats like the wild-type strain. The percentage of cells expressing Flo11p on their surfaces was assessed by indirect immunofluorescence and was found to be the same in the rim and hub (38% ± 2% and 38% ± 5%, respectively) (Fig. 8). As has been previously reported (10), there was heterogeneity of FLO11 expression among the cells, but there did not appear to be any difference in the distribution of the cells expressing Flo11p in the two populations.
FIG. 8.
Flo11-HA was expressed at similar levels in both the rim and hub of the mat. Cells were collected from both the rim (A and C) and hub (B and D). Cells were stained with an anti-HA monoclonal antibody and viewed by differential interference contrast (A and B) and fluorescence (C and D) microscopy using indirect immunofluorescence.
The same RNAs from the rim, hub, and middle that were used to assess the FLO11 levels were used to ascertain the levels of the other FLO genes (FLO1, FLO5, FLO9, and FLO10), which are known to affect aggregation and adhesion (30, 31). Although strains from the ∑1278b background do not express these other FLO genes in liquid, they might be expressed on the low-agar petri dishes. Analysis of these transcript levels by real-time RT-PCR using primers specific for these genes showed no significant expression in any portion of the mat using either ACT1 or SNR190 as a normalization standard (Fig. 7A and B, respectively).
Mat formation is controlled by a pH gradient.
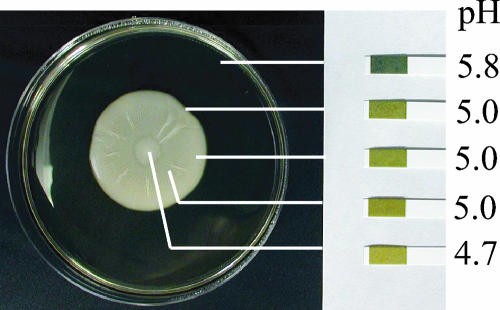
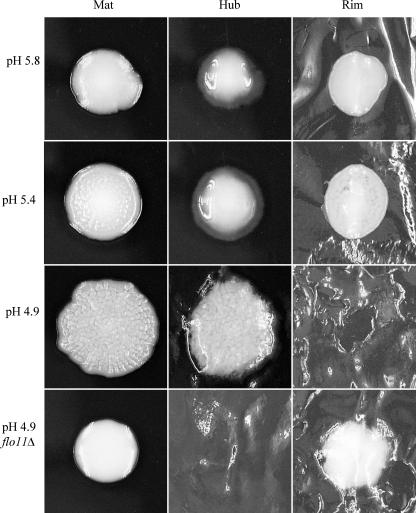
Analysis of the mat revealed that in addition to the glucose gradient (Fig. 1B), the mat also established a pH gradient. The pH of the medium was originally 5.8 but was altered by the yeast, and after growth of the mat, a pH gradient formed between the sites of the hub (4.7) and rim (5.0) (Fig. 9). Moreover, the cells at the edge of the rim were juxtaposed to medium at pH 5.8. To test whether the pH gradient was an important component in the differentiation of the mat, the pH of the medium was buffered with 20 mM citrate buffer to a final pH of 4.9, 5.4, or 5.8, and mat formation was initiated on these plates (Fig. 10). Wild-type mats growing on plates buffered with citrate buffer exhibited generally decreased spreading compared to mats growing on plates without citrate buffer (Fig. 1A). A slight rim and hub region could be detected in mats grown on plates buffered to pH 5.4, based on appearance (Fig. 10). However, at pH 5.8, the channels that characterize the hub did not form, and the surface of the whole mat was smooth. In the cases of both types of plates (pH 5.4 and 5.8), the surfaces of the whole mats were removed by the overlay adhesion assay (Fig. 10). In contrast, the entire surfaces of mats formed on pH 4.9 plates resembled hubs, and no material could be removed from the surface of the plate using the overlay adhesion assay (Fig. 10). This strong adherence at pH 4.9 is dependent on FLO11 as the flo11Δ mutant was completely removed from pH 4.9 plates during the overlay adhesion assay (Fig. 10).
FIG. 9.
Mat formation correlates with a gradient of pH. pH strips were used to measure the pH of medium outside the mat and inside the rim and the hub. The pH values are indicated next to the strips. The lines indicate the sampling points.
FIG. 10.
pH controls mat formation. Wild-type or flo11Δ strains were inoculated onto low-agar YPD plates that were buffered to pH 4.9, 5.4, and 5.8 with 20 mM Na citrate buffer; cultures were grown for 5 days at 23°C and photographed. The mat in each case was then subjected to the overlay adhesion assay.
DISCUSSION
Gradients of glucose in the petri dish may maintain the expression of FLO11.
The semisolid support of the agar plate permits the maintenance of the multiple gradients required for formation of the mat. Previous studies have shown that mat formation is enhanced by low glucose (24). The concentration of glucose is modulated in the petri plate to create a glucose gradient, from the lowest concentration in the hub to the highest in the rim (Fig. 1B). As we have shown, glucose-sensing pathways are required for the upregulation of FLO11 transcription under low glucose concentrations (Fig. 6B). Loss of glucose sensing results in attenuation of mat formation (Fig. 5).
One possibility is that the glucose gradient helps to maintain Flo11 protein at a relatively constant level throughout the mat. As the cells in the hub are no longer growing (Fig. 4), glucose sensing may provide a compensatory mechanism to ensure that Flo11p is maintained at the cell surface.
Flo11 protein is expressed throughout the mat.
The finding that the FLO11 transcript is expressed throughout the mat is consistent with the requirement of FLO11 for mat formation but raised the question of why cells at the hub were more adherent than those at the rim. One possibility was that Flo11 protein was not properly expressed at the cell surface in rim cells but was in hub cells. In order to function, Flo11p must transit the secretory pathway, arrive at the plasma membrane, and be cross-linked to the cell wall (31). Alterations in any of the steps along this pathway could lead to failure of Flo11p to be properly displayed at the cell surface. However, using a tagged version of FLO11 (Fig. 8), we showed that there are roughly the same proportion of cells in the rim and the hub with Flo11p on the surface. Moreover, the distribution of the fluorescence was ostensibly the same in the rim cells as it was in the cells within the hub. These methods did not measure protein levels of Flo11p and thus would only detect gross differences in Flo11p on the cell surface. Nonetheless, there is no obvious difference in protein expression or distribution in the populations.
Other FLO genes are not differentially activated in the mat.
Of the five members of the FLO gene family (FLO1, FLO5, FLO9, FLO10, and FLO11), only FLO11 is transcribed in the ∑1278b strains we used. The other FLO genes are normally transcriptionally silenced (31). However, it was possible that one or more of these silenced genes was transcribed either in the rim or hub under the unique conditions of mat formation. This model would likely require that one of these normally silent FLO genes be coexpressed with FLO11 as none of the other FLO genes tested (FLO1 and FLO10) can compensate for the loss of FLO11 function during mat formation in the flo11Δ strain. In addition, disruption of FLO1, FLO5, or FLO10 had no effect on mat formation (T. B. Reynolds and G. R. Fink, unpublished data). This desilencing hypothesis appears to be ruled out by our finding by real-time RT-PCR that there are very low levels of FLO1, FLO5, FLO9, or FLO10 transcription in the rim and hub (Fig. 7A and B). Of course, there could be other cell surface genes that are required, but they also must cooperate with FLO11. There are more than 38 genes encoding glycosylphosphatidylinositol-linked cell wall proteins in yeast (4), leaving a number of other possibilities.
Gradients of pH in the petri dish affect mat formation.
The fact that the mat establishes a pH gradient within itself may provide an explanation for the differential adherence between the rim and hub (Fig. 9). Flo11p-dependent adhesion has been shown to be dependent on pH, increasing as the pH decreases between values of 5.5 and 3.9 (2). The pH in the hub is ∼4.7, but it is 5.0 in the rim and higher adjacent to the rim (Fig. 9). The importance of the pH gradient was supported by experimentation showing that stabilization of the pH in solid medium alters the level of adhesion exhibited by mat cells (Fig. 10). This gradient of decreasing pH appears to contribute to the formation of the mat by increasing Flo11p-dependent adhesion in the hub of the mat compared with the rim.
Conclusion.
Mat formation is dependent on gradients of glucose and pH established by the growing cell population. These gradients correlate with changes in both the expression and the function of Flo11p, which is necessary for this phenotype.
Acknowledgments
We make a grateful acknowledgment in memory of Cora Styles for many helpful discussions and suggestions. We also thank the Affymetrix microarray facility at the Whitehead Institute/MIT Center for Genome Research for help with the microarray work.
This work was supported by NIH grants GM35010, GM40266 (G.R.F.), and F32GM020565 (T.B.R.).
Footnotes
Published ahead of print on 19 October 2007.
REFERENCES
- 1.Allison, C., and C. Hughes. 1991. Bacterial swarming: an example of prokaryotic differentiation and multicellular behaviour. Sci. Prog. 75403-422. [PubMed] [Google Scholar]
- 2.Bayly, J. C., L. M. Douglas, I. S. Pretorius, F. F. Bauer, and A. M. Dranginis. 2005. Characteristics of Flo11-dependent flocculation in Saccharomyces cerevisiae. FEMS Yeast Res. 51151-1156. [DOI] [PubMed] [Google Scholar]
- 3.Carlson, M. 1999. Glucose repression in yeast. Curr. Opin. Microbiol. 2202-207. [DOI] [PubMed] [Google Scholar]
- 4.Caro, L. H., H. Tettelin, J. H. Vossen, A. F. Ram, H. van den Ende, and F. M. Klis. 1997. In silicio identification of glycosyl-phosphatidylinositol-anchored plasma-membrane and cell wall proteins of Saccharomyces cerevisiae. Yeast 131477-1489. [DOI] [PubMed] [Google Scholar]
- 5.Choder, M. 1991. A general topoisomerase I-dependent transcriptional repression in the stationary phase in yeast. Genes Dev. 52315-2326. [DOI] [PubMed] [Google Scholar]
- 6.Church, G. M., and W. Gilbert. 1984. Genomic sequencing. Proc. Natl. Acad. Sci. USA 811991-1995. [DOI] [PMC free article] [PubMed] [Google Scholar]
- 7.Cullen, P. J., J. Schultz, J. Horecka, B. J. Stevenson, Y. Jigami, and G. F. Sprague, Jr. 2000. Defects in protein glycosylation cause SHO1-dependent activation of a STE12 signaling pathway in yeast. Genetics 1551005-1018. [DOI] [PMC free article] [PubMed] [Google Scholar]
- 7a.Duina, A. A., and F. Winston. 2004. Analysis of a mutant histone H3 that perturbs the association of Swi/Snf with chromatin. Mol. Cell. Biol. 24561-572. [DOI] [PMC free article] [PubMed] [Google Scholar]
- 8.Gietz, R. D., and R. A. Woods. 2002. Transformation of yeast by lithium acetate/single-stranded carrier DNA/polyethylene glycol method. Methods Enzymol. 35087-96. [DOI] [PubMed] [Google Scholar]
- 9.Guo, B., C. A. Styles, Q. Feng, and G. R. Fink. 2000. A Saccharomyces gene family involved in invasive growth, cell-cell adhesion, and mating. Proc. Natl. Acad. Sci. USA 9712158-12163. [DOI] [PMC free article] [PubMed] [Google Scholar]
- 10.Halme, A., S. Bumgarner, C. Styles, and G. R. Fink. 2004. Genetic and epigenetic regulation of the FLO gene family generates cell-surface variation in yeast. Cell 116405-415. [DOI] [PubMed] [Google Scholar]
- 11.Howard, S. C., Y. W. Chang, Y. V. Budovskaya, and P. K. Herman. 2001. The Ras/PKA signaling pathway of Saccharomyces cerevisiae exhibits a functional interaction with the Sin4p complex of the RNA polymerase II holoenzyme. Genetics 15977-89. [DOI] [PMC free article] [PubMed] [Google Scholar]
- 12.Jelsbak, L., and L. Sogaard-Andersen. 2003. Cell behavior and cell-cell communication during fruiting body morphogenesis in Myxococcus xanthus. J. Microbiol. Methods 55829-839. [DOI] [PubMed] [Google Scholar]
- 13.Kohrer, K., and H. Domdey. 1991. Preparation of high molecular weight RNA. Methods Enzymol. 194398-405. [DOI] [PubMed] [Google Scholar]
- 14.Kuchin, S., V. K. Vyas, and M. Carlson. 2002. Snf1 protein kinase and the repressors Nrg1 and Nrg2 regulate FLO11, haploid invasive growth, and diploid pseudohyphal differentiation. Mol. Cell. Biol. 223994-4000. [DOI] [PMC free article] [PubMed] [Google Scholar]
- 15.Kuchma, S. L., and G. A. O'Toole. 2000. Surface-induced and biofilm-induced changes in gene expression. Curr. Opin. Biotechnol. 11429-433. [DOI] [PubMed] [Google Scholar]
- 16.Lejeune, P. 2003. Contamination of abiotic surfaces: what a colonizing bacterium sees and how to blur it. Trends Microbiol. 11179-184. [DOI] [PubMed] [Google Scholar]
- 17.Longtine, M. S., A. McKenzie, 3rd, D. J. Demarini, N. G. Shah, A. Wach, A. Brachat, P. Philippsen, and J. R. Pringle. 1998. Additional modules for versatile and economical PCR-based gene deletion and modification in Saccharomyces cerevisiae. Yeast 14953-961. [DOI] [PubMed] [Google Scholar]
- 18.Moriya, H., Y. Shimizu-Yoshida, A. Omori, S. Iwashita, M. Katoh, and A. Sakai. 2001. Yak1p, a DYRK family kinase, translocates to the nucleus and phosphorylates yeast Pop2p in response to a glucose signal. Genes Dev. 151217-1228. [DOI] [PMC free article] [PubMed] [Google Scholar]
- 19.Nguyen, B., A. Upadhyaya, A. van Oudenaarden, and M. P. Brenner. 2004. Elastic instability in growing yeast colonies. Biophys. J. 862740-2747. [DOI] [PMC free article] [PubMed] [Google Scholar]
- 20.O'Toole, G. A., L. A. Pratt, P. I. Watnick, D. K. Newman, V. B. Weaver, and R. Kolter. 1999. Genetic approaches to study of biofilms. Methods Enzymol. 31091-109. [DOI] [PubMed] [Google Scholar]
- 21.Palecek, S. P., A. S. Parikh, J. H. Huh, and S. J. Kron. 2002. Depression of Saccharomyces cerevisiae invasive growth on non-glucose carbon sources requires the Snf1 kinase. Mol. Microbiol. 45453-469. [DOI] [PubMed] [Google Scholar]
- 22.Paz, I., J. R. Meunier, and M. Choder. 1999. Monitoring dynamics of gene expression in yeast during stationary phase. Gene 23633-42. [DOI] [PubMed] [Google Scholar]
- 23.Pernambuco, M. B., J. Winderickx, M. Crauwels, G. Griffioen, W. H. Mager, and J. M. Thevelein. 1996. Glucose-triggered signalling in Saccharomyces cerevisiae: different requirements for sugar phosphorylation between cells grown on glucose and those grown on non-fermentable carbon sources. Microbiology 1421775-1782. [DOI] [PubMed] [Google Scholar]
- 24.Reynolds, T. B., and G. R. Fink. 2001. Bakers' yeast, a model for fungal biofilm formation. Science 291878-881. [DOI] [PubMed] [Google Scholar]
- 25.Sambrook, J., and D. W. Russell. 2001. Molecular cloning: a laboratory manual, 3rd ed. Cold Spring Harbor Laboratory Press, Cold Spring Harbor, NY.
- 26.Shapiro, J. A. 1995. The significances of bacterial colony patterns. Bioessays 17597-607. [DOI] [PubMed] [Google Scholar]
- 27.Shapiro, J. A. 1998. Thinking about bacterial populations as multicellular organisms. Annu. Rev. Microbiol. 5281-104. [DOI] [PubMed] [Google Scholar]
- 28.Stoodley, P., K. Sauer, D. G. Davies, and J. W. Costerton. 2002. Biofilms as complex differentiated communities. Annu. Rev. Microbiol. 56187-209. [DOI] [PubMed] [Google Scholar]
- 29.Styles, C. 2002. How to set up a yeast laboratory. Methods Enzymol. 35042-71. [DOI] [PubMed] [Google Scholar]
- 30.Verstrepen, K. J., and F. M. Klis. 2006. Flocculation, adhesion and biofilm formation in yeasts. Mol. Microbiol. 605-15. [DOI] [PubMed] [Google Scholar]
- 31.Verstrepen, K. J., T. B. Reynolds, and G. R. Fink. 2004. Origins of variation in the fungal cell surface. Nat. Rev. Microbiol. 2533-540. [DOI] [PubMed] [Google Scholar]
- 32.Wach, A., A. Brachat, R. Pohlmann, and P. Philippsen. 1994. New heterologous modules for classical or PCR-based gene disruptions in Saccharomyces cerevisiae. Yeast 101793-1808. [DOI] [PubMed] [Google Scholar]
- 33.Winzeler, E. A., D. D. Shoemaker, A. Astromoff, H. Liang, K. Anderson, B. Andre, R. Bangham, R. Benito, J. D. Boeke, H. Bussey, A. M. Chu, C. Connelly, K. Davis, F. Dietrich, S. W. Dow, M. El Bakkoury, F. Foury, S. H. Friend, E. Gentalen, G. Giaever, J. H. Hegemann, T. Jones, M. Laub, H. Liao, N. Liebundguth, D. J. Lockhart, A. Lucau-Danila, M. Lussier, N. M'Rabet, P. Menard, M. Mittmann, C. Pai, C. Rebischung, J. L. Revuelta, L. Riles, C. J. Roberts, P. Ross-MacDonald, B. Scherens, M. Snyder, S. Sookhai-Mahadeo, R. K. Storms, S. Veronneau, M. Voet, G. Volckaert, T. R. Ward, R. Wysocki, G. S. Yen, K. Yu, K. Zimmermann, P. Philippsen, M. Johnston, and R. W. Davis. 1999. Functional characterization of the S. cerevisiae genome by gene deletion and parallel analysis. Science 285901-906. [DOI] [PubMed] [Google Scholar]


