Abstract
Retinal progenitor cells have been shown to be multipotent throughout development. Similarly, many other structures of the developing central nervous system have been found to contain multipotent progenitor cells. Previous lineage studies did not address whether these multipotent progenitor cells were biased in their production of neuronal subtypes. This question is of interest because subtypes are the basis of distinct types of circuits. Here, lentivirus-mediated gene transfer was used to mark single retinal progenitor cells in vivo, and the different subtypes of horizontal cells (HCs) in each clone were quantified. Clones with two HCs consistently contained a single HC subtype, a pair of either H1 or H3 cells. This suggests that a multipotent progenitor cell produces a mitotic cell fated to make a terminal division that produces two HCs of only one subtype. This bias in production of one HC subtype suggests a previously undescribed mechanism of cell fate determination in at least a subset of retinal cells that involves decisions made by mitotic cells that are inherited in a symmetric manner by both neuronal daughter cells.
Keywords: chick, lentivirus, lineage, retina
The extensive morphological and functional diversity exhibited by the cells of the CNS presents challenging questions regarding the processes of cell fate determination and differentiation. The generation of extreme neuronal diversity is particularly interesting, because these cells arise from a pool of progenitor cells that remain multipotent throughout development. The retina is an excellent model for the study of these questions, because there are well described stereotypical positions and morphologies that allow the definition of each cell type from histological sections (1).
The progeny of individual CNS progenitor cells can be marked by in vivo infection with a replication-incompetent retrovirus encoding a fluorescent or histochemical reporter gene (2–8). When several different CNS areas were marked in such a manner, many progenitor cells were found to be able to give rise to several different cell types, including different types of neurons, as well as glia (9–11). In the postnatal rat retina, injections of Moloney Murine Leukemia virus vectors produced clones composed of different combinations of the cell types generated after infection, indicating a multipotency of late progenitor cells to produce late-born cell types (4). Even clones of only two cells did not have the same interneuron type. Furthermore, embryonic injections of the same virus produced clones composed of many retinal cell types, with most clones, again even those with only two cells, containing two or more cell types (12). The multipotency of retinal progenitor cells was also shown by lineage analyses in the avian retina and Xenopus retina (13–15). All of the lineage data, along with data from mixing experiments in which progenitor cells from different ages were challenged with different environments, led to the proposal that retinal multipotent progenitor cells exhibit temporal differences in their competency to make the different retinal cell types (16).
No previous lineage study addressed whether there was any bias within clones toward distinct subtypes of neuronal cells. This question is of interest, because the retina comprises distinct circuits that transform the initial signal from photoreceptors into information regarding motion, activity and other features still being identified (1). The use of more subtly specified progenitor cells may ensure the production of neuronal subtypes relevant to the creation of particular circuits. In this study, we investigate the composition of clones regarding the subtypes of HCs in the avian retina. HCs are thought to be essential for the establishment of center-surround inhibition in bipolar cells, and their subtypes differentially connect different photoreceptor types, for reasons not completely understood (1).
Lentiviral vectors encoding fluorescent reporter proteins were injected in ovo at different times during retinal development. Clones were examined upon the maturation of the retina, allowing the HC subtype composition to be assayed morphologically. Large clones derived from the earliest infections contained all of the subtypes of HCs, whereas small clones with at least three HC types typically contained at least two subtypes. However, later injections that produced clones with many cell types, but only two HCs, contained only a single HC subtype, the H1 or H3 subtype, but not the H2 subtype. Clones with only one HC often had an H2 cell. These data imply that multipotent retinal progenitor cells become biased or limited with respect to their ability to make the different subtypes of HC. Interestingly, production of H1 or H3 cells appears to be by a mitotic progenitor cell that divides to make two postmitotic HCs of the same subtype, whereas production of the H2 subtype is likely through an asymmetric pattern that leads to production of only one H2 cell.
Results
Replication-Incompetent Lentiviruses Can Be Used to Mark Retinal Clones.
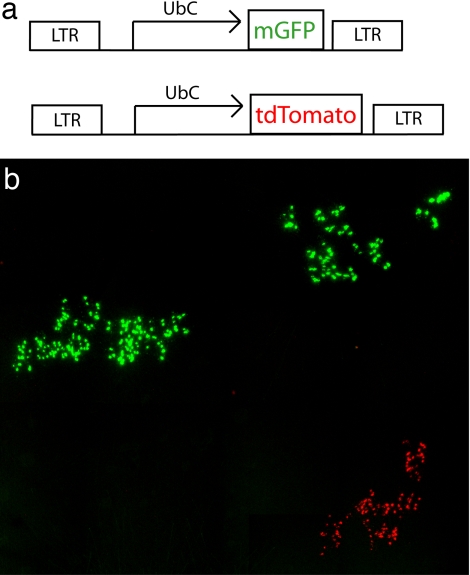
Injection of lentiviral vectors in ovo between embryonic days 1.5 and 4 (E1.5–E4) was carried out to mark clones. To determine clonal boundaries, two lentiviral constructs were coinjected, one encoding tdTomato and the other membrane-bound GFP (Fig. 1a). Previous studies had shown the relative sizes and morphologies of clones after infection with avian replication-incompetent viruses (13, 17). Clones from these early injection times had many radial columns and many cell types per column. Similar patterns were seen here after lentiviral infections. Even without coinjection of viruses with different markers, clonal boundaries were easily distinguished because of the sparseness of clones in each retina, stereotypical shape of clones, and variable intensity of reporter expression among clones, but not within cells of a clone (Fig. 1b). In addition to clones with many cells, single-cell clones also were noted. They were rare and were not included in these analyses.
Fig. 1.
Chick retinal clones from E1.5. The lentiviruses, FUmGW expressing mGFP from a UbC promoter and FUtdTW expressing tdTomato from a UbC promoter, were used to infect the E1.5 chick retina. At E18, the boundaries of two clones marked with FUmGW and one with FUtdTW can be seen on the whole-mount retina.
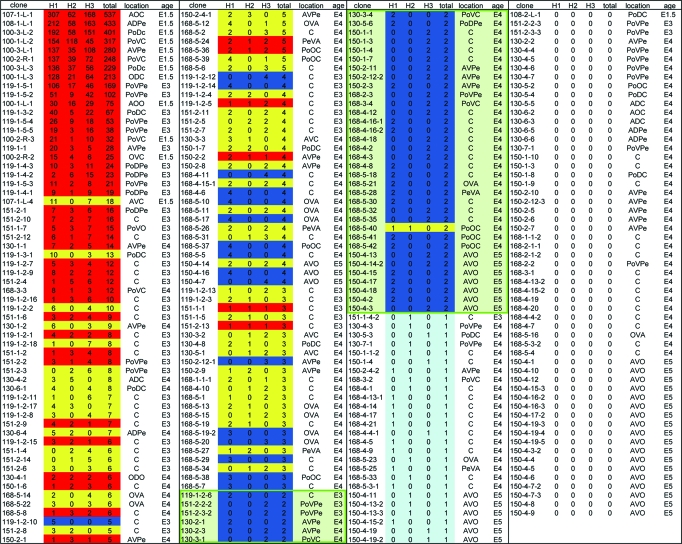
Of the total of 245 GFP-positive clones observed, 240 were clearly distinguishable from other clones in the same retina, and 237 of those were imaged with confocal microscopy (Table 1). The larger clones required automated tiling of z-stacks. The tdTomato clones were used only as a marker for clonal boundaries because this reporter did not adequately label neuronal morphology. To investigate whether there was a regional subtype skew in HC subtypes, each clone had its relative dorsal–ventral, anterior–posterior, and central–peripheral position in the retina noted (Table 1). Clones were found to have HC subtype distributions independent of the region in which they were located.
Table 1.
The number of HC subtypes per clone
Clones are numbered according to the format: experiment number—retina number—file number. In large files composed of many images stitched together, an additional number represents a clone within the image if an image contains more than one clone. All clones derived from E3, E4, and E5 injections are from the right eye, whereas clones derived from E1.5 are from the right or left eye, as designated prior to the file number. Green box, clones with only two HCs. Location within the retina is desingated as follows: Anterior/Posterior (A or Po), followed by Ventral or Dorsal (V or D), then Central or Peripheral (C or Pe). A designation of O means an intermediate position between either of the positions. Red, clones with all three subtypes; yellow, clones with two subtypes; dark blue, clones with only one subtype; light blue, only a single horizontal cell; uncolored, no HCs in the clone; age, age of injection.
HC Subtype Within Clones Can Be Assayed Through Morphology.
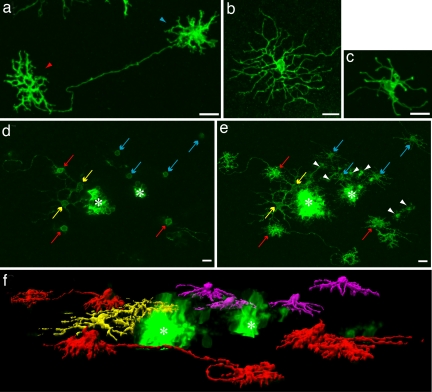
A classic Golgi-electron microscopy and a more recent electroporation study have shown there are three morphologically distinct subtypes of HCs in the avian retina (18, 19). Lentiviral injections into the embryonic chick also yielded three morphological subtypes of HCs: the axon-bearing H1 HC with its numerous short dendrites and an elaborate axonal bushel, the axonless H2 cell with long sparse dendritic projections, and the H3 cell with short sparse dendrites and no axon (Fig. 2 a–c).
Fig. 2.
HC subtypes. (a) H1 cell with a characteristic long axon with exuberant axon terminal (red arrowhead) and bushy dendrites (blue arrowhead). (b) H2 cell with sparse longer processes. (c) H3 cell with short thin processes terminating in larger boutons. (d) Single clone at the level of the scleral inner nuclear layer, showing HC bodies. (e) Same clone as d showing OPL arborization pattern. (f) 3D rendering of the HCs in the clone depicted in d and e; this clone contains three H1, two H2, and four H3 HCs. Red, H1; yellow, H2; purple, H3; red arrow, H1 cell; yellow arrow, H2 cell; blue arrow, H3 cell; white arrowhead, photoreceptors; asterisk, column of clonally related cells. (Scale bars, 10 μm.)
To assay the distribution of HCs within clones, HC morphology was imaged within each individual clone. Visualization and quantification of cell subtype within retinal clones are difficult for many cell types, because many cell types are very close to one another and thus the signal from individual cells is often difficult to resolve (12). However, in even the largest clones quantified, two factors contributed to being able to resolve the morphology of individual HCs. First, the HCs were usually displaced tangentially from the dense signal coming from the closely apposed bipolar and Müller glial cells of the main columns of labeled cells [Fig. 2 d and e; supporting information (SI) Movie 1]. Second, HC bodies were located just adjacent to the outer plexiform layer (OPL), where they send their projections, a location not shared with many other retinal cell types (Fig. 2 d–f; SI Movie 2). This allowed the processes that belonged to each cell body to be tracked and used to identify each HC as to subtype. Photoreceptors occasionally populated the OPL outside of the dense GFP+ column, but they were easily distinguished from HCs by their characteristic arborization pattern and cell body location (Fig. 2 d–f; SI Movie 2). In all quantified clones combined, 3,992 HCs were counted, and all were identified as either H1, H2, or H3 (Table 1).
Clones with Many HCs Contain All Three HC Subtypes.
To fully catalog the production of the different HC subtypes at different stages of retinal development, injections at different stages were conducted. A variety of clones with different sizes and locations were found fairly equally distributed throughout the retina (Table 1). Clones were assessed regarding the number and subtype of all of their HCs as described above.
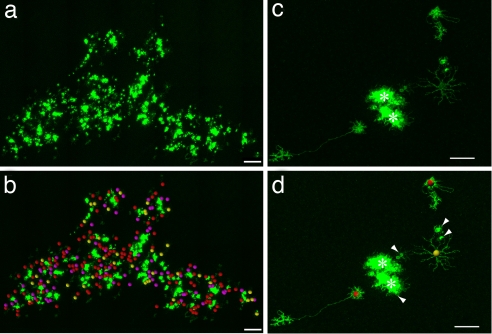
Infections at E1.5 produced the largest clones. Eleven clones derived from E1.5 injections containing >20 HCs (n = 11 clones) had all three HC subtypes, one clone having 20 HCs contained only H1s and H3s, and one very small central clone had no HCs (Fig. 3 a and b and Table 1). Infections at E3 produced many large clones but, in addition, many smaller clones as well. The smaller clones were typically toward the central developmentally older region of the retina, whereas the larger clones were commonly toward the periphery of the retina. Similar to E1.5 infections, all E3 clones with >20 HCs had all three subtypes (n = 9) (Table 1). In the E3 clones with between three and 20 HCs, 17 had all three subtypes, 17 had two subtypes, and three had only one subtype (n = 37) (Fig. 3 c and d and Table 1). E4 infections resulted in clones with <15 HCs, and of those with three or more, nine had all three subtypes, 30 had two, and 12 had one (Table 1). E5 infections, however, produced only three clones with three or more HCs, two with one subtype, and one with two subtypes (Table 1). In summary, clones from all stages with >18 HCs had all three subtypes (n = 21), and all clones with more than five HCs had at least two subtypes (n = 53) (SI Fig. 8 and Table 1). Furthermore, of the 23 clones with only three HCs, 2 contained all three subtypes, 15 contained two subtypes, and 6 contained only one subtype (SI Fig. 8 and Table 1).
Fig. 3.
Clones with multiple HC subtypes. (a and b) A large clone containing 137 H1, 39 H2, and 72 H3 cells. (Scale bar, 300 μm.) (a) Before quantification. (b) After quantification (c and d) A small clone with three HCs, two H1, and one H2. (c) Before quantification. (d) After quantification. (Scale bar, 40 μm.) Red spheres, H1; yellow spheres, H2; purple spheres, H3; white arrowheads, photoreceptors; asterisks, clonally related columns.
An analysis of the percentage of HCs that were each subtype was carried out (SI Fig. 9). Infection at E1.5 would be expected to generate all subtypes in the ratios found in the retina, because it is a time before any neurons have been generated (20). H1 cells were most abundant at 53%, with H3 at 30% and H2 at 17%. These frequencies changed somewhat between E3 and E5. By E5, the percentages became less reliable as the number of HCs per clone dropped and clones became smaller. The frequency that each a subtype was found in a clone dropped as the time of injection became later (SI Fig. 10), likely due to the fact that the clones were becoming smaller. Although there are no birthdating data available for chick HCs during this window of time, it is also likely that fewer HCs were found per clone as the window of time for production of HCs was coming to an end by E5. That the drop in production of each subtype was fairly similar over time suggests there was no significant difference in birth order among the three subtypes.
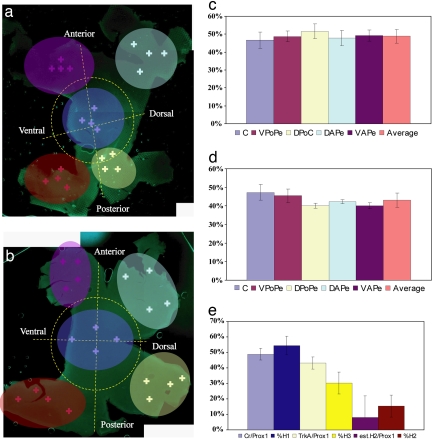
To compare the above frequencies of HC subtypes found in clones to the overall frequencies of HC subtypes within the retina, immunohistochemistry was carried out. Retinas were stained by antibodies for markers of H1 and H3 subtypes, Calretinin, and TrkA, respectively, as well as the panhorizontal marker, Prox1 (SI Fig. 11). The retina was divided into several quadrants to determine whether there was regional variation, and retinas were scored for the percentage of Prox1+ cells that were Calretinin+, or the percentage of Prox1+ cells that were TrkA+(Fig. 4 a and b). Although the total number of Calretinin+, TrkA+, and Prox1+ HCs varied over the different regions of the retina (data not shown), the percentages of each subtype remained constant (Fig. 4 c and d). Furthermore, the average percentage of H1 cells among all HCs within clones is consistent with the fraction of Prox1+ cells that were Calretinin+ across the retina (Fig. 4e). Although the percentage of H3 cells among all HC within clones and the percentage of Prox1+ cells that were TrkA+ (Fig. 4e) was similar, the percentage of H3 cells among all HC was slightly lower in clones than predicted by TrkA staining (discussed below). The percentage of HC that were H2 was calculated as the Prox1+ cells that were negative for TrkA and calretinin. The percentage of H2 cells within clones was again similar to the overall frequency of H2 cells within the retina (Fig. 4e). These data indicate that the viral labeling did not produce a significant skew in the frequencies of different HC subtypes within clones, which might have occurred if there was variation in promoter strength in the different HC subtypes. The slightly lower percentage of H3 HC subtypes found in clones relative to the prediction from TrkA staining was probably due to a slight under-counting of H3s in the main column of clones, when these cells were completely surrounded by GFP+ Müller glia and bipolar cells (Figs. 4d and 2e). This did not occur with H1 and H2 cells to an appreciable degree due to the exuberance of their projections making them identifiable even when surrounded by GFP+ sibling cells.
Fig. 4.
Subtype composition of wild-type retina and E1.5 clones. (a) E18 retinas immunostained for Calretinin as well as Prox1, colored crosses indicate the shaded regions where stained cells were scored. (b) Retina stained for TrkA as well as Prox1. (c) The average percentage of Prox1+ cells that stained for Calretinin, as well as the local averages over the different quadrants marked in a. (d) The average percentage of Prox1+ cells that stained for TrkA, as well as the local averages over the different quadrants marked in b. (e) The percentage of HCs that were H1, H2, and H3 cells found in E1.5 clones (dark blue, brown, and yellow, respectively) and the percentage of Calretinin+/Prox1+ and TrkA+/Prox1+ HCs (light blue and light yellow, respectively). H2 cells (purple) are estimated by subtracting the average of TrkA and Cr HCs. Abbreviations (c and d) are as in Table 1.
Clones with Only One or Two HCs Had Skewed Distribution of Subtypes.
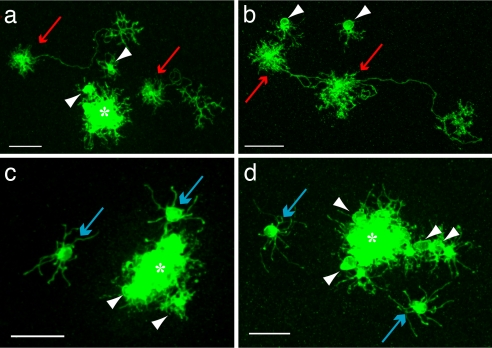
Clones with many HCs from any injection time typically had all three subtypes, demonstrating that progenitor cells were able to produce all of the HC subtypes if infection occurred during the period when HCs were produced. Determining the subtype composition of clones with only one or two HCs allowed an investigation regarding the final production of HC subtypes (Fig. 5). Such clones were produced by infections at E3–E5.
Fig. 5.
Clones containing two HCs (a and b). Two clones containing two H1 HCs each (red arrows). (c and d) Two clones containing two H3 HCs (blue arrows). White arrowheads, photoreceptors. (Scale bar, 20 μm.) Asterisk, clonally related columns.
Clones that contained only one HC were heavily skewed toward the H2 subtype (11 of 26 clones with only one horizontal cell) (Table 1). Comparing the frequency of HC subtypes among the one horizontal cell-containing clones to their frequencies among all clones from E3–E5 infection showed a very significant preference toward the H2 subtype among the clones with only one HC (P = 7.96 × 10⁻⁵). This skew was also obvious if a comparison was made to the frequencies of subtypes among clones with one or two HCs (P = 2.5 × 10⁻⁷). The latter comparison is likely the most relevant, because it would take into account any birth-order differences among HC subtypes.
A similar analysis was done for the subtype frequencies among clones with only two HCs. Among these clones, there was a very significant lack of H2 cells: only one cell in 40 clones with two horizontal cells was an H2 cell. Lack of the H2 subtype is most likely not due to an earlier birth of that subtype, because, as discussed above, clones containing only a single HC often had an H2 subtype. The frequencies of subtypes in the clones with two HCs again were statistically significantly skewed, with a similar χ2 analysis done comparing the subtype frequencies observed to those predicted by the overall subtype frequencies found in all clones from infection from E3–E5 or the frequencies seen in clones with one or two HC (P values of 0.015 or 8.8 × 10⁻⁴, respectively). A further analysis of the subtype pairs seen in clones with two HCs was carried out. A striking preference for pairs of the H1 or H3 subtype vs. H1 plus H3 was statistically significant with a χ2 P value of 1.2 × 10⁻⁷ using the frequencies of each subtype in the clones with two HC or 4.0 × 10⁻¹¹ with the frequencies of HC subtypes seen in the clones with one or two HC, or 4.6 × 10⁻¹⁴ if one uses the frequencies of subtypes in all clones from infection at E3–E5.
Discussion
Here, we performed a lineage analysis in which the focus was on the composition of clones with respect to a particular neuronal subtype in the avian retina. A replication-incompetent lentivirus was used to irreversibly mark neural progenitor cells and their progeny. HC subtypes were examined because of the clear morphological differences among the subtypes as well as the fortuitous nature of their tangential dispersion from other labeled cells within a clone.
Previous experiments have shown that when a progenitor cell is marked late in rat and mouse retinal neurogenesis, many combinations of the cell types born after infection can be observed within clones, demonstrating multipotency of these progenitor cells (4, 12). Early marking of murine progenitor cells also yielded clones composed of a mixture of the cell types produced at subsequent stages (12). In the current study, using a lentiviral vector, as well as a previous study using an avian replication-incompetent virus, all or nearly all of the retinal cell types were present in the overwhelming majority of the chick clones analyzed, again showing multipotency of early chick retinal progenitor cells (13).
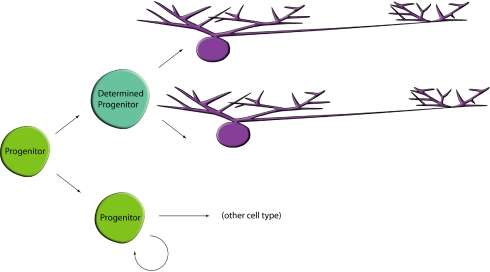
In keeping with the expected multipotency of retinal progenitor cells, in clones with many HCs, there were two or three different HC subtypes. However, clones containing only two HCs, with one exception, were composed of either a pair of H1 or H3 HCs. Thus, a bias to the production of a single HC subtype was observed near the end of some progenitors' period of HC production. Interestingly, this pattern did not extend to H2 HCs, because they were not seen in clones with only two HCs. They were, however, overrepresented in clones with only one HC. Two patterns of inheritance can explain the observations of HC subtype distribution. One is that the marked progenitor cell gave rise to another multipotent progenitor cell as well as to a progenitor cell that became determined to form either the H1 or H3 subtype of horizontal cell. The determined progenitor then further divided only once more to produce two HCs of either the H1 or H3 subtype (Fig. 6). This restricted progenitor cell likely produced determinants of the HC subtype that were parceled out to both daughter cells. Alternatively, the marked cycling progenitor cell might itself become restricted to production of a single HC subtype after a certain late stage in its competence to produce HCs and two or more asymmetric divisions of this cell resulted in production of one H1 per division, or one H3 cell per division, in different clones. Both models include an introduction of bias to the progenitor cells, namely in their late production of cell subtypes.
Fig. 6.
A model for the bias of progenitor cells to produce particular subtypes of HCs. A multipotent progenitor cell produces a determined daughter cell that is specified to produce a single HC subtype after a terminal division. Earlier divisions in the depicted clone would lead to production of progenitor cells that produce other HC subtypes as larger clones contain all three HCs.
We consider the model of a restricted progenitor cell (Fig. 6) that divides once to give rise to two HCs of the same subtype as more likely. Several lines of evidence point in this direction. Clones with three or four HCs have pairs of H1 and H3 cells more commonly than three H1 or three H3 cells, as might be seen as a result of a progenitor cell that was biased to make only H1, or only H3 cells, in subsequent asymmetric divisions. In clones with three HCs, there were six pairs of H1 and seven pairs of H3 cells in the 23 clones with three HCs. In clones with four HCs, there were 7 clones with two or four H1 cells, and 11 clones with two or four H3 cells of a total of 24 clones. In addition, if a clone had several progenitor cells that made pairs of H1 or H3 cells, HC clones with an even number of H1 or H3 cells would be more common than clones with an odd number of H1 and H3 cells. As noted above, among the clones with four HC, there were 7 that had four H1 cells and 3 that had four H3 cells. Further examination of all clones that might have more than one pair of H1 or H3 cells, i.e., those of more than three cells, showed a bias toward even numbers, with P values of 0.06 and 0.05 for H1 and H3 cells, respectively. That this was not more significant is likely due to pruning of even numbers to odd due to HC cell death. Because no studies of HC death have been carried out, quantitative analysis of this factor is not possible. One final line of evidence supporting the model of a symmetric final division by a determined or biased progenitor cell is the presence of rare clones that are comprised entirely of two HCs (n = 3). Such clones are consistent with an infection just before the division that created the determined progenitor that gave rise to the two HCs. Their rarity is likely due to the low frequency of such progenitor cells at any one time. All 3 clones of only two HCs comprised pairs of H1 cells.
The production of H2 cells by an asymmetric division making only one H2 cell is also supported by several lines of evidence. As shown in SI Table 2 and Table 1, H2 cells are far more common in clones with one HC than either H1 or H3 cells. There are no clones with two HC that comprise two H2 cells. Similarly, in clones with three HC, H2 cells were present but, with only two exceptions, they were present as single cells, not as pairs, as was seen for H3 and H4 cells. Finally, if H2 cells were made by asymmetric divisions, there should be a fairly equal number of clones with an even or an odd number of H2 cells. This would be clones with one HC were removed, because they have an odd number. When they are removed, this last prediction is born out, because there were 27 clones with an even number of H2 cells and 21 with an odd number. This is in contrast to the extreme skew toward even numbers for H1 and H3 cells (SI Table 2).
Because subtype composition was not examined in the previous lineage studies of Xenopus, mouse, rat, or chick, a comparison of these findings regarding subtypes cannot be made. However, it is interesting to note that there were many clones of only two cells after infection of the postnatal rat or mouse retina. Notably, with one exception, postnatally generated clones of two cells almost never had two of the same type, i.e., there were no or almost no clones with two bipolar cells, two amacrine cells, or two Müller glial cells. A common exception was rods, which were >80% of the cells in the data set, and which were frequently seen as the only cell type in two cell clones. From embryonic infections of the mouse, there were very few clones with only two cells, and only 2 of 10 clones had two of the same cell type; there were 2 two-cone clones. These data suggest that multipotent progenitor cells do not often generate a mitotic progenitor cell that is limited in its production of interneuron types. That this was observed here for subtypes of HCs shows this can happen and may be a mechanism for limited amplification of certain neuronal subtypes within the CNS. This does not appear to be limited to chickens, as Godinho et al. (21) recently used live imaging in the zebrafish retina to show the production of HCs by an INL progenitor making only HCs. Another recent study by Ajioka et al. (22) reported that cells with differentiated HC features can divide in a murine model of retinoblastoma. This unusual property may be due to the fact that a mitotic cell committed to the HC fate is able to divide during normal development. The current study thus extends our notions of how lineage might play a role in cell fate determination in the CNS.
Methods
Viral Constructs and Production.
FUGW was modified, with GFP being replaced with membrane-bound GFP to produce FUmGW, or with tdtomato to produce FUtdTW (23). Virus production, concentration, and tittering were done by standard methods (24), using the helper plasmid D8.9 and the plasmid VSV-G coat into 293T cells with FUGENE 6 (Roche) (25).
E1.5 chicks (stage 8–12) were infected by injection into the optic cup or anterior neural tube. E3, E4, and E5 injections were targeted to the subretinal space as described (26).
Immunocytochemistry.
Retinas were dissected from E18 chicks, and flat-mount preparations were made according to Bruhn and Cepko (27). Whole mounts double-labeled for Calretinin and Prox1 or TrkA and Prox1 were stained through serial antibody staining similar to the above protocol. Calretinin (Swant) was used at 1:1,000, Prox1 (RELIAtech) at 1:800, and TrkA (courtesy of F. Lefcort) 1:8,000 (28). For further methods, see SI Text.
Confocal Microscopy and Image Processing.
Retinal flat mounts prepared, as described above, became between 50 and 100 μm thick, depending on the degree of flattening induced by the mounting. However, even in the thinnest samples, HC subtypes could still be determined, because dendritic morphology was not noticeably altered. Imaging was conducted with a Zeiss LSM 510 meta (Zeiss) with a ×40 or ×63 oil Plan Apochromat objective, and stacks were acquired with at least 0.5 μm per slice. Large clones were acquired with an automated stage and the MultiTime macro, which allows for automated sequential acquisition of z-stacks from large fields. Sequentially acquired stacks were stitched together by using custom-made software (A. Ponti and B. Roska, personal communication).
Stitched clones had their HC subtypes scored manually using the spot detector tool of Imaris Surpass (Bitplane), and 3D rendering was produced with the Isosurface and Contour functions of Imaris Surpass after processing with the Edge Preserving Filter set at a filter width of 0.2 μm.
Supplementary Material
ACKNOWLEDGMENTS.
We thank A. Ponti and B. Roska (Friedrich Mischer Institute, Basel, Switzerland) for providing the automated tile stitching ImageJ plugin and the Harvard Center for Neurodegeneration and Repair for use of their confocal microscopy facility. We also thank F. Lefcort (Montana State University, Bozeman, MT) for providing the TrkA antibody. This work was supported by the Howard Hughes Medical Institute.
Footnotes
The authors declare no conflict of interest.
This article contains supporting information online at www.pnas.org/cgi/content/full/0709979104/DC1.
References
- 1.Masland RH. Nat Neurosci. 2001;4:877–886. doi: 10.1038/nn0901-877. [DOI] [PubMed] [Google Scholar]
- 2.Sanes JR, Rubenstein JL, Nicolas JF. EMBO J. 1986;5:3133–3142. doi: 10.1002/j.1460-2075.1986.tb04620.x. [DOI] [PMC free article] [PubMed] [Google Scholar]
- 3.Price J, Turner D, Cepko C. Proc Natl Acad Sci USA. 1987;84:156–160. doi: 10.1073/pnas.84.1.156. [DOI] [PMC free article] [PubMed] [Google Scholar]
- 4.Turner DL, Cepko CL. Nature. 1987;328:131–136. doi: 10.1038/328131a0. [DOI] [PubMed] [Google Scholar]
- 5.Walsh C, Cepko CL. Science. 1988;241:1342–1345. doi: 10.1126/science.3137660. [DOI] [PubMed] [Google Scholar]
- 6.Gray GE, Glover JC, Majors J, Sanes JR. Proc Natl Acad Sci USA. 1988;85:7356–7360. doi: 10.1073/pnas.85.19.7356. [DOI] [PMC free article] [PubMed] [Google Scholar]
- 7.Luskin MB, Pearlman AL, Sanes JR. Neuron. 1988;1:635–647. doi: 10.1016/0896-6273(88)90163-8. [DOI] [PubMed] [Google Scholar]
- 8.Price J, Thurlow L. Development (Cambridge, UK) 1988;104:473–482. doi: 10.1242/dev.104.3.473. [DOI] [PubMed] [Google Scholar]
- 9.Galileo DS, Gray GE, Owens GC, Majors J, Sanes JR. Proc Natl Acad Sci USA. 1990;87:458–462. doi: 10.1073/pnas.87.1.458. [DOI] [PMC free article] [PubMed] [Google Scholar]
- 10.Golden JA, Cepko CL. Development (Cambridge, UK) 1996;122:65–78. doi: 10.1242/dev.122.1.65. [DOI] [PubMed] [Google Scholar]
- 11.Leber SM, Breedlove SM, Sanes JR. J Neurosci. 1990;10:2451–2462. doi: 10.1523/JNEUROSCI.10-07-02451.1990. [DOI] [PMC free article] [PubMed] [Google Scholar]
- 12.Turner DL, Snyder EY, Cepko CL. Neuron. 1990;4:833–845. doi: 10.1016/0896-6273(90)90136-4. [DOI] [PubMed] [Google Scholar]
- 13.Fekete DM, Perez-Miguelsanz J, Ryder EF, Cepko CL. Dev Biol. 1994;166:666–682. doi: 10.1006/dbio.1994.1346. [DOI] [PubMed] [Google Scholar]
- 14.Wetts R, Fraser SE. Science. 1988;239:1142–1145. doi: 10.1126/science.2449732. [DOI] [PubMed] [Google Scholar]
- 15.Holt CE, Bertsch TW, Ellis HM, Harris WA. Neuron. 1988;1:15–26. doi: 10.1016/0896-6273(88)90205-x. [DOI] [PubMed] [Google Scholar]
- 16.Cepko CL, Austin CP, Yang X, Alexiades M, Ezzeddine D. Proc Natl Acad Sci USA. 1996;93:589–595. doi: 10.1073/pnas.93.2.589. [DOI] [PMC free article] [PubMed] [Google Scholar]
- 17.Peters MA, Cepko CL. Dev Biol. 2002;251:59–73. doi: 10.1006/dbio.2002.0791. [DOI] [PubMed] [Google Scholar]
- 18.Genis-Galvez JM, Garcia-Lomas V, Prada F, Armengol JA. Anat Embryol (Berl) 1981;161:319–327. doi: 10.1007/BF00301829. [DOI] [PubMed] [Google Scholar]
- 19.Tanabe K, Takahashi Y, Sato Y, Kawakami K, Takeichi M, Nakagawa S. Development (Cambridge, UK) 2006;133:4085–4096. doi: 10.1242/dev.02566. [DOI] [PubMed] [Google Scholar]
- 20.Kahn AJ. Dev Biol. 1974;38:30–40. doi: 10.1016/0012-1606(74)90256-5. [DOI] [PubMed] [Google Scholar]
- 21.Godinho L, Wiiliams PR, Claassen Y, Provost E, Leach SD, Kamermans M, Wong RO. Neuron. 2007;56:597–603. doi: 10.1016/j.neuron.2007.09.036. [DOI] [PubMed] [Google Scholar]
- 22.Ajioka I, Martins RA, Bayazitov IT, Donovan S, Johnson DA, Frase S, Cicero SA, Boyd K, Zakharenko SS, Dyer MA. Cell. 2007;131:378–390. doi: 10.1016/j.cell.2007.09.036. [DOI] [PMC free article] [PubMed] [Google Scholar]
- 23.Lois C, Hong EJ, Pease S, Brown EJ, Baltimore D. Science. 2002;295:868–872. doi: 10.1126/science.1067081. [DOI] [PubMed] [Google Scholar]
- 24.Cepko CL, Pear WS. In: Current Protocols in Molecular Biology. Ausubel FM, Brent R, Kingston RE, Moore DD, Seidman JG, Smith JA, Struhl K, editors. Hoboken, NJ: Greene; 1997. pp. 9.9–9.14. [Google Scholar]
- 25.Naldini L, Blomer U, Gage FH, Trono D, Verma IM. Proc Natl Acad Sci USA. 1996;93:11382–8. doi: 10.1073/pnas.93.21.11382. [DOI] [PMC free article] [PubMed] [Google Scholar]
- 26.Fekete DM, Cepko CL. Mol Cell Biol. 1993;13:2604–2613. doi: 10.1128/mcb.13.4.2604. [DOI] [PMC free article] [PubMed] [Google Scholar]
- 27.Bruhn SL, Cepko CL. J Neurosci. 1996;16:1430–1439. doi: 10.1523/JNEUROSCI.16-04-01430.1996. [DOI] [PMC free article] [PubMed] [Google Scholar]
- 28.Fischer AJ, Stanke JJ, Aloisio G, Hoy H, Stell WK. J Comp Neurol. 2007;500:1154–1171. doi: 10.1002/cne.21236. [DOI] [PubMed] [Google Scholar]
Associated Data
This section collects any data citations, data availability statements, or supplementary materials included in this article.


