

Abstract
Obesity is a major health hazard that is caused by a combination of genetic and behavioral factors. Several models of obesity have been described in mice that have defects in the production of peptide hormones, in the function of cell membrane receptors, or in a transcription factor required for neuronal cell development. We have been investigating the function of a family of genes (POTE and ANKRD26) that encode proteins that are associated with the inner aspect of the cell membrane and that contain both ankyrin repeats and spectrin helices, motifs known to interact with signaling proteins in the cell. To assess the function of ANKRD26, we prepared a mutant mouse with partial inactivation of the Ankrd26 gene. We find that the homozygous mutant mice develop extreme obesity, insulin resistance, and an increase in body size. The obesity is associated with hyperphagia with no reduction in energy expenditure and activity. The Ankrd26 protein is expressed in the arcuate and ventromedial nuclei within the hypothalamus and in the ependyma and the circumventricular organs that act as an interface between the peripheral circulation and the brain. In the enlarged hearts of the mutant mice, the levels of both phospho-Akt and mTOR were elevated. These results show that alterations in an unidentified gene can lead to obesity and identify a molecular target for the treatment of obesity.
Keywords: Akt signaling, coiled-coil motif, insulin resistance, hyperphagia, POTE ancestor
We have been studying a family of primate-specific genes termed POTE, which are expressed in many cancers and embryonic stem cells, but only in a few normal adult tissues: prostate, ovary, and testis (1–3). The POTE genes entered the primate genome ≈20–40 Mya and appear to be under strong selective pressure because they evolved rapidly into 13 closely related paralogs located on 8 different chromosomes (4, 5). They encode proteins that contain three domains: an amino-terminal cysteine-rich domain followed by ankyrin repeats and spectrin-like helices. Different paralogs contain different numbers of each of these components. In addition, an actin retroposon has been inserted in-frame in several family members, indicating that the gene is rapidly evolving in primates (6). The POTE genes evolved from a precursor gene, ANKRD26, which is located at 10p12.1 in humans and at chromosome 6 (qF1) in the mouse (5). The ANKRD26 gene also contains ankyrin repeats and spectrin helices but is missing the amino-terminal cysteine-rich domain of POTE (5).
EST database analysis of both the human and mouse genomes (www.ncbi.nlm.nih.gov/UniGene/clust.cgi?ORG = Hs&CID = 361041) shows that ANKRD26 RNA is present in many normal tissues, but no function for this gene has been described. To gain information about a possible function for Ankrd26, we produced a mutant (MT) mouse in which the Ankrd26 gene is inactivated by insertion of a β-galactosidase cDNA. We report here that the homozygous Ankrd26 mutant mice have a very distinct phenotype consisting of extreme obesity and an increase in organ and body size. The mice also develop insulin resistance.
Results
The mouse Ankrd26 gene consists of 34 exons spanning a 60-kb region at chromosome band 6qF and is predicted to encode a protein of 192 kDa. To generate a mouse line with inactivation of Ankrd26, mouse embryonic stem cells with an insertion of a β-galactosidase gene into the Ankrd26 locus (Fig. 1) by the gene trap technique were obtained from Bay Genomics (http://baygenomics.ucsf.edu) and used to prepare several lines of chimeric mice by conventional techniques. Analysis of the DNA of the mice confirmed that the insertion was located in intron 24 (Fig. 1B). Heterozygous mice were readily obtained, but they had no obvious phenotype. However, we observed that the adult homozygous mice became extremely large and obese as shown in Fig. 2A.
Fig. 1.

Schematics showing inactivation of the Ankrd26 gene. (A) Domain organization of Ankrd26 protein shown in different colors. Red triangle shows the position of the exon trap mutagenesis of Ankrd26 protein. (B) Screening strategy and the Southern blot analysis of WT and MT mice. The 10-kb band represents the WT allele; the 2-kb band represents the gene trap-targeted allele.
Fig. 2.

Micrograph of representative Ankrd26 mutant (MT) and WT mice. (A) Photomicrograph of a homozygous MT and a WT sibling mouse. (B) X-ray photograph showing the skeleton of a homozygous MT and a WT sibling mouse.
The Ankrd26 gene is transcribed into a 7.5-kb mRNA and expressed at high level in many tissues, including brain, liver, kidney, heart, as well as in mouse embryos at days 7, 11, 15, and 17 (Fig. 3A). To confirm inactivation of the Ankrd26 transcript in the homozygous mice, Northern blot analysis was performed with RNA from brain. As shown in Fig. 3B, wild-type (WT) mice express a 7.5-kb transcript; but in the homozygous MT mice, the transcript size is ≈9.0 kb, as expected for a gene trap fusion transcript. The β-galactosidase insertion into intron 24 should generate an Ankrd26-β galactosidase fusion protein of ≈220 kDa. To detect the protein, we performed a Western blot analysis with protein extract from the livers of homozygous MT and WT mice. As shown in Fig. 3C, a specific band of 220 kDa was detected only in MT mice when the blot was stained with an anti-β-galactosidase antibody. These results show that the Ankrd26 gene contains a mutation resulting in a fusion transcript that translates into a chimeric protein.
Fig. 3.
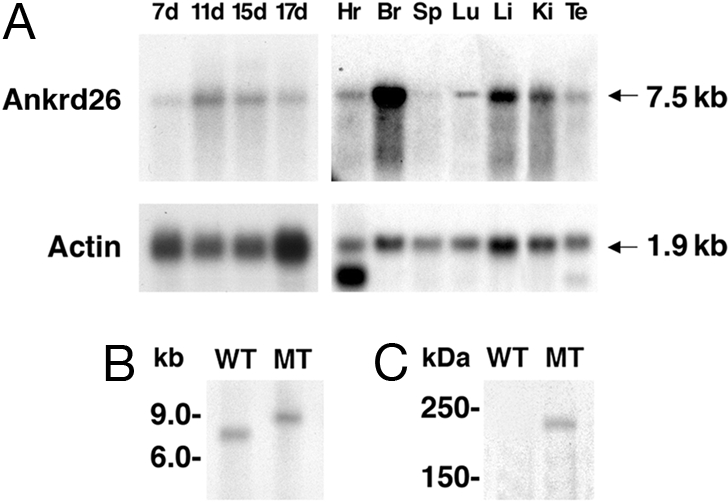
Expression analysis of Ankrd26 gene. (A) Northern blot showing the expression of Ankrd26 transcript in various tissues. The RNA samples used in the analysis are from heart (Hr), brain (Br), spleen (Sp), lung (Lu), liver (Li), kidney (Ki), testis (Te), and total embryos from 7 days (7d), 11 days (11d), 15 days (15d), and 17 days (17d). The blots were probed with actin gene to show the quality as well as equal loading of RNA in each lane. (B) Northern analysis showing the inactivation of the Ankrd26 transcript in mutant mice. About 20 μg of total RNA from brain of WT and MT mice was analyzed by Northern blot hybridization as described in Materials and Methods. (C) Detection of Ankrd-lacZ fusion protein in MT mice. Tissue extracts from MT and WT liver were analyzed by Western blotting with anti-β-galactosidase monoclonal antibody.
We then followed a group of mice from the time of weaning until 4 months of age. As shown in Fig. 4 A and B, both female and male MT mice gained 1 or 2 g a week up through 4 months of age, whereas the growth rate of WT mice slowed at ≈6 weeks of age. At the age of 4 months, both female and male Anrkd26 MT mice were much heavier than normal mice, and ≈25–40% of their body weight was fat (Fig. 4C and Table 1). Both white-fat (inguinal and gonadal) and brown-fat depots were increased in size (Table 1). Many of the cells in white-fat tissue are greatly enlarged (Fig. 5). Analysis of body composition revealed that Ankrd26 mutation also caused an increase in lean mass (23% in males and 24% in females; Fig. 4D and Table 1). Both male and female mice were longer than controls (by 9% and 11%, respectively; Table 1), and their skeleton also appears longer (Fig. 2B). In addition, at 4 months of age, there is also an increase in the size of several body organs. The kidneys and hearts are larger than WT littermates (Table 1).
Fig. 4.

Weight gain, body composition, food intake, and energy expenditure of Ankrd26 MT and control mice. (A) Growth curve of female MT and WT mice. (B) Growth curve of male MT and WT mice. (C) Average weights of total fat of MT and WT mice. (D) Average lean mass of MT and control mice. (E) Insulin tolerance tests of Ankrd26 MT and control WT mice. (F) Average food consumption of MT and WT mice. (G) Average calorie expenditure of Ankrd26 MT and control mice. (H) Respiratory exchange ratio of Ankrd26 MT and control mice.
Table 1.
Metabolic characteristics of 4-month-old Ankrd26 mutant mice
| Characteristic | WT male | Mutant male | WT female | Mutant female |
|---|---|---|---|---|
| Body weight, g | 28.4 ± 1.3 | 40.1 ± 1.2* | 23.2 ± 1.6 | 40.5 ± 3.1* |
| Fat mass, g | 3.6 ± 0.9 | 9.5 ± 1.5* | 3.5 ± 1.2 | 16.2 ± 2.4* |
| Fat mass, % body weight | 12.2 ± 2.8 | 23.2 ± 3.3* | 14.1 ± 3.8 | 39.3 ± 2.9* |
| Lean mass, g | 23.7 ± 0.8 | 29.1 ± 0.7* | 18.3 ± 0.5 | 22.8 ± 1.1* |
| Lean mass, % body weight | 83.5 ± 2.4 | 72.9 ± 3.2* | 79.8 ± 3.5 | 57.2 ± 2.7* |
| Length, mm | 83 ± 1.2 | 91 ± 2 | 80 ± 1 | 89 ± 2* |
| Inguinal fat, g | 0.4 ± 0.06 | 1.0 ± 0.23 | 0.4 ± 0.2 | 1.4 ± 0.22* |
| Gonadal fat, g | 0.4 ± 0.08 | 1.1 ± 0.29 | 0.6 ± 0.3 | 2.3 ± 0.35* |
| Brown fat, g | 0.1 ± 0.01 | 0.2 ± 0.04 | 0.08 ± 0.02 | 0.3 ± 0.11 |
| Liver, g | 1.5 ± 0.1 | 2.0 ± 0.20 | 1.1 ± 0.1 | 1.6 ± 0.22 |
| Kidney, g | 0.4 ± 0.01 | 0.45 ± 0.20 | 0.3 ± 0.01 | 0.33 ± 0.01* |
| Heart, g | 0.15 ± 0.01 | 0.2 ± 0.02* | 0.11 ± 0.01 | 0.15 ± 0.01* |
| Serum glucose, mg/dl | 243 ± 9 | 248 ± 29 | 215 ± 17 | 281 ± 35 |
| Insulin, ng/ml | 0.44 ± 0.05 | 1.4 ± 0.82 | 0.34 ± 0.07 | 0.70 ± 0.11 |
| Triglyceride, mg/dl | 79 ± 14 | 76 ± 20 | 59 ± 21 | 75 ± 21 |
| Free fatty acids, mM | 0.2 ± 0.04 | 0.23 ± 0.02 | 0.35 ± 0.06 | 0.24 ± 0.03 |
| Leptin, ng/ml | 8.8 ± 3.8 | 25.3 ± 9.8 | 8.3 ± 4.0 | 49 ± 16* |
| Adiponectin, μg/ml | 8.9 ± 0.4 | 9.7 ± 1.1 | 17.6 ± 1.8 | 29.7 ± 5.0 |
n = 4–5 mice per group.
*, P < 0.05 versus WT mice of the same sex.
Fig. 5.

Histological analysis of mammary fat pad from WT and MT mice. Sections were stained with H&E. (Magnification: ×10.)
Analysis of the plasma showed that the triglycerides and free fatty acid level were within the normal range in 4-month-old mice (Table 1) but were elevated in 8- to 10-month-old mice (data not shown). Blood glucose levels were normal, but the insulin level was elevated, suggesting an insulin-resistant state (Table 1), which was confirmed by an insulin tolerance test as shown in Fig. 4E. Leptin levels were markedly elevated, consistent with increased adiposity (Table 1). Adiponectin levels were normal. To search for known causes of increased body size, we measured levels of growth hormone and insulin-like growth factor 1 (IGF1), and both were in the normal range as was prolactin (data not shown). Several older mice were also analyzed and found to have more extreme obesity and elevated insulin and glucose level (data not shown).
Taken together, inactivation of the Ankrd26 gene caused massive obesity, a dramatic increase in body size, and insulin resistance, which is most likely secondary to the obesity phenotype.
To study the mechanism of obesity, we analyzed energy balance in control and MT mice. Both male and female MT mice consumed 4–5 g of food per day, whereas the normal mice consumed ≈3 g per day (Fig. 4F). The difference in food intake was detectable as early as 8 weeks of age (before MT mice became massively obese), suggesting that hyperphagia might be the cause of obesity. Total and resting energy expenditure (per mouse) was significantly higher in MT mice (Fig. 4 G and H). When the data were normalized to lean mass, WT and MT male had a similar metabolic rate, whereas MT females remained hypermetabolic compared with controls (data not shown). Body temperature and activity levels were comparable in control and MT mice (data not shown). Thus, hyperphagia rather than reduction in energy expenditure appear to be the primary cause of obesity in the Ankrd26 MT mice.
Several lines of obese large mice have been described; the obesity is caused by widespread ectopic expression of the agouti protein (7), mutations in proopiomelanocortin (POMC) (8), targeted disruption of the melanocortin-4 receptor (MC4R) gene in the brain (9, 10), or haploinsufficiency of Sim1 gene (11). Using RT-PCR, we analyzed expression of these genes in the hypothalamic region of the brain and found no differences in the RNA level of POMC1, agouti-related peptide (AGRP), MC4R, and Sim1 between normal and Ankrd26 MT mice (Fig. 6).
Fig. 6.
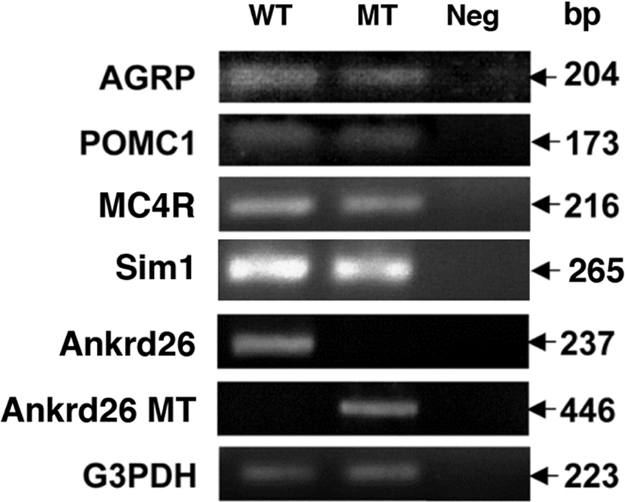
RT-PCR analysis of RNA from hypothalamus of Ankrd26 MT and control mouse brain. Expression levels of AGRP, POMC1, Sim1, MC4R, Ankrd26 and Ankrd26 MT transcripts were measured by RT-PCR using specific primers designed for each gene as described in Materials and Methods. For the analysis of the MT Ankrd26 transcript, the forward primer was within the exon 24 of the Ankrd26 gene, and the reverse primer was within the Geo region of the gene trap vector (http://baygenomics.ucsf.edu). Numbers at the right represent the expected size of the amplified product for each gene. G3PDH was used as an internal control for the experiment.
Because the inactivation of the Ankrd26 is produced by an in-frame insertion of β-galactosidase, one can determine which cells normally produce the Ankrd26 protein by staining tissue sections with a β-galactosidase substrate (X-Gal). As shown in Fig. 7, Ankrd26 is expressed in several regions of the brain, which include the arcuate and ventromedial nuclei within the hypothalamus. These nuclei have been shown to have an important role in regulation of feeding behavior (12). The protein is also expressed at high levels in the ependyma and in the circumventricular organs that act as an interface between the peripheral circulation and the brain. Because of the lack of the blood–brain barrier, the sensory circumventricular organs have been suggested to play a central role in the regulation of energy homeostasis (12, 13).
Fig. 7.

LacZ staining of Ankrd26-expressing cells in the mouse medial basal hypothalamus. (A) Most oral level of the arcuate nucleus (AN). (B) Boxed area from A. (D) Midhypothalamic level. Positive cells are visible in the arcuate nucleus at both levels as well as in the ventromedial hypothalamic nucleus (VMN). The ependyma of the third ventricle (v3) is strongly stained at all levels. (E) Boxed area from D. (C) Level identical to D, demonstrating no staining in a control section. [Scale bars: 100 μm (in E for B and E and in D for A, C, and D).] The schematic drawings (28) show the coronal levels of the sections.
Several proteins and signaling pathways have been implicated in controlling body and organ size and include insulin, insulin receptor (IR), IGF1, IGF1 receptor (IGF1R), IGF2, and the Akt signaling pathway (14, 15). Furthermore, Cantley et al. (16) have shown that activation of the Akt pathway in the heart produces mice with enlarged hearts (16). To assess the state of the signaling pathway in the heart, we have analyzed the levels of phosphorylation of several of these proteins. As shown in Fig. 8, phospho-Akt and phospho-IR/IGFR levels are significantly increased in Ankrd26 MT hearts compared with the WT mice, whereas the total protein levels of Akt or IR and IGFR remain unchanged.
Fig. 8.
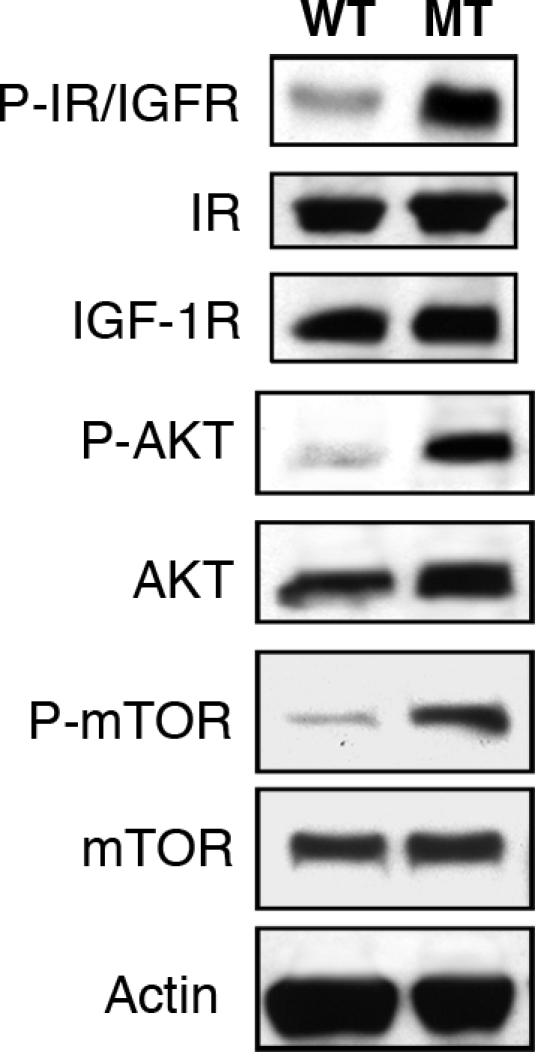
Activation of Akt and IGF1R/IR in Ankrd26 MT mouse heart. Cardiac tissue lysate from 8-week-old Ankrd26 MT and WT mice were separated by SDS/PAGE and analyzed by Western blotting with anti-P-Akt (473), anti-Akt, anti-P-IGF1R (Tyr-1135/1136)/IR (Tyr-1150/1151), anti-P-mTOR (Ser-2448), anti-mTOR, and anti-IGF1R and anti-IR, respectively.
To determine the cellular location of the Ankrd26 protein, we transfected both HeLa cells and 293T cells with a plasmid encoding Ankrd26-EGFP and determined its location in cells by confocal microscopy. Fig. 9 shows typical images in which Ankrd26-EGFP (green) is located just beneath the plasma membrane in close association with filamentous actin (red). In some locations, Ankrd26-EGFP is located in the same region as filamentous actin, as shown in the yellow merged images.
Fig. 9.

Ankrd26 is localized along actin filaments. HeLa or 293T cells were grown overnight on coverslips. After 48 h of transfection with Ankrd26-EGFP plasmid, cells were analyzed by confocal microscope. Cells were fixed by 4% paraformaldehyde and then stained with phalloidin–tetramethylrhodamine B isothiocyanate (red) for actin filament.
Discussion
Because obesity is now a major health problem, there has been a considerable effort to establish animal model for this disease. The defect in the Ankrd26 gene is not caused by alterations in any of the genes known to be involved in obesity. Ob/ob and db/db mice are associated with malfunctioning of the leptin signaling pathways. In ob/ob mice, both copies of the leptin gene are mutated; whereas in db/db mice, it is the receptor that is defective (17–19). In both cases, the homozygous MT mice rapidly increase in weight, but the mice are shorter than their WT littermates. Fat mice, which are homozygous for the spontaneous mutation in the fat gene, develop obesity more slowly than the ob/ob or db/db mice, and the phenotype is primarily restricted to males (20). In tubby mice, homozygous inactivation of the tub gene produces obesity, which is late in onset and relatively mild (21). Obese yellow mice are the result of widespread ectopic expression of the agouti protein, which prevents activation of the MC4R, and the mice develop maturity-onset obesity (22). Targeted disruption of the MC4R gene in brain also results in obese mice that are very similar to the obese yellow mice (9). Mice with targeted disruption of the third exon of the POMC gene also develop obesity (8). To determine whether expression of any of these genes is altered in the Ankrd26 MT mice, we performed RT-PCR analyses with RNA isolated from hypothalamic region of the brain. As shown in Fig. 6, there is no significant difference in the level of these genes in MT mice compared with the WT littermates, suggesting that the Ankrd26 MT phenotype is not related to abnormal expression of these gene products. We plan to confirm this finding by measuring the levels of these proteins.
The Ankrd26 mice have two striking phenotypes. One is that they grow to be very large (long) and have an increase in organ size. The second is that as the mice get older they develop obesity and have elevated levels of insulin. Studies with several other genes that produce obesity indicate that the primary defect is in the hypothalamus. Because of the widespread expression of Ankrd26 in most organs and tissues, it is possible that the Ankrd26 protein may act locally within each cell to control organ size, and it is the level of Ankrd26 protein that regulates this process producing more fat cells, more liver cells, etc. The Ankrd26 protein is located near the plasma membrane (Fig. 9) and contains ankyrin and spectrin motifs. In this location, it could act as an adaptor protein and connect proteins in the plasma membrane with intracellular signaling pathways. We have shown that in the cardiac tissue of MT mice, both phospho-Akt and phospho-mTOR are increased as they are in mice with large hearts resulting from increased Akt signaling (16). Surprisingly, the phosphorylation of the insulin/IGF1R is also increased in the heart. Although this increase may result from an increase in insulin in the blood, it is modest, and it seems more likely to be caused by some intracellular event controlling receptor phosphorylation such as a decrease in protein phosphatase activity. In liver, where we have observed an increase in fat accumulation in older mice (data not shown), we have also detected an increase in peroxisome proliferator-activated receptor γ (PPAR-γ) mRNA. PPAR-γ has a key regulatory role in adipogenesis and was shown to contribute to hepatic steatosis (23). In addition, the fat cells in lipid depots accumulate large amounts of lipid and continue to produce leptin, indicating that they do not respond to signals regulating the metabolism of lipids. The increase in insulin levels in older mice probably contributes to the accumulation of fat.
A final point of interest is that the human ANKRD26 gene is located at 10p12, where Price et al. (24) have provided information indicating that a gene in this location has a role in some forms of hereditary obesity.
Materials and Methods
Generation of Ankrd26 MT Mice.
Ankrd26 MT chimeric mice were generated by blastocyst injection of ES cell line XK525 from Bay Genomics (http://baygenomics.ucsf.edu) with methods described in ref. 25. Chimeric males were crossed with C57BL/6 females, and the agouti-colored offspring were analyzed for transmission of the Ankrd26 mutation. Heterozygous animals were intercrossed to generate homozygous MT animals. WT siblings obtained from the offspring of these crosses were used as control animals in the analysis. All procedures were conducted in accordance with National Institutes of Health guidelines as approved by the Animal Care and Use Committee of the National Cancer Institute and National Institute of Diabetes and Digestive and Kidney Diseases. Mice were typically reared three or four per cage on a 12-h light/dark cycle (lights on 0600–1800) and fed water and NIH-07 diet (11% calories from fat; Zeigler Brothers, Inc.) ad libitum.
Genotyping of MT Mice.
Mice were genotyped by Southern blot analysis with DNA extracted from their tails. Genomic DNA was extracted (26), digested with BamHI, run on a 0.9% agarose gel, and blotted onto BioDyne membrane (Life Technology) for Southern blot analysis. The membranes were hybridized with a radiolabeled probe generated by PCR from exon 24 of the mAnkrd26 sequence. The WT allele gives a band of 10 kb, whereas a band of 2.0 kb represents the correctly targeted allele.
Weight and Length Measurements.
Weight gain for individual mice was measured every week with a Sartorius model BL-600 balance beginning at 3–4 weeks of age. Body length of individual mice was measured from nose to anus after immobilization of mice with sedatives.
Food Consumption.
Food intake was measured on 8-week-old mice housed in pairs for a period of 2 weeks. A sufficient amount of food was weighed and provided to the mice ad libitum. Each morning, the remaining food was measured, for a total of six measurements. The cages were carefully monitored for evidence of any wastage, which was negligible.
Northern Hybridization.
Northern blots containing 2 μg of poly(A) mRNA from mouse tissues (Clontech) were hybridized with random-primed 32P-labeled DNA fragments, under high-stringency conditions. Membranes were blocked for >4 h in hybridization solution, hybridized for 15 h with probe at 55°C, rinsed in 2× SSC/0.1% SDS, washed twice with 2× SSC/0.1% SDS at room temperature, with a final wash at 65°C in 0.2× SSC/0.1% SDS.
RT-PCR Analysis.
For RT-PCR determination of the expression of various genes, RNA was isolated from hypothalamus of adult mouse brain with TRIzol (Life Technology) reagent. First-strand cDNA was synthesized with a first-strand cDNA synthesis kit (Amersham Biosciences), and PCR was performed with Taq polymerase. The PCR conditions used are initial denaturation at 94°C for 1 min, 35 cycles of denaturation at 94°C for 1 min, annealing at 55°C for 1 min, and elongation at 72°C for 1 min. The primers used for PCR amplification of individual genes are as follows: AGRP: forward, GGC CTC AAG AAG ACA ACT GC; reverse, GCA AAA GGC ATT GAA GAA GC; POMC1: forward, CAT CTT TGT CCC CAG AGA GC; reverse, GCA CCA GCT CCA CAC ATC TA; MC4R: forward, GCT GCA GGA AGA TGA ACT CC; reverse, TCG CCA CGA TCA CTA GAA TG; Sim1: forward, CGC TGT GCA CAC CAC TTAC; reverse, CCG AGA TAG TGG GAG TGG AA; Ankrd: forward, AAG CTG AGA GTC AGC GGC ACA G; reverse, CTC GCG CCT CTT CTT CTA AAT TGC; Geo: Reverse, AGT ATC GGC CTC AGG AAG ATC G. For the analysis of the MT Ankrd26 transcript, the forward primer was within the exon 24 of the Ankrd26 gene, and the reverse primer was within the Geo region of the gene trap vector (http://baygenomics.ucsf.edu).
Histological Analysis.
WT and Ankrd26 MT mice were maintained in the same colony following the appropriate animal care and handling guidelines. Mice from each group were euthanized by CO2 inhalation, and complete necropsies were performed. A comprehensive set of organs and tissues from each animal was fixed in 10% buffered formalin, embedded in paraffin, sectioned at 5 μm, and stained with H&E. For β-galactosidase staining, the entire brain was frozen in a cryomold with OCT medium. Complex serial/step sections were cut at 10–12 μm. Serial sections were done through the entire hypothalamus and pituitary. Sequential slides were stained with β-galactosidase and H&E.
Immunofluorescence and Confocal Microscopy.
Cells grown on a glass coverslip were washed with PBS and fixed with 4% paraformaldehyde for 30 min. After permeabilization with 0.5% Triton X-100 for 10 min, the samples were then stained with TRITC-labeled phalloidin (Sigma) and DAPI for 5 min. Cells were washed four times with PBS and mounted on glass slides with mounting medium (Invitrogen). All images were obtained with a Zeiss LSM 510 confocal microscope.
Protein Extract and Western Blots.
Mice hearts were homogenized in ice-cold lysis buffer [25 mM Tris (pH 7.5), 10 mM EDTA, 10 mM EGTA, 1% Nonidet P-40, 10 μg/ml leupeptin, 2 μg/ml aprotinin, 20 μg/ml PMSF, 100 μM NaF, 50 μM NaPPi, 10 μM Na3VO4]. The lysates were kept on ice for 15 min and then cleared by ultracentrifugation at 150,000 × g for 20 min. Fifty to 60 μg of cell extracts were separated by SDS/PAGE. For Western blot analysis, gels were blotted to a PVDF membrane. Blots were sequentially incubated with 5% milk for 1 h in Tris-buffered saline plus 0.1% Triton 100, in primary antibody, anti-P-Akt 473 (1:500), anti-Akt (1:1,000), anti-P-IGF1R (Y1135/1136)/IR (Y1150/1151) (19H7), anti-mTOR, anti-P-mTOR (1:1,000), anti-IR and anti-IGF1R for 1.5 h or overnight, and then in secondary antibody for 1 h. After blotting, signals were detected by ECL (Amersham Biosciences). All primary antibodies were purchased from Cell Signaling Technologies.
Body Composition Analysis.
Body composition was measured in nonanesthetized mice with the Echo 3-in-1 NMR analyzer (Echo Medical Systems).
Body Temperature.
Body temperature was measured with a rectal probe (model TH-5; Braintree Scientific).
Indirect Calorimetry.
Oxygen consumption and carbon dioxide production were measured with a four-chamber Oxymax system (Columbus Instruments) with one mouse per chamber and by testing MT mice simultaneously with littermate controls (27). Motor activity (total and ambulating) was determined by infrared beam interruption (Opto-Varimex mini; Columbus Instruments). Mice had free access to food and water. Total oxygen consumption was measured for 24 h at room temperature (23°C), and energy expenditure was calculated as the average of all points excluding the data from the 1st h of the experiment.
Biochemical Assays.
Blood was obtained from the tail vein or retroorbital sinus in the nonfasted state. Blood and serum glucose levels were measured with a Glucometer Elite (Bayer). Serum insulin, leptin, and adiponectin were assayed by RIA (Linco Research). Serum triglycerides (Thermo DMA) and free fatty acid (Roche Applied Science) were measured according to the manufacturers' procedures.
Insulin Tolerance Test.
Insulin tolerance tests were performed on nonfasted mice at 8 a.m. Human insulin (Humulin R; Eli Lilly) was injected i.p. (0.75 units/kg). Blood glucose levels were measured 0, 15, 30, 45, 60, 90, and 120 min after the injection.
X-Ray Images.
X-ray images were obtained with a Kodak Image Station 4000 multimodal imager with x-ray imaging module (Kodak Molecular Imaging Systems).
Statistical Analysis.
Data are expressed as means ± SE. Statistical significance between the groups was determined with Sigma Stat (SPSS, Inc.), with two-way ANOVA or t test as appropriate.
ACKNOWLEDGMENTS.
We thank Duc Ha, Jonathan Logue, and Valarmathi Thiruvanamalai for technical assistance; Susan Garfield and Poonam Mannan (Center for Cancer Research Confocal Microscopy Core Facility, National Cancer Institute) for technical support; Dawn Walker for valuable comments; Steve Neal for artwork; and Anna Mazzuca for editorial assistance. This work was supported in part by the Intramural Research Program of the National Cancer Institute/National Institutes of Health (NCI/NIH), federal funds from NCI/NIH Contract N01-CO12400, the National Institute of Diabetes, Digestive and Kidney Diseases/NIH, and the National Institute of Dental and Craniofacial Research/NIH.
Footnotes
The authors declare no conflict of interest.
References
- 1.Bera TK, Zimonjic DB, Popescu NC, Sathyanarayana BK, Kumar V, Lee BK, Pastan I. Proc Natl Acad Sci USA. 2002;99:16975–16980. doi: 10.1073/pnas.262655399. [DOI] [PMC free article] [PubMed] [Google Scholar]
- 2.Bera TK, Saint Fleur A, Lee Y, Kydd A, Hahn Y, Popescu NC, Zimonjic DB, Lee B, Pastan I. Cancer Res. 2006;66:52–56. doi: 10.1158/0008-5472.CAN-05-3014. [DOI] [PubMed] [Google Scholar]
- 3.Bera TK, Saint Fleur A, Ha D, Yamada M, Lee Y, Lee B, Hahn Y, Kaufman DS, Pera M, Pastan I. Stem Cells Dev. 2008 doi: 10.1089/scd.2007.0079. in press. [DOI] [PMC free article] [PubMed] [Google Scholar]
- 4.Bera TK, Huynh N, Maeda H, Sathyanarayana BK, Lee BK, Pastan I. Gene. 2004;337:45–53. doi: 10.1016/j.gene.2004.05.009. [DOI] [PubMed] [Google Scholar]
- 5.Hahn Y, Bera TK, Pastan IH, Lee BK. Gene. 2006;366:238–245. doi: 10.1016/j.gene.2005.07.045. [DOI] [PubMed] [Google Scholar]
- 6.Lee Y, Ise T, Ha D, Saint Fleur A, Hahn Y, Liu XF, Nagata S, Lee B, Bera TK, Pastan I. Proc Natl Acad Sci USA. 2006;103:17885–17890. doi: 10.1073/pnas.0608344103. [DOI] [PMC free article] [PubMed] [Google Scholar]
- 7.Bultman SJ, Michaud EJ, Woychik RP. Cell. 1992;71:1195–1204. doi: 10.1016/s0092-8674(05)80067-4. [DOI] [PubMed] [Google Scholar]
- 8.Yaswen L, Diehl N, Brennan MB, Hochgeschwender U. Nat Med. 1999;5:1066–1070. doi: 10.1038/12506. [DOI] [PubMed] [Google Scholar]
- 9.Huszar D, Lynch CA, Fairchild-Huntress V, Dunmore JH, Fang Q, Berkemeier LR, Gu W, Kesterson RA, Boston BA, Cone RD, et al. Cell. 1997;88:131–141. doi: 10.1016/s0092-8674(00)81865-6. [DOI] [PubMed] [Google Scholar]
- 10.Balthasar N, Dalgaard LT, Lee CE, Yu J, Funahashi H, Williams T, Ferreira M, Tang V, McGovern RA, Kenny CD, et al. Cell. 2005;123:493–505. doi: 10.1016/j.cell.2005.08.035. [DOI] [PubMed] [Google Scholar]
- 11.Michaud JL, Boucher F, Melnyk A, Gauthier F, Goshu E, Levy E, Mitchell GA, Himms-Hagen J, Fan CM. Hum Mol Genet. 2001;10:1465–1473. doi: 10.1093/hmg/10.14.1465. [DOI] [PubMed] [Google Scholar]
- 12.King BM. Physiol Behav. 2006;87:221–244. doi: 10.1016/j.physbeh.2005.10.007. [DOI] [PubMed] [Google Scholar]
- 13.Fry M, Hoyda TD, Ferguson AV. Exp Biol Med. 2007;232:14–26. [PubMed] [Google Scholar]
- 14.Conlon I, Raff M. Cell. 1999;96:235–244. doi: 10.1016/s0092-8674(00)80563-2. [DOI] [PubMed] [Google Scholar]
- 15.Weinkove D, Leevers SJ. Curr Opin Genet Dev. 2000;10:75–80. doi: 10.1016/s0959-437x(99)00042-8. [DOI] [PubMed] [Google Scholar]
- 16.Shioi T, McMullen JR, King PM, Douglas PS, Obata T, Franke TF, Cantley LC, Izumo S. Mol Cell Biol. 2002;22:2799–2809. doi: 10.1128/MCB.22.8.2799-2809.2002. [DOI] [PMC free article] [PubMed] [Google Scholar]
- 17.Zhang Y, Procenca R, Maffei M, Barone M, Leopold L, Friedman JM. Nature. 1994;372:425–432. doi: 10.1038/372425a0. and erratum (1995) 374:479. [DOI] [PubMed] [Google Scholar]
- 18.Chen H, Chariat O, Tartaglia LA, Woolf EA, Weng X, Ellis SJ, Lakey ND, Culpepper J, More KJ, Breitbart RE, et al. Cell. 1996;84:491–495. doi: 10.1016/s0092-8674(00)81294-5. [DOI] [PubMed] [Google Scholar]
- 19.Chua SC, Jr, Chung WK, Wu-peng S, Zhang Y, Liu SM, Tartaglia L, Leibel RL. Science. 1995;271:994–996. doi: 10.1126/science.271.5251.994. [DOI] [PubMed] [Google Scholar]
- 20.Cool DR, Normant E, Shen F, Chen HC, Pannell L, Zhang Y, Loh YP. Cell. 1997;88:73–83. doi: 10.1016/s0092-8674(00)81860-7. [DOI] [PubMed] [Google Scholar]
- 21.Stubdal H, Lynch CA, Moriarty A, Fang Q, Chickering T, Deeds JD, Fairchild-Huntress V, Charlat O, Dunmore JH, Kleyn P, et al. Mol Cell Biol. 2000;20:878–882. doi: 10.1128/mcb.20.3.878-882.2000. [DOI] [PMC free article] [PubMed] [Google Scholar]
- 22.Yen TY, Gill AM, Frigeri LG, Barsh GS, Wolff GL. FASEB J. 1994;8:479–488. doi: 10.1096/fasebj.8.8.8181666. [DOI] [PubMed] [Google Scholar]
- 23.Gavrilova O, Haluzik M, Matsusue K, Cutson JJ, Johnson L, Dietz KR, Nicol CJ, Vinson C, Gonzalez FJ, Reitman ML. J Biol Chem. 2003;278:34268–34276. doi: 10.1074/jbc.M300043200. [DOI] [PubMed] [Google Scholar]
- 24.Dong C, Li WD, Geller F, Lei L, Li D, Goriova OY, Hebebrand J, Amos CI, Nicholls RD, Price RA. Am J Hum Genet. 2005;76:427–437. doi: 10.1086/428438. [DOI] [PMC free article] [PubMed] [Google Scholar]
- 25.Tessarollo L. Methods Mol Biol. 2001;158:47–63. doi: 10.1385/1-59259-220-1:47. [DOI] [PubMed] [Google Scholar]
- 26.Laird PW, Zijderveld A, Linders K, Rudnicki MA, Jaenisch R, Berns A. Nucleic Acids Res. 1991;19:4293. doi: 10.1093/nar/19.15.4293. [DOI] [PMC free article] [PubMed] [Google Scholar]
- 27.Gavrilova O, Marcus-Samuels B, Reitman ML. Diabetes. 2000;49:1910–1916. doi: 10.2337/diabetes.49.11.1910. [DOI] [PubMed] [Google Scholar]
- 28.Paxinos G, Franklin KBJ. The Mouse Brain in Stereotactic Coordinates. Amsterdam: Elsevier; 2001. [Google Scholar]