Abstract
The time at which the N-ethylmaleimide-sensitive factor (NSF) acts during synaptic vesicle (SV) trafficking was identified by time-controlled perturbation of NSF function with a photoactivatable inhibitory peptide. Photolysis of this caged peptide in the squid giant presynaptic terminal caused an abrupt (0.2 s) slowing of the kinetics of the postsynaptic current (PSC) and a more gradual (2–3 s) reduction in PSC amplitude. Based on the rapid rate of these inhibitory effects relative to the speed of SV recycling, we conclude that NSF functions in reactions that immediately precede neurotransmitter release. Our results indicate the locus of SNARE protein recycling in presynaptic terminals and reveal NSF as a potential target for rapid regulation of transmitter release.
Keywords: caged probes, exocytosis, synaptic transmission, synaptic vesicle cycle
Neurotransmitter release relies on the precisely coordinated actions of many proteins that serve to recruit synaptic vesicles (SVs) to active zones, prepare SVs for Ca2+-dependent exocytosis, and recycle used components (1–5). At the core of these trafficking reactions lies the SNARE [soluble N-ethylmaleimide sensitive factor (NSF) attachment protein receptor] complex, which consists of proteins present in SVs (v-SNAREs) and the plasma membrane (t-SNAREs) (6). It is thought that trans-SNARE complexes bridging the SV and plasma membranes bring these two membranes into close apposition and mediate membrane fusion (7, 8). Because SNARE complexes are highly stable, hydrolysis of ATP by the molecular chaperone NSF (9, 10) is required to disassemble used SNARE complexes and, thereby, recycle SNARE proteins in preparation for future rounds of exocytosis (11–13). Although it is generally agreed that this action of NSF is important for neurotransmitter release, it is not clear whether NSF works before or after vesicle fusion. This distinction is critical for understanding the dynamic control of synaptic transmission by NSF and elucidating the life cycle of SNARE complexes during SV trafficking.
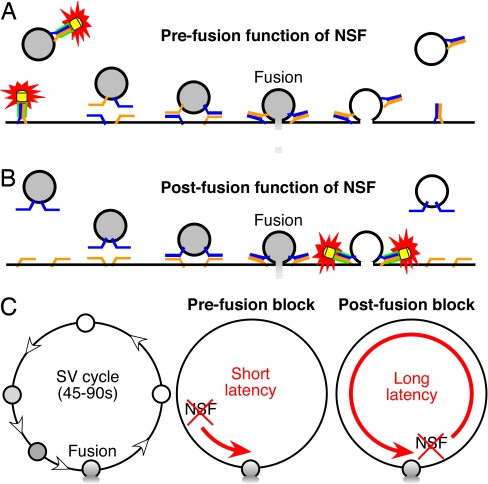
Two models have been proposed for the timing of NSF action during neurotransmitter release (Fig. 1). SNAREs could be disassembled just before fusion, meaning that NSF is active only when needed for a fusion reaction (Fig. 1A). This model is consistent with observations that NSF is required before vesicle fusion in several experimental systems (14–20). Alternatively, NSF could dissociate SNARE complexes immediately after neurotransmitter release (Fig. 1B). Such a postfusion action of NSF could provide an attractive mechanism for sorting of v- and t-SNAREs after fusion: in this case, newly separated v-SNAREs would be carried along as recycled SVs bud from the plasma membrane, whereas t-SNAREs would remain behind in the plasma membrane. Although experimental evidence supporting this conclusion is limited (21, 22), the ability to explain SNARE sorting makes a postfusion action of NSF part of most current models of SV trafficking (8, 23–26).
Fig. 1.
Models of NSF function. (A) NSF acting upstream of neurotransmitter release. Colors indicate NSF (yellow), αSNAP (green), v-SNARE (blue), and t-SNAREs (orange). (B) Model showing a postfusion role of NSF. (C) Because the SV cycle requires 45–90 s (Left), a prefusion block of NSF action would occur much more quickly (Center), whereas a postfusion block would require all or most of the 45–90 s (Right).
One way to distinguish between these two alternatives is to inactivate the function of NSF acutely in living presynaptic nerve terminals. A postfusion block of NSF would slowly inhibit transmitter release, over the 45–90 s required for SV cycling (27), whereas a prefusion block would more rapidly inhibit release (Fig. 1C). We therefore designed and synthesized a light-sensitive (caged) inhibitor of NSF. Our strategy was based on incorporating a caging group onto a key amino acid of a peptide that blocks the αSNAP-stimulated ATPase activity of NSF in vitro (28–30). This peptide prevents the NSF-mediated disassembly of the SNARE complex (30) and inhibits neurotransmitter release when injected into presynaptic terminals (28, 31).
By using this caged peptide to perturb NSF function, we found that the amount of neurotransmitter release was inhibited with a latency ranging from 1.6 to 3.2 s. Furthermore, the kinetics of neurotransmitter release was decreased even more rapidly, with a latency of 0.2 s. These very rapid actions of the uncaged inhibitory peptide lead us to conclude that the physiologically relevant locus of NSF action in the SV cycle is immediately upstream of membrane fusion and release of neurotransmitter.
Results
Design of Caged NSF3 (cNSF3) Peptide.
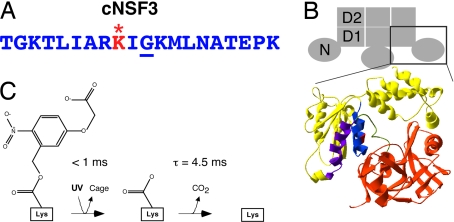
Our caged NSF inhibitor was based on the NSF3 peptide (28) derived from the D1 domain of squid NSF (Fig. 2 A and B). Structural data suggests that the amino acid residues constituting this peptide are located at the external surface of the D1 domain, in close proximity to the N domain (Fig. 2B, blue). A glycine residue within this segment of NSF (Fig. 2A, underlined) is critical for the actions of both NSF (32, 33) and the NSF3 peptide (28). We sought to disrupt the active conformation of the peptide by placing a caging group onto the side chain of an amino acid near this glycine. For this purpose, we used a ((5-carboxy-methoxy-2-nitrobenzyl)oxy)carbonyl (CMNCBZ) cage (Fig. 2C) that was attached to a surface-exposed lysine residue (Fig. 2A, red) two residues upstream of the critical glycine residue. After UV illumination, photolysis of this cage proceeds in two steps (Fig. 2C). The first step takes <1 ms and causes most of the cage to dissociate from the peptide; the second step, a spontaneous decarboxylation, is almost complete within 15 ms (34). The photolyzed peptide may assume its active conformation after the first step, but after the subsequent decarboxylation step it should be identical to the noncaged NSF3 peptide. Therefore the peptide should be in an active conformation within a few milliseconds or less after UV illumination.
Fig. 2.
Design of the cNSF3 peptide. (A) Sequence of the squid NSF3 peptide. Underlined residue is G309, the Comatose locus (corresponds to G274 in NSF-1 of Drosophila). The caged lysine residue K307 is in red and marked by *. (B) Schematic representation of NSF with structural elements contributing to the lateral surfaces of the N and D1 domains. (Upper) N, D1, and D2 denote the three domains of a NSF monomer; the schematic side view shows only three subunits of the hexamer. (Lower) Predicted structure of the N and D1 domains of NSF, based on coordinates taken from the NSF homologue P97 (71). The 2.5-nm-thick slab shows the N domain in orange, D1 domain in yellow, the NSF3 peptide in blue, and the caged lysine residue in red. Other active NSF peptides (28) are indicated in green (NSF1) and purple (NSF2). (C) Photochemistry of CMNCBZ-caged lysine. Absorption of a photon of UV light rapidly removes most of the cage, whereas a slower spontaneous decarboxylation removes the rest and generates free CO2 (34).
Photolysis of Caged Peptide Inhibits Neurotransmitter Release.
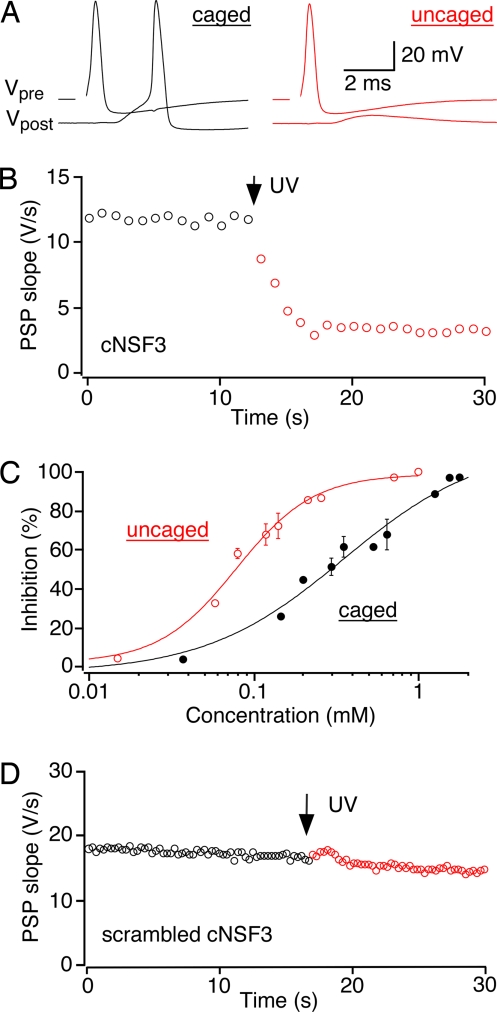
To define when NSF is required in the SV cycle, the cNSF3 peptide was microinjected into the presynaptic terminal of the squid giant synapse at concentrations of 0.05–2.5 mM, while we monitored synaptic transmission via recordings of presynaptic potentials and postsynaptic potentials (PSPs). The CMNCBZ cage masked the inhibitory activity of the peptide, because in each of 66 experiments uncaging the peptide with a brief pulse of UV light inhibited synaptic transmission (Fig. 3A). The time course of this block was rapid, occurring within a few seconds or less (Fig. 3B). Synaptic transmission decreased during cNSF3 injection, indicating that the cage did not completely neutralize peptide activity (Fig. 3C). However, the CMNCBZ cage caused a 4-fold increase in the IC50 of cNSF3 (0.35 ± 0.08 mM) compared with noncaged peptide (0.08 ± 0.01 mM), which gave us sufficient dynamic range to control NSF function.
Fig. 3.
Photolysis of cNSF in the presynaptic terminal. (A) Inhibition of synaptic transmission after uncaging microinjected cNSF3 (0.75 mM) in the giant terminal of the squid. Action potentials were elicited every 1 s. Simultaneous presynaptic (Vpre) and postsynaptic (Vpost) voltage recordings immediately before (black) and after (red) uncaging (stimulation artifact blanked) are shown. (B) Rapid time course of inhibitory effects of uncaged NSF3. The slope of the PSP was determined from fits to the initial rise of the PSP and plotted as a function of time. UV light was applied for 50 ms (arrow, ≈150 mJ/mm2). The terminal was injected with 0.75 mM cNSF3. (C) Concentration-dependent inhibition of synaptic transmission by cNSF3 peptide (black closed circles, n = 14) and uncaged peptide (red open circles, n = 14). See SI Text for further details. (D) Lack of effect of photolysis of scrambled cNSF3 peptide (0.64 mM). UV light (750 mJ/mm2) was applied three times at the point indicated by the arrow.
Previous work has established the specificity of noncaged NSF3 peptide. Key arguments are that: (i) both NSF3 and another peptide from the external surface of the D1 domain have identical inhibitory effects on both ATPase activity and synaptic transmission; and (ii) mutation of the glycine residue, which inhibits NSF function in vivo (32, 33), completely abolishes the ability of NSF3 to inhibit both ATPase activity and synaptic transmission (28). Mass spectroscopy reveals that exposure to UV light produces a peptide that is identical to noncaged NSF3 (unpublished data), so that the biochemical properties of NSF3 defined in previous work (28, 31) should fully apply to uncaged cNSF3. Nonetheless, to consider possible side effects of uncaging cNSF3, we performed two control experiments. First, we uncaged a scrambled NSF3 peptide. This peptide had the same amino acid composition as cNSF3, including the presence of a CMNCBZ-caged lysine residue, but it does not resemble NSF3. In a total of 11 experiments, photolysis of this control peptide produced no effect on synaptic transmission, even when illuminating the terminal with up to 750 mJ/mm2 and at free cage concentrations as high as 0.9 mM (Fig. 3D). Photolysis of a second control compound, CMNCBZ-caged rhodamine, was similarly ineffective (n = 5; data not shown). These results indicate that inhibition of neurotransmitter release was caused directly by the liberated NSF3 peptide, rather than by UV illumination or production of free CMNCBZ cage or CO2. Thus, caging a single lysine residue decreased the biological activity of the NSF3 peptide ≈4-fold, allowing flash photolysis to very rapidly control the molecular machinery of neurotransmitter release.
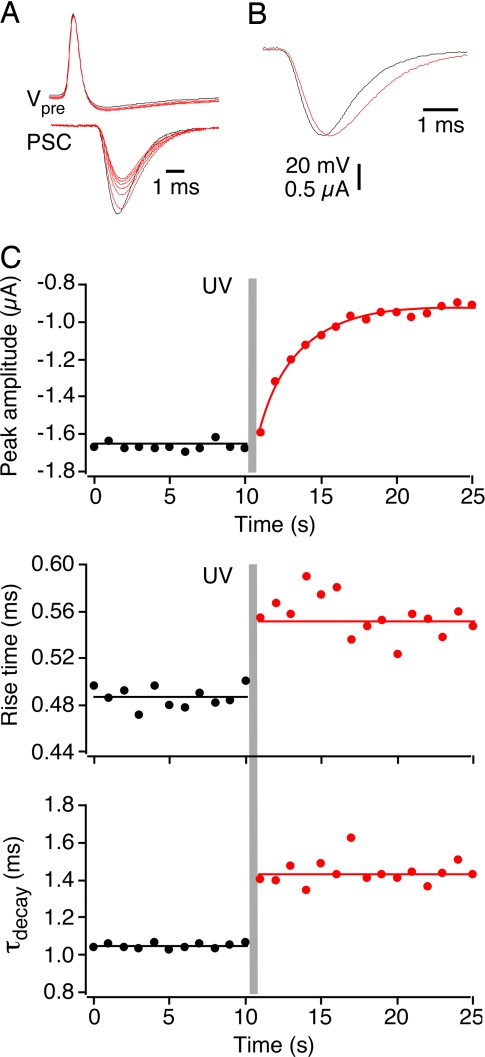
The NSF3 peptide both decreases synaptic transmission and slows the kinetics of neurotransmitter release (28). To determine the relationship between these two actions, we examined how quickly each developed after cNSF3 photolysis. For this purpose, postsynaptic currents (PSCs) were recorded while photolyzing cNSF3. Fig. 4A shows a series of simultaneous presynaptic and postsynaptic recordings during photolysis of cNSF3. PSCs were elicited every second, with the preflash PSC shown as a black trace in Fig. 4A. After a pulse of UV light, which was applied at the same time as a presynaptic action potential, the next PSC was virtually unchanged in amplitude, yet clearly had slower kinetics (Fig. 4A, largest red trace). Both PSC rise time and decay were slowed after peptide uncaging, as readily observed when comparing PSCs scaled with the same peak amplitude (Fig. 4B). Although this change in PSC kinetics was virtually immediate, occurring in <1 s, the inhibition of PSC amplitude required several seconds for completion (Fig. 4C). Similar results were obtained in a total of 14 experiments. Hence, temporally precise activation of the caged peptide revealed distinct time courses for the two actions of NSF3: a fast effect on the kinetics of neurotransmitter release and a slower effect on the amount of neurotransmitter released.
Fig. 4.
Differential onset of amplitude and kinetic effect. (A) Simultaneous presynaptic and postsynaptic recordings before (black line) and after (red line) photolysis of cNSF3 peptide. Synapse was stimulated at 1 Hz. (B) Scaled PSCs, from the experiment shown in A, before (black) and after (red) uncaging of NSF3. (C) Onset of changes in PSC amplitude (Top), PSC rise time (20–80%; Middle), and PSC decay time constant (Bottom). UV light (150 mJ/mm2) was applied at the 10-s time point (gray bar).
Time Course of the Two Responses to Uncaged NSF3.
We quantified the time course of the slow effect of NSF3 by fitting exponential functions to data such as those shown in Fig. 4C Upper. The time constant for inhibiting PSC amplitude was activity-dependent and ranged from 3.1 s at 0.2 Hz to 1.6 s at 5 Hz (Fig. 5A). This acceleration of the rate of inhibition at higher rates of stimulation is consistent with previous observations of the activity dependence of this peptide (28) and full-length NSF (32, 33). Uncaged NSF3 also had some effect in the absence of activity: when stimulating at 0.2 Hz, the first PSC evoked 5 s after photolysis of the peptide was reduced by 75% (Fig. 5A). This finding may reflect a continuous activity of NSF (20) in the resting presynaptic terminal. Thus, NSF regulates the amount of neurotransmitter release over a time scale of a few seconds or less.
Fig. 5.
Activity dependency and onset of fast effect. (A) Time course of the slow effect of uncaged NSF3 on PSC amplitude. The fractional reduction of PSC amplitude is plotted as a function of time after peptide photolysis. Continuous curves are exponential functions with time constants of 1.6 s (5 Hz) and 3.1 s (0.2 Hz). Data points reflect 7 and 10 independent experiments, respectively. (B) Time course of the rapid effect of uncaged NSF3 on PSC kinetics. The fractional slowing of PSC decay time constant is plotted as a function of the time interval (Δt) between the UV light flash (UV) and the presynaptic stimulus (APpre). (Inset) The experimental protocol is illustrated. Data from eight independent experiments using two stimulus frequencies (0.2 Hz, circles; 1 Hz, triangles) were pooled (squares) because the two data sets did not differ. The continuous curve is an exponential function with a time constant of 0.22 s. (C) Time course of the rapid inhibition of PSC kinetics by uncaged NSF3 under conditions of minimal synaptic activity (0.03 Hz). The continuous curve is an exponential function with a time constant of 0.5 s. Each point is from two to five experiments. (D) Concentration-dependent inhibition of PSC amplitude (open circles, IC50 = 0.28 ± 0.02 mM) and decay kinetics (closed circles, IC50 = 0.06 ± 0.01 mM) by uncaged NSF3. Each point is from three to nine experiments.
Given the rapid effect of uncaged NSF3 upon release kinetics, a different procedure was needed to determine the time course of this effect. For this purpose, we uncaged cNSF3 at different intervals preceding an action potential (Fig. 5B Inset). At very brief time intervals, the amount of slowing of PSC kinetics was minimal, but the slowing effect was complete if the light flash occurred 1 s before the synapse was activated. The relationship between preflash interval (Δt) and degree of slowing of the PSC decay was described by an exponential function with a time constant of 0.22 s (Fig. 5B). This time constant represents an upper estimate of the time period when NSF3 affects release kinetics, because of possible delays associated with photolysis of the CMNCBZ cage and with binding of uncaged NSF3 peptide to its target. Therefore, NSF regulates the kinetics of release over a time scale of 0.22 s or faster.
Because the time scales of the inhibitory effects of uncaged NSF3 peptide are very rapid relative to the tens of seconds or longer required for vesicles to recycle via conventional [45–90 s (27)] or kiss-and-run [t ≈20 s (35, 36)] mechanisms of endocytosis, our data argue that NSF is required before neurotransmitter release occurs rather than acting after membrane fusion (Fig. 1). However, the rate of synaptic activity in the experiments shown in Fig. 5 A and B may cause a redistribution of SNARE complexes to the plasma membrane; if NSF was required to dissociate these cis-SNARE complexes after fusion, then inhibiting such a postfusion action of NSF might prevent transmitter release by accumulating SNARE complexes in the plasma membrane. To examine this possibility, the experiments were repeated at a minimal rate of synaptic activity (0.03 Hz). The rate of onset of the kinetic effect was very similar at this low rate of stimulation, with a time constant of ≈0.5 s (Fig. 5C). This observation reveals that uncaged NSF3 peptide rapidly slows the kinetics of release even under conditions where plasma membrane accumulation of SNARE complexes should be minimal, reinforcing the conclusion that NSF works before membrane fusion.
The temporally distinct effects of uncaged NSF3 on release magnitude and kinetics suggest that the peptide causes these two effects via separate mechanisms. Further support for this comes from analysis of the concentration dependence of these two effects (Fig. 5D). The fast effect occurred at higher concentrations of NSF3 (IC50 of 0.28 ± 0.02 mM) than the slow effect (IC50 of 0.06 ± 0.01 mM). Thus, binding of NSF3 at two different sites may affect two separate NSF-dependent reactions: a higher-affinity one that slowly affects the magnitude of transmitter release and a lower-affinity one that rapidly affects the kinetics of release. Alternatively, NSF3 may bind at only one site, with the difference in affinity and functional effects reflecting different conformational states of the binding site [e.g., ATP- versus ADP-bound states of NSF (12, 37)].
NSF3 Does Not Prevent Membrane Fission.
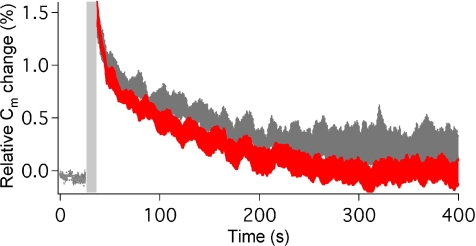
To further address a possible postfusion role for NSF, we asked whether photolysis of cNSF3 directly affects endocytic membrane retrieval. By taking advantage of the slower kinetics of endocytosis relative to exocytosis, we could temporally uncouple endocytosis from exocytosis by selectively uncaging cNSF3 after exocytosis was completed. Presynaptic membrane capacitance was directly measured at the nerve terminal in the unperturbed state (Fig. 6, gray) and immediately after cNSF3 photolysis (Fig. 6, red). After an initial increase in capacitance, resulting from exocytosis triggered by high-frequency stimulation (Fig. 6, gray area), the capacitance decreased gradually to baseline. The decays could be described with exponential functions with time constants of 149 ± 29 s before and 131 ± 22 s after photolysis of cNSF. These values were not significantly different (n = 5, P = 0.15, t test), indicating that the speed of endocytosis is not affected by inhibiting NSF function. Thus, if NSF has any postfusion role, this role does not affect the rate of membrane fission during endocytosis and is not rate-limiting for exocytosis.
Fig. 6.
Endocytosis unaffected by cNSF photolysis. Time course of endocytosis before (gray) and after (red) photolysis of cNSF3. Relative Cm change is shown as a range (mean ± SEM, gray and red zones for five independent experiments. Time of high-frequency stimulaton is shown by the gray bar; cNSF photolysis occurs immediately afterward, in the case of the trace shown in red.
Discussion
We have used a caged inhibitor peptide to provide information about the timing of NSF action in SV trafficking. Our studies provide much higher time resolution (milliseconds) than was possible in previous work, including studies of a Drosophila temperature-sensitive NSF mutation (22, 33). Because of this high time resolution, we could determine that NSF participates in two rapid reactions with time constants of a few seconds or less. Both the fast (0.22 s) and slow (2–3 s) effects of the NSF3 peptide occur on a time scale much faster than SV endocytosis and recycling (27, 35, 36), so we conclude that these effects represent prefusion actions of NSF (Fig. 7A). Formally speaking, NSF could still have additional actions after vesicle fusion (22). Although our capacitance measurements indicate that NSF action is not required for endocytic membrane retrieval, other postfusion actions could be masked by the rapid effect of the photolyzed peptide on exocytosis and therefore remain undetected. Nevertheless, our results indicate that a prefusion action of NSF must be responsible for the ability of this chaperone to regulate the magnitude and kinetics of transmitter release. This study extends previous work, largely done in non-neuronal cells, suggesting that NSF participates in vesicle priming and resolves a long-standing question about when NSF functions in SV trafficking.
Fig. 7.
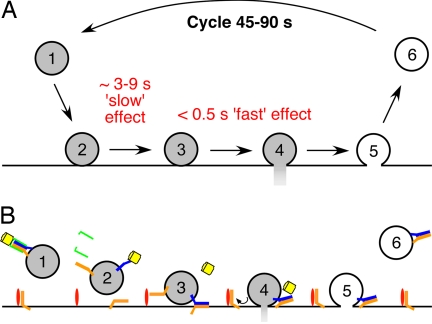
Model of NSF function and life cycle of SNARE proteins. (A) Model for the dual actions of NSF in transmitter release. A complete cycle of SV trafficking requires 45–90 s (27). After vesicle docking (nos. 1–2 transition), the slow action of NSF primes SVs over a time scale of seconds. Readily releasable vesicles (no. 3; highlighted red) can then fuse in a calcium-dependent reaction that is influenced by NSF acting within a time window of <0.5 s. After membrane fusion, vesicles bud off from the plasma membrane (nos. 5–6 transition) and are then recycled (nos. 6–1 transition). (B) Postulated dynamics of SNARE proteins during exocytosis. (No. 1) SVs and plasma membrane contain cis-SNARE complexes, to which αSNAP and NSF bind (41). Plasma membrance cis-SNARE complexes are not shown for clarity. (No. 2) αSNAP and SNAREs stimulate the ATPase activity of NSF, causing disassembly of cis-SNARE complexes. NSF may remain bound on SV even after unbinding of αSNAP (17). (No. 3) Free SNARE proteins from trans-SNARE complexes. To promote sorting, ectopic SNARE proteins may bind to acceptor proteins. For clarity, only the accepter protein (e.g. Munc18) for vesicular t-SNARE proteins is shown (red). (No. 4) As a result of membrane fusion, ectopic SNARE protiens are sorted onto the correct compartment during the time that SV and plasma membranes are continuous. (No. 5) Cis-SNARE complexes are retrieved along with the SV membrane during endocytosis. (No. 6) Recycling SVs contain cis-SNARE complexes (44). NSF (yellow), αSNAP (green), v-SNARE (blue), t-SNARE (orange).
The slower, activity-dependent reaction occurring on a time scale of several seconds likely reflects the disassembly of cis-SNARE complexes upon docking of SV at the active zone (steps 1–3 in Fig. 7). Inhibition of the αSNAP-stimulated ATPase activity of NSF by uncaged NSF3 peptide (28) would prevent NSF-dependent disassembly of cis-SNARE complexes (30) and thereby reduce the amount of uncomplexed SNARE proteins available after SVs are docked at the active zone. This would reduce the amount of neurotransmitter release, which requires formation of trans-SNARE complexes (3–5), and could account for the increase in docked SVs in terminals injected with NSF3 (30) and the accumulation of transport vesicles at acceptor membranes in the absence of NSF (38, 39). Thus, NSF appears to prime tethered SVs for release, as previously concluded for non-neuronal forms of membrane fusion and also suggested for neurotransmitter release (14–20). This model can account for the activity dependence of NSF3 action: synaptic transmission would not be inhibited immediately after uncaging cNSF3, because of the presence of primed SVs at the active zone. Only after the activity-dependent depletion or time-dependent depriming of these SVs (20, 40) would the requirement for NSF to prime SVs become evident. It therefore appears that NSF disassembles cis-SNARE complexes over a time scale of a few seconds under physiological conditions. Sorting of disassembled v- and t-SNARE proteins to their appropriate compartments would then occur by the binding to compartment-specific partners during or shortly after fusion (Fig. 7B, arrow). Such a mechanism permits sorting of SNAREs while the membrane domains of SVs and the plasma membrane retain their identity. It can also account for experimental observations that SNARE complexes containing both v- and t-SNAREs exist in vesicle membranes (41–47) and that v-SNAREs can remain on the plasma membrane after endocytosis (48).
At first glance, this model could be challenged by biochemical measurements suggesting that both SVs and the plasma membrane contain an excess of free SNARE proteins (47, 49, 50), making the prefusion production of free SNARE proteins for trans-SNARE complex formation unnecessary. However, biochemical studies consider mainly bulk compartments such as reserve pool vesicles or total plasma membrane, precluding extrapolation to the subset of SNARE proteins directly involved in exocytosis. Further, the presence of even a small number of cis-SNARE complexes at the fusion site might serve as a steric hindrance to membrane fusion, despite the presence of free SNARE proteins.
In addition to cis-SNARE complexes, NSF could act on several other protein complexes. For example, αSNAP recruitment to a complex containing only syntaxin and SNAP-25 (51, 52) causes strong stimulation of NSF ATPase activity and complex disassembly (53). Tomosyn/t-SNARE complexes also can be disassembled by αSNAP-stimulation of NSF (54). These mechanisms could regulate the availability of a pool of plasma membrane t-SNARES for the formation of trans-SNARE complexes. NSF has been suggested to regulate the trapping of t-SNAREs into hotspots by dynamin (55). The ATPase activity of NSF could release t-SNARES from this trap just before trans-SNARE pairing and membrane fusion (55). In summary, photolysis of cNSF3 could cause abrupt freezing of cis-SNARE complexes, binary SNARE complexes, tomosyn-t-SNARE complexes, and/or t-SNARE/dynamin complexes. Such effects, either separately or in concert, could account for the slower, activity-dependent component of the response to uncaged NSF3. Together, these mechanisms may constitute the contributions of NSF to ATP-dependent priming (42) of SVs.
The fast NSF-dependent reaction that affects release kinetics (steps 3–4 in Fig. 7) could result from a desynchronization of release events or a direct modulation of the fusion reaction by NSF, as has been suggested in other studies (56–58). The fast NSF3 effect is similar in time course to priming of the fusion machinery, which precedes release by 45–250 ms (59) and requires ATP hydrolysis (14, 60, 61). Although the rate of αSNAP-stimulated ATPase activity in the native environment of the nerve terminal is unknown, the ATPase activity of NSF in vitro (62) appears to be too slow to support a reaction that occurs within a time scale of 0.2 s. The fast effect could be related to an ATPase-independent function of NSF (56), perhaps aiding proper folding and zippering up of SNARE complexes or optimizing the state of oligomerization of SNAREs (63).
In conclusion, or work indicates that NSF function is critical for highly dynamic reactions that occur immediately before SVs fuse with the presynaptic plasma membrane to release neurotransmitter. In addition to answering a long-standing question about the timing of NSF action during SV trafficking, our results indicate a potential locus for rapid regulation of neurotransmitter release by nitric oxide (30) or protein phosphorylation (64–66). Our work also defines the precise timing of a protein–protein interaction important for SV exocytosis, which will provide a temporal benchmark for future studies of the timing of other exocytotic interactions.
Materials and Methods
Caged Peptides.
CMNCBZ-caged lysine (67, 68) was synthesized as described in [supporting information (SI) Text]. This peptide was used to synthesize the following peptides: cNSF3, TGKTLIAR[K]IGKMLNATEPK (squid sequence) and scrambled cNSF3, GNIELATKT[K]ARIKLTMPKG. Details of peptide synthesis are provided in SI Text.
Electrophysiology.
The stellate ganglion was dissected from Loligo pealei, and recordings of synaptic transmission were done as described (69, 70). Caged peptide was microinjected into the giant presynaptic terminal and a shuttered argon ion laser (Coherent) was used for peptide photolysis. More details are described in SI Text.
Supplementary Material
ACKNOWLEDGMENTS.
We thank H. Tokumaru for many discussions and help with biochemical experiments; T. Schweizer for technical assistance; J. Rizo for suggesting NMR interaction studies of the NSF3 peptide with NSF domains; F. Filipp and M. Sattler for performing NMR interaction studies; and P. Hanson for discussions. T.K. was supported by a Grass Fellowship in Neuroscience, an Human Frontier Science Program long-term fellowship, and the Feodor-Lynen Program of the Alexander von Humboldt Foundation. Y.L. received a American Heart Association predoctoral fellowship. The research also was supported by National Institutes of Health Grants NS-21624 and NS-1771.
Footnotes
The authors declare no conflict of interest.
This article is a PNAS Direct Submission.
This article contains supporting information online at www.pnas.org/cgi/content/full/0707197105/DC1.
References
- 1.Augustine GJ, Burns ME, DeBello WM, Hilfiker S, Morgan JR, Schweizer FE, Tokumaru H, Umayahara K. J Physiol (London) 1999;520:33–41. doi: 10.1111/j.1469-7793.1999.00033.x. [DOI] [PMC free article] [PubMed] [Google Scholar]
- 2.Rettig J, Neher E. Science. 2002;298:781–785. doi: 10.1126/science.1075375. [DOI] [PubMed] [Google Scholar]
- 3.Jahn R, Sudhof TC. Annu Rev Biochem. 1999;68:863–911. doi: 10.1146/annurev.biochem.68.1.863. [DOI] [PubMed] [Google Scholar]
- 4.Sudhof TC. Nature. 1995;375:645–653. doi: 10.1038/375645a0. [DOI] [PubMed] [Google Scholar]
- 5.Rothman JE. Nature. 1994;372:55–63. doi: 10.1038/372055a0. [DOI] [PubMed] [Google Scholar]
- 6.Sollner T, Whiteheart SW, Brunner M, Erdjument BH, Geromanos S, Tempst P, Rothman JE. Nature. 1993;362:318–324. doi: 10.1038/362318a0. [DOI] [PubMed] [Google Scholar]
- 7.Weber T, Zemelman BV, McNew JA, Westermann B, Gmachl M, Parlati F, Sollner TH, Rothman JE. Cell. 1998;92:759–772. doi: 10.1016/s0092-8674(00)81404-x. [DOI] [PubMed] [Google Scholar]
- 8.Jahn R, Lang T, Sudhof TC. Cell. 2003;112:519–533. doi: 10.1016/s0092-8674(03)00112-0. [DOI] [PubMed] [Google Scholar]
- 9.Block MR, Glick BS, Wilcox CA, Wieland FT, Rothman JE. Proc Natl Acad Sci USA. 1988;85:7852–7856. doi: 10.1073/pnas.85.21.7852. [DOI] [PMC free article] [PubMed] [Google Scholar]
- 10.Wilson DW, Wilcox CA, Flynn GC, Chen E, Kuang WJ, Henzel WJ, Block MR, Ullrich A, Rothman JE. Nature. 1989;339:355–359. doi: 10.1038/339355a0. [DOI] [PubMed] [Google Scholar]
- 11.Sollner T, Bennett MK, Whiteheart SW, Scheller RH, Rothman JE. Cell. 1993;75:409–418. doi: 10.1016/0092-8674(93)90376-2. [DOI] [PubMed] [Google Scholar]
- 12.Hanson PI, Roth R, Morisaki H, Jahn R, Heuser JE. Cell. 1997;90:523–535. doi: 10.1016/s0092-8674(00)80512-7. [DOI] [PubMed] [Google Scholar]
- 13.Zinsmaier KE, Bronk P. Biochem Pharmacol. 2001;62:1–11. doi: 10.1016/s0006-2952(01)00648-7. [DOI] [PubMed] [Google Scholar]
- 14.Banerjee A, Barry VA, DasGupta BR, Martin T. J Biol Chem. 1996;271:20223–226. doi: 10.1074/jbc.271.34.20223. [DOI] [PubMed] [Google Scholar]
- 15.Burgoyne RD, Williams G. FEBS Lett. 1997;414:349–352. doi: 10.1016/s0014-5793(97)01031-4. [DOI] [PubMed] [Google Scholar]
- 16.Colombo MI, Taddese M, Whiteheart SW, Stahl PD. J Biol Chem. 1996;271:18810–18816. doi: 10.1074/jbc.271.31.18810. [DOI] [PubMed] [Google Scholar]
- 17.Mayer A, Wickner W, Haas A. Cell. 1996;85:83–94. doi: 10.1016/s0092-8674(00)81084-3. [DOI] [PubMed] [Google Scholar]
- 18.Nichols BJ, Ungermann C, Pelham HR, Wickner WT, Haas A. Nature. 1997;387:199–202. doi: 10.1038/387199a0. [DOI] [PubMed] [Google Scholar]
- 19.Tolar LA, Pallanck L. J Neurosci. 1998;18:10250–10256. doi: 10.1523/JNEUROSCI.18-24-10250.1998. [DOI] [PMC free article] [PubMed] [Google Scholar]
- 20.Xu T, Ashery U, Burgoyne RD, Neher E. EMBO J. 1999;18:3293–3304. doi: 10.1093/emboj/18.12.3293. [DOI] [PMC free article] [PubMed] [Google Scholar]
- 21.Grote E, Carr CM, Novick PJ. J Cell Biol. 2000;151:439–452. doi: 10.1083/jcb.151.2.439. [DOI] [PMC free article] [PubMed] [Google Scholar]
- 22.Littleton JT, Barnard RJ, Titus SA, Slind J, Chapman ER, Ganetzky B. Proc Natl Acad Sci USA. 2001;98:12233–12238. doi: 10.1073/pnas.221450198. [DOI] [PMC free article] [PubMed] [Google Scholar]
- 23.Chen YA, Scheller RH. Nat Rev Mol Cell Biol. 2001;2:98–106. doi: 10.1038/35052017. [DOI] [PubMed] [Google Scholar]
- 24.Li L, Chin LS. Cell Mol Life Sci. 2003;60:942–960. doi: 10.1007/s00018-003-2240-7. [DOI] [PMC free article] [PubMed] [Google Scholar]
- 25.Richmond JE, Broadie KS. Curr Opin Neurobiol. 2002;12:499–507. doi: 10.1016/s0959-4388(02)00360-4. [DOI] [PubMed] [Google Scholar]
- 26.Rizo J, Südhof TC. Nat Rev Neurosci. 2002;3:641–653. doi: 10.1038/nrn898. [DOI] [PubMed] [Google Scholar]
- 27.Betz WJ, Wu LG. Curr Biol. 1995;5:1098–1101. doi: 10.1016/s0960-9822(95)00220-x. [DOI] [PubMed] [Google Scholar]
- 28.Schweizer FE, Dresbach T, DeBello WM, O'Connor V, Augustine GJ, Betz H. Science. 1998;279:1203–1206. doi: 10.1126/science.279.5354.1203. [DOI] [PubMed] [Google Scholar]
- 29.Polgar J, Reed GL. Blood. 1999;94:1313–1318. [PubMed] [Google Scholar]
- 30.Matsushita K, Morrell CN, Cambien B, Yang SX, Yamakuchi M, Bao C, Hara MR, Quick RA, Cao W, O'Rourke B, et al. Cell. 2003;115:139–150. doi: 10.1016/s0092-8674(03)00803-1. [DOI] [PMC free article] [PubMed] [Google Scholar]
- 31.Parnas I, Rashkovan G, O'Connor V, El-Far O, Betz H, Parnas H. J Neurophysiol. 2006;96:1053–1060. doi: 10.1152/jn.01313.2005. [DOI] [PubMed] [Google Scholar]
- 32.Kawasaki F, Mattiuz AM, Ordway RW. J Neurosci. 1998;18:10241–10249. doi: 10.1523/JNEUROSCI.18-24-10241.1998. [DOI] [PMC free article] [PubMed] [Google Scholar]
- 33.Littleton JT, Chapman ER, Kreber R, Garment MB, Carlson SD, Ganetzky B. Neuron. 1998;21:401–413. doi: 10.1016/s0896-6273(00)80549-8. [DOI] [PubMed] [Google Scholar]
- 34.Papageorgiou G, Corrie JET. Tetrahedron. 1997;53:3917–3932. [Google Scholar]
- 35.Aravanis AM, Pyle JT, Tsien RW. Nature. 2003;423:643–647. doi: 10.1038/nature01686. [DOI] [PubMed] [Google Scholar]
- 36.Gandhi SP, Stevens CF. Nature. 2003;423:607–613. doi: 10.1038/nature01677. [DOI] [PubMed] [Google Scholar]
- 37.Brunger AT, DeLaBarre B. FEBS Lett. 2003;555:126–133. doi: 10.1016/s0014-5793(03)01107-4. [DOI] [PubMed] [Google Scholar]
- 38.Malhotra V, Orci L, Glick BS, Block MR, Rothman JE. Cell. 1988;54:221–227. doi: 10.1016/0092-8674(88)90554-5. [DOI] [PubMed] [Google Scholar]
- 39.Orci L, Malhotra V, Amherdt M, Serafini T, Rothman JE. Cell. 1989;56:357–368. doi: 10.1016/0092-8674(89)90239-0. [DOI] [PubMed] [Google Scholar]
- 40.Murthy VN, Stevens CF. Nat Neurosci. 1999;2:503–507. doi: 10.1038/9149. [DOI] [PubMed] [Google Scholar]
- 41.Hong RM, Mori H, Fukui T, Moriyama Y, Futai M, Yamamoto A, Tashiro Y, Tagaya M. FEBS Lett. 1994;350:253–257. doi: 10.1016/0014-5793(94)00778-0. [DOI] [PubMed] [Google Scholar]
- 42.Klenchin VA, Martin TFJ. Biochimie. 2000;82:399–407. doi: 10.1016/s0300-9084(00)00208-x. [DOI] [PubMed] [Google Scholar]
- 43.Otto H, Hanson PI, Jahn R. Proc Natl Acad Sci USA. 1997;94:6197–6201. doi: 10.1073/pnas.94.12.6197. [DOI] [PMC free article] [PubMed] [Google Scholar]
- 44.Steel GJ, Tagaya M, Woodman PG. EMBO J. 1996;15:745–752. [PMC free article] [PubMed] [Google Scholar]
- 45.Taubenblatt P, Dedieu JC, Gulik-Krzywicki T, Morel N. J Cell Sci. 1999;112:3359–3367. doi: 10.1242/jcs.112.20.3559. [DOI] [PubMed] [Google Scholar]
- 46.Ungermann C, Sato K, Wickner W. Nature. 1998;396:543–548. doi: 10.1038/25069. [DOI] [PubMed] [Google Scholar]
- 47.Walch-Solimena C, Blasi J, Edelmann L, Chapman ER, von Mollard GF, Jahn R. J Cell Biol. 1995;128:637–645. doi: 10.1083/jcb.128.4.637. [DOI] [PMC free article] [PubMed] [Google Scholar]
- 48.Fernandez-Alfonso T, Kwan R, Ryan TA. Neuron. 2006;51:179–186. doi: 10.1016/j.neuron.2006.06.008. [DOI] [PubMed] [Google Scholar]
- 49.Lang T, Margittai M, Holzler H, Jahn R. J Cell Biol. 2002;158:751–760. doi: 10.1083/jcb.200203088. [DOI] [PMC free article] [PubMed] [Google Scholar]
- 50.Takamori S, Holt M, Stenius K, Lemke EA, Gronborg M, Riedel D, Urlaub H, Schenck S, Brugger B, Ringler P, et al. Cell. 2006;127:831–846. doi: 10.1016/j.cell.2006.10.030. [DOI] [PubMed] [Google Scholar]
- 51.Fasshauer D, Otto H, Eliason WK, Jahn R, Brunger AT. J Biol Chem. 1997;272:28036–28041. doi: 10.1074/jbc.272.44.28036. [DOI] [PubMed] [Google Scholar]
- 52.An SJ, Almers W. Science. 2004;306:1042–1046. doi: 10.1126/science.1102559. [DOI] [PubMed] [Google Scholar]
- 53.Matveeva E, Whiteheart SW. FEBS Lett. 1998;435:211–214. doi: 10.1016/s0014-5793(98)01071-0. [DOI] [PubMed] [Google Scholar]
- 54.Hatsuzawa K, Lang T, Fasshauer D, Bruns D, Jahn R. J Biol Chem. 2003;278:31159–31166. doi: 10.1074/jbc.M305500200. [DOI] [PubMed] [Google Scholar]
- 55.Peters C, Baars TL, Buhler S, Mayer A. Cell. 2004;119:667–678. doi: 10.1016/j.cell.2004.11.023. [DOI] [PubMed] [Google Scholar]
- 56.Müller JM, Rabouille C, Newman R, Shorter J, Freemont P, Schiavo G, Warren G, Shima DT. Nat Cell Biol. 1999;1:335–340. doi: 10.1038/14025. [DOI] [PubMed] [Google Scholar]
- 57.Otter-Nilsson M, Hendriks R, Pecheur-Huet EI, Hoekstra D, Nilsson T. EMBO J. 1999;18:2074–2083. doi: 10.1093/emboj/18.8.2074. [DOI] [PMC free article] [PubMed] [Google Scholar]
- 58.Muller O, Bayer MJ, Peters C, Andersen JS, Mann M, Mayer A. EMBO J. 2002;21:259–269. doi: 10.1093/emboj/21.3.259. [DOI] [PMC free article] [PubMed] [Google Scholar]
- 59.Zenisek D, Steyer JA, Almers W. Nature. 2000;406:849–854. doi: 10.1038/35022500. [DOI] [PubMed] [Google Scholar]
- 60.Holz RW, Bittner MA, Peppers SC, Senter RA, Eberhard DA. J Biol Chem. 1989;264:5412–5419. [PubMed] [Google Scholar]
- 61.Parsons TD, Coorssen JR, Horstmann H, Almers W. Neuron. 1995;15:1085–1096. doi: 10.1016/0896-6273(95)90097-7. [DOI] [PubMed] [Google Scholar]
- 62.Tagaya M, Wilson DW, Brunner M, Arango N, Rothman JE. J Biol Chem. 1993;268:2662–2666. [PubMed] [Google Scholar]
- 63.Tokumaru H, Umayahara K, Pellegrini LL, Ishizuka T, Saisu H, Betz H, Augustine GJ, Abe T. Cell. 2001;104:421–432. doi: 10.1016/s0092-8674(01)00229-x. [DOI] [PubMed] [Google Scholar]
- 64.Liu Y, Cheng K, Gong K, Fu AK, Ip NY. J Biol Chem. 2006;281:9852–9858. doi: 10.1074/jbc.M513496200. [DOI] [PubMed] [Google Scholar]
- 65.Matveeva EA, Whiteheart SW, Vanaman TC, Slevin JT. J Biol Chem. 2001;276:12174–12181. doi: 10.1074/jbc.M007394200. [DOI] [PubMed] [Google Scholar]
- 66.Huynh H, Bottini N, Williams S, Cherepanov V, Musumeci L, Saito K, Bruckner S, Vachon E, Wang X, Kruger J, et al. Nat Cell Biol. 2004;6:831–839. doi: 10.1038/ncb1164. [DOI] [PubMed] [Google Scholar]
- 67.Mitchison TJ, Sawin KE, Theriot JA, Gee K, Mallavarapu A. Methods Enzymol. 1998;291:63–78. doi: 10.1016/s0076-6879(98)91007-2. [DOI] [PubMed] [Google Scholar]
- 68.Gee KR, Weinberg ES, Kozlowski DJ. Bioorg Med Chem Lett. 2001;11:2181–2183. doi: 10.1016/s0960-894x(01)00421-8. [DOI] [PubMed] [Google Scholar]
- 69.Augustine GJ, Eckert R. J Physiol (London) 1984;346:257–271. doi: 10.1113/jphysiol.1984.sp015020. [DOI] [PMC free article] [PubMed] [Google Scholar]
- 70.Augustine GJ, Charlton MP, Smith SJ. J Physiol (London) 1985;367:143–162. doi: 10.1113/jphysiol.1985.sp015818. [DOI] [PMC free article] [PubMed] [Google Scholar]
- 71.Zhang X, Shaw A, Bates P, Newman R, Gowen B, Orlova E, Gorman M, Kondo H, Dokurno P, Lally J, et al. Mol Cell. 2000;6:1473–1484. doi: 10.1016/s1097-2765(00)00143-x. [DOI] [PubMed] [Google Scholar]
Associated Data
This section collects any data citations, data availability statements, or supplementary materials included in this article.


