Abstract
We describe a novel method for isolating plasma-free peripheral blood mononuclear cells retaining intracellular efavirenz. Quantification of efavirenz in 13 human immunodeficiency virus-infected patients by liquid chromatography-tandem mass spectrometry showed a higher correlation of intracellular levels with unbound plasma levels (accumulation ratio, 1,190) than with total plasma levels.
Efavirenz, a nonnucleoside reverse transcriptase inhibitor, is a major component of current antiretroviral therapy for human immunodeficiency virus (HIV) type 1 infection. Several studies supported the idea of the usefulness of therapeutic drug monitoring of efavirenz, because viral suppression and adverse effects are associated with efavirenz levels in plasma (3, 9). Given that efavirenz exerts inhibitory activity with respect to reverse transcriptase and may interact with cellular enzymes within the cell, it is likely that intracellular levels are more relevant to the clinical outcome than plasma levels (10). Intracellular efavirenz levels have been explored using similar procedures, which consisted of preparation of peripheral blood mononuclear cells (PBMCs) by Ficoll density gradient centrifugation and cell washing with ice-cold phosphate buffered saline (PBS) (1, 2, 10). During our preliminary experiments, it was observed that efavirenz in PBS strongly stuck to the surface of plastic microcentrifuge tubes and was difficult to wash away with PBS. Such a property of adherence of efavirenz may have affected measurements of intracellular quantities in the previous protocols.
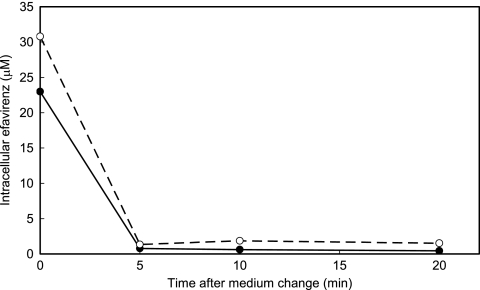
First, the efflux rate of efavirenz from cells was studied. PBMCs isolated from a healthy donor by use of Ficoll-Paque Plus solution (GE Healthcare, Piscataway, NJ) were incubated in 1 μM efavirenz in serum-free VP-SFM medium (Invitrogen, Carlsbad, CA) at 37°C for 1 h and then transferred to drug-free medium and incubated at either 4°C or 37°C for up to 20 min. Three aliquots of 106 cells were taken at each time point, and the efavirenz contained in each aliquot was extracted with 80% methanol and quantified by liquid chromatography-tandem mass spectrometry (LC-MS/MS) with a high-performance LC system (Agilent 1100 Series; Agilent, Palo Alto, CA) and a tandem mass spectrometer (API QStar Pulsar I; Applied BioSystems, Foster City, CA) using electrospray ionization in which an m/z transition of 333 to 272 atomic mass units for (M+NH4)+ precursor ions of efavirenz was used. As shown in Fig. 1, the intracellular efavirenz concentration declined within 5 min at either 37°C or 4°C to a level near the background level. This result poses another question about the previous isolation procedures used for PBMCs, because they were based on the assumption that drug efflux produced during washing procedure is suppressed by the use of ice-cold PBS. This result, taken together with those demonstrating the highly lipophilic property of efavirenz, suggests that intracellular efavirenz is eluted from the cells and adsorbed to the surface of plastic vessels during cell washing. To examine this hypothesis we compared quantifications of levels of efavirenz in PBMCs by two different isolation protocols: one used the same tube during washing, and the other used new tubes in each washing (Table 1). Transfer of cell suspension to a new tube each time reduced the efavirenz quantity remarkably compared with the use of the same tube throughout washing. These results suggest that the drug exudes from cells during cell washing and that the drug present in residual plasma was not washed away in studies employing the previously used procedures.
FIG. 1.
Efflux of efavirenz from preequilibrated PBMCs following incubation in drug-free medium at 37°C (closed circles) and 4°C (open circles).
TABLE 1.
Quantification of efavirenz in PBMCs isolated by the present method and a previously reported methoda
| Source | Intracellular efavirenz concnb (μM)
|
||
|---|---|---|---|
| Previous method with one tubec | Previous method with new tubesd | Present methode | |
| Spiked donor bloodf | 110 ± 19 | 4.6 ± 1.7 | 97 ± 17 |
| Patient 1 | Not assayed | 3.8 ± 1.3 | 63 ± 24 |
| Patient 2 | Not assayed | 1.1 ± 0.3 | 71 ± 11 |
The method reported by Almond et al. (1) was used for isolation of PBMCs for comparison with the present method.
Efavirenz was quantified by LC-MS/MS. Intracellular concentrations were calculated, taking 0.25 pl as the volume of a single cell (5). Data are expressed as means ± standard deviations (n = 3).
Washing of PBMCs in ice-cold PBS was carried out three times in the same microcentrifuge tube.
Suspension of PBMCs in ice-cold PBS was transferred into a new microcentrifuge tube for centrifugation before each of three washings.
Intracellular efavirenz concentrations were determined as described in the legend to Fig. 2.
HIV-uninfected donor blood was spiked with efavirenz at 10 μM.
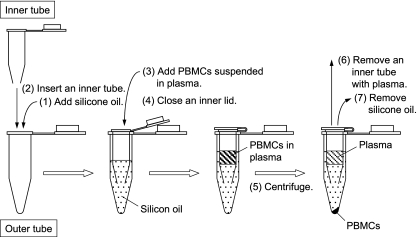
Thus, we decided to develop a new method for isolation of PBMCs (Fig. 2). The method consists of three steps: banding of PBMCs at the bottom of the plasma layer but not in the Ficoll-Paque solution by a relatively short centrifugation time; washing of PBMCs with concurrently prepared plasma of the same patient; and separation of PBMCs from the plasma by centrifugation through silicone oil (supplemented with 8% n-hexadecane) in a “double tube.” By this method, efavirenz in PBMCs are kept equilibrated with the efavirenz in plasma until PBMCs are separated from the plasma. The use of a “double tube” in centrifugation prevents plasma from contaminating the surface of an outer microcentrifuge tube and thus from getting into the extract of PBMCs.
FIG. 2.
Preparation of PBMCs for intracellular efavirenz quantification. Anticoagulated blood (1 ml) was layered on 800 μl of a Ficoll-Paque Plus solution (GE Healthcare, Piscataway, NJ) and centrifuged at 180 × g for 10 min. After centrifugation, PBMCs which formed a layer at the boundary between plasma and Ficoll-Paque Plus solution were collected and centrifuged at 320 × g for 2 min. Precipitated PBMCs were washed in 100 μl of plasma prepared from the same blood and centrifuged at 500 × g for 2 min. PBMCs were separated from plasma as follows: (i) a mixture of silicone oil (catalog no. SH-550; Nacalai, Kyoto, Japan) and n-hexadecane (Nakalai) (800 μl; 92:8 [vol/vol]) was added into an outer tube (1.5-ml microcentrifuge tube); (ii) an inner tube (made from a 0.5-ml microcentrifuge tube) with a hole at the bottom was sunk in silicone oil in the outer tube; (iii) PBMCs suspended in 100 μl of plasma were layered on silicone oil in the inner tube; (iv) the lid of the inner tube was pressed down; (v) an assembled “double tube” was centrifuged at 16,000 × g for 1 min, thereby precipitating PBMCs quickly to the bottom of the outer tube; (vi) the inner tube containing plasma and silicone oil was removed, with the lid kept closed to prevent plasma falling into the outer tube; and (vii) silicone oil was removed while leaving pelleted PBMCs in place and then the remaining silicone oil on the tube surface was removed after a brief centrifugation. Pelleted PBMCs were suspended in 30 μl of water, and immediately 10 μl of the suspension was used for determination of cell numbers with a cell counter (Celltac; Nihon Kohden, Tokyo, Japan); note that suspending cells in PBS is not recommended, because the presence of phosphate ions in samples affects ionization of molecules in mass spectrometry and sometimes causes severe troubles to the machine. To the remaining cell suspension, 80 μl of methanol was added, and efavirenz was quantified by LC-MS/MS.
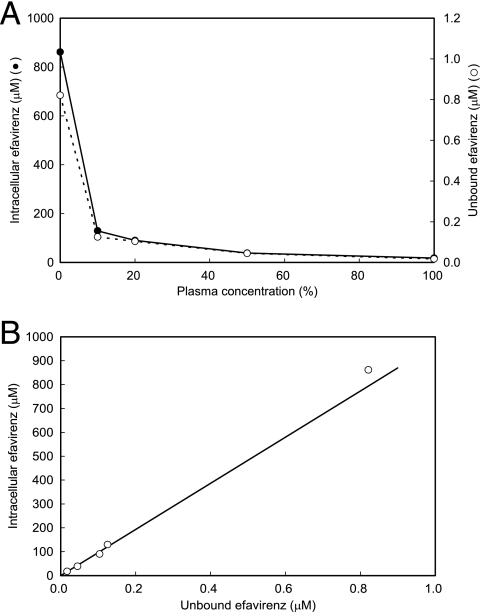
By using this method, we studied the dependence of intracellular efavirenz levels on the concentration of plasma in medium containing efavirenz at 10 μM. Efavirenz not bound by protein was obtained by use of a Centrifree micropartition device (Centrifree, Billerica, MA). The intracellular efavirenz concentration decreased with an increase in the plasma concentration (Fig. 3A) and was proportional to the unbound efavirenz concentration in medium, with a mean intracellular accumulation ratio of 970 (Fig. 3B). These results show that the major determinant of intercellular efavirenz levels is extracellular unbound levels but not total extracellular levels, which agrees with the pharmacological idea that only unbound drug is able to enter the cell.
FIG. 3.
(A) Dependence of unbound efavirenz and intracellular efavirenz levels on plasma content (expressed in percentages) in medium containing efavirenz at 10 μM. (B) Relationship between unbound and intracellular efavirenz concentrations as deduced from the data presented in panel A.
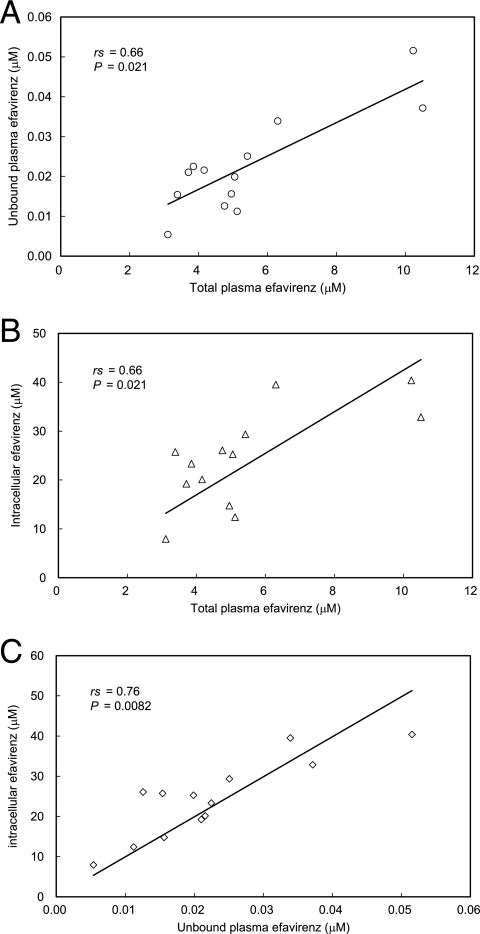
Next, the relationships between total plasma, unbound plasma, and intracellular efavirenz concentrations were studied using samples from 13 patients receiving antiretroviral agents containing efavirenz in Keio University Hospital (Tokyo, Japan). The patients provided written informed consent for the study, which was approved by the local ethics committee. The median duration of treatment was 15 months, with a range from 1 to 65 months. Concurrent drugs used for treatment were zidovudine and lamivudine (3TC) for four patients, stavudine and 3TC for five, tenofovir disoproxil fumarate and emtricitabine for three, and tenofovir disoproxil fumarate and 3TC for one. All patients were Japanese males and exhibited no biochemical evidence of impairment of the liver or kidney. Although there were significant associations between total and unbound plasma levels (Spearman's rank correlation coefficient [rs] = 0.66; P = 0.021) (Fig. 4A) and between total plasma and intracellular levels (rs = 0.66; P = 0.021) (Fig. 4B), a stronger correlation was observed between unbound plasma and intracellular levels (rs = 0.76; P = 0.0082) (Fig. 4C), with a mean accumulation ratio of 1,190.
FIG. 4.
Relationship between total plasma efavirenz and unbound plasma concentrations (A), total plasma and intracellular concentrations (B), and unbound plasma and intracellular concentrations (C) in samples from 13 patients receiving antiretroviral therapy that included efavirenz treatment. Data were analyzed by Spearman rank correlation.
The results presented above are contrasted with the results of previous studies (1, 10) and demonstrate that intracellular efavirenz levels are not correlated with unbound plasma levels but are significantly correlated with total plasma levels. They indicate that total plasma efavirenz concentrations may be good surrogate markers for intracellular concentrations and that binding of efavirenz to plasma protein may be linked to its binding to unknown materials in cells. It should be noted that these studies used similar methods for isolation of PBMCs in which PBMC extract is, as argued above, apt to be contaminated with plasma efavirenz. If such contamination occurred in their studies, it would be inevitable that a stronger correlation would be observed between total plasma and intracellular efavirenz levels.
Efavirenz was highly accumulated in resting PBMCs. This may have been due to the binding to cellular protein or membrane because of its high lipophilicity (logP = 5.4). Efavirenz bound to cellular components is unlikely to play a direct role in inhibition of reverse transcriptase activity. To study further the biological significance of intracellular drugs, new technologies for quantifying intracellular unbound drug and for identifying intracellular drug localization are required.
Most protease inhibitors also have the properties of rapid excretion from cells and high lipophilicity (4, 8). It may be necessary to examine whether the procedures for intracellular quantification of these agents (6, 7) suffer from the possible artifacts suggested for efavirenz in this study.
In conclusion, we have developed an intracellular efavirenz quantification method which overcomes spontaneous drug elution from cells and contamination with drug-containing plasma. The present method may be a useful tool for elucidating the therapeutic relevance of intracellular levels of efavirenz.
Acknowledgments
This study was supported by grants from the Ministry of Health, Labor and Welfare of Japan.
We thank Toshio Fukazawa for critical reading of the manuscript and gratefully acknowledge all the patients who participated in this trial.
Footnotes
Published ahead of print on 10 December 2007.
REFERENCES
- 1.Almond, L. M., P. G. Hoggard, D. Edirisinghe, S. H. Khoo, and D. J. Back. 2005. Intracellular and plasma pharmacokinetics of efavirenz in HIV-infected individuals. J. Antimicrob. Chemother. 56:738-744. [DOI] [PubMed] [Google Scholar]
- 2.Colombo, S., A. Beguin, A. Telenti, J. Biollaz, T. Buclin, B. Rochat, and L. A. Decosterd. 2005. Intracellular measurements of anti-HIV drugs indinavir, amprenavir, saquinavir, ritonavir, nelfinavir, lopinavir, atazanavir, efavirenz and nevirapine in peripheral blood mononuclear cells by liquid chromatography coupled to tandem mass spectrometry. J. Chromatogr. B Analyt. Technol. Biomed. Life Sci. 819:259-276. [DOI] [PubMed] [Google Scholar]
- 3.Csajka, C., C. Marzolini, K. Fattinger, L. A. Décosterd, J. Fellay, A. Telenti, J. Biollaz, and T. Buclin. 2003. Population pharmacokinetics and effects of efavirenz in patients with human immunodeficiency virus infection. Clin. Pharmacol. Ther. 73:20-30. [DOI] [PubMed] [Google Scholar]
- 4.Ford, J., S. H. Khoo, and D. J. Back. 2004. The intracellular pharmacology of antiretroviral protease inhibitors. J. Antimicrob. Chemother. 54:982-990. [DOI] [PubMed] [Google Scholar]
- 5.Gao, W.-Y., A. Cara, R. C. Gallo, and F. Lori. 1993. Low levels of deoxynucleotides in peripheral blood lymphocytes: a strategy to inhibit human immunodeficiency virus type 1 replication. Proc. Natl. Acad. Sci. USA 90:8925-8928. [DOI] [PMC free article] [PubMed] [Google Scholar]
- 6.Jones, K., P. G. Bray, S. H. Khoo, R. A. Davey, E. R. Meaden, S. A. Ward, and D. J. Back. 2001. P-glycoprotein and transporter MRP1 reduce HIV protease inhibitor uptake in CD4 cells: potential for accelerated viral drug resistance? AIDS 15:1353-1358. [DOI] [PubMed] [Google Scholar]
- 7.Jones, K., P. G. Hoggard, S. D. Sales, S. Khoo, R. Davey, and D. J. Back. 2001. Differences in the intracellular accumulation of HIV protease inhibitors in vitro and the effect of active transport. AIDS 15:675-681. [DOI] [PubMed] [Google Scholar]
- 8.Khoo, S. H., P. G. Hoggard, I. Williams, E. R. Meaden, P. Newton, E. G. Wilkins, A. Smith, J. F. Tjia, J. Lloyd, K. Jones, N. Beeching, P. Carey, B. Peters, and D. J. Back. 2002. Intracellular accumulation of human immunodeficiency virus protease inhibitors. Antimicrob. Agents Chemother. 46:3228-3235. [DOI] [PMC free article] [PubMed] [Google Scholar]
- 9.Marzolini, C., A. Telenti, L. A. Decosterd, G. Greub, J. Biollaz, and T. Buclin. 2001. Efavirenz plasma levels can predict treatment failure and central nervous system side effects in HIV-1-infected patients. AIDS 15: 71-75. [DOI] [PubMed] [Google Scholar]
- 10.Rotger, M., S. Colombo, H. Furrer, G. Bleiber, T. Buclin, B. L. Lee, O. Keiser, J. Biollaz, L. Décosterd, A. Telenti, and the Swiss HIV Cohort Study. 2005. Influence of CYP2B6 polymorphism on plasma and intracellular concentrations and toxicity of efavirenz and nevirapine in HIV-infected patients. Pharmacogenet. Genomics 15:1-5. [DOI] [PubMed] [Google Scholar]


