
Fig. 7. MCF inputs do not exhibit eCB-mediated LTD.
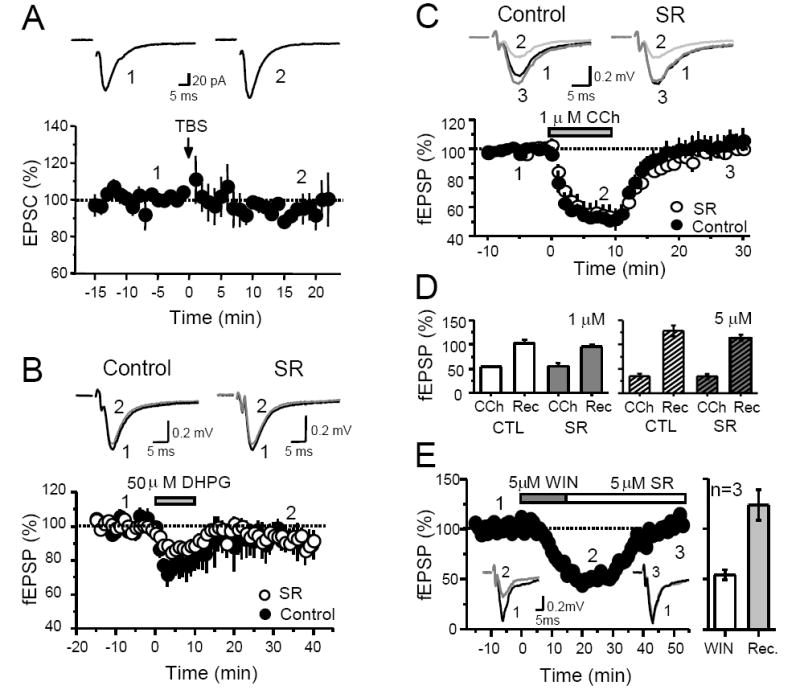
(A) Time course plot of average EPSC amplitudes before and after theta-burst stimulation (TBS) at the MCF-GC synapse. Top, Representative EPSC traces from a single experiment obtained at the time points indicated. Each trace was obtained by averaging 20 individual traces. (B) Time course plot of MCF fEPSP slope before and after DHPG application in control (filled circles) and in slices pre-incubated with SR (open circles). Top, Representative EPSC traces from single experiments obtained at the time points indicated. Each trace was obtained by averaging 30 individual traces. (C) Time course plot of the effect of CCh on MCF fEPSP slope in control slices (filled circles) and in slices pre-incubated with SR (open circles). Top, Representative EPSC traces from single experiments obtained at the time points indicated. Each trace was obtained by averaging 15 individual traces. (D) Summary plot of the effect of CCh on MCF-fEPSP slope at two different concentrations. 5 μM CCh depresses fEPSP to a greater extent than 1 μM CCh. However, this effect is CB1R-independent, and synaptic responses completely recover upon washout of CCh. (E) Time course plot of the effect of transient WIN application on fEPSP slope from one single experiment. WIN was bath applied for 15 minutes and washed out in the presence of SR. Activation of CB1Rs is not sufficient to trigger LTD of MCF inputs. Inset, fEPSP traces averaged from 30 individual traces at the time points indicated by numbers. Right, summary plot of WIN depression (WIN) and recovery of fEPSPs (Rec) from 3 experiments.