Abstract
This study presents a rapid, specific and sensitive liquid chromatography/tandem mass spectrometry (LC-MS/MS) assay for determination of risperidone (RIS) in human serum using paroxetine as an internal standard (IS). An Alltima-C18 column (2.1 mm×100 mm, 3 μm) and a mobile phase consisting of 0.1% formic acid-acetonitrile (40:60, v/v) were used for separation. The analysis was performed by selected reaction monitoring (SRM) method, and the peak area of the m/z 411.3→191.1 transition for RIS was measured versus that of the m/z 330.1→192.1 transition for IS to generate the standard curves. The assay linearity of RIS was confirmed over the range 0.25~50.00 ng/ml and the limit of quantitation was 0.05 ng/ml. The linear range corresponds well with the serum concentrations of the analytes obtained in clinical pharmacokinetic studies. Intraday and interday relative standard deviations were 1.85%~9.09% and 1.56%~4.38%, respectively. The recovery of RIS from serum was in the range of 70.20%~84.50%. The method was successfully applied to investigate the bioequivalence between two kinds of tablets (test versus reference products) in 18 healthy male Chinese volunteers. The result suggests that two formulations are bioequivalent.
Keywords: Risperidone, High performance liquid chromatography-mass spectrometry (HPLC-MS), Pharmacokinetics
INTRODUCTION
Risperidone (RIS) (3-[2-[4-(6-fluoro-1,2-benzisoxazol-3-yl)-1-piperidinyl] ethyl]-6,7,8,9-tetrahydro-2-methyl 4H-pyrido[1,2-a] pyrimidin-4-one) is a benzisoxazole antipsychotagent, used to treat schizophrenia and other psychoses. It exerts its effect by blocking serotonin (5-HT2) and dopamine (D2) receptors and causes a lower incidence of extrapyramidal side-effects than standard neuroleptic drugs (Huang et al., 1993; Mannens et al., 1994). It is effective in the treatment of schizophrenia and other psychiatric illnesses in adults and children including pervasive developmental disorders, autism and attention-deficit disorder (McCracken et al., 2002; McDougle et al., 2005). Usually, oral doses of RIS in the treatment of chronic schizophrenia are 2~6 mg/d. After oral administration, RIS is rapidly and completely absorbed from the gastro-intestinal tract and mainly metabolised via hydroxylation and N-dealkylation (Huang et al., 1993; Mannens et al., 1994). The hydroxylation of RIS is catalysed by the cytochrome P450 isoenzyme CYP2D6, which is subject to genetic polymorphism (Remmerie et al., 2003).
For adequate support of clinical studies with RIS, an analytical method is required for the determination of plasma levels of RIS. It is necessary to establish a simple, accurate and specific analytical technique, which permits measurements of RIS in biological specimens at different therapeutic levels. Early methods for the quantification of RIS have mostly used high performance liquid chromatography (HPLC) with ultraviolet (UV) or electrochemical detection (Aravagiri et al., 1998; Balant-Gorgia et al., 1999). Although these methods may be suitable for therapeutic drug monitoring of target concentrations in the range of 4~30 ng/ml for RIS, their narrow range is not particularly suitable for pharmacokinetic studies. The reported liquid chromatography-mass spectrometry (LC-MS) analytical method requires laborious extraction procedures like liquid-liquid extraction (Aravagiri and Marder, 2000) or solid-phase extraction (Remmerie et al., 2003), involving drying and reconstitution, long run time and high quantification limits (Flarakos et al., 2004; McClean et al., 2000; Zhou et al., 2004). In recent years, several mass spectrometric methods have been developed and all have much improved sensitivity and specificity (Bhatt et al., 2006; Cabovska et al., 2007; Kousoulos et al., 2007; Moody et al., 2004).
In this paper, we describe the simultaneous determination of RIS and paroxetine as an internal standard (IS) in human serum using modified LC–MS/MS method, and this method has been successfully applied to a bioequivalence study of test RIS tablet vs reference tablet (Risperdal®) in 18 healthy male Chinese volunteers.
MATERIALS AND METHODS
Chemicals and reagents
The RIS tablet (batch No. 040403, 1 mg/pill) is prepared for the test. The reference preparation (trade name Risperdal®, batch No. 040207366, 1 mg/pill) was produced by Xi’an Janssen Pharmaceutical (Xi’an, China). RIS pure drug (purity 99.9%) and paroxetine pure drug (IS, purity 99.8%) were kindly provided by Zhejiang Provincial Laboratory for the Control of Drugs (Hangzhou, China). Formic acid and acetonitrile were purchased from Merck (Darmstadt, Germany). Water was purified by a Milli-Q system from Millipore Corp. (Milford, MA, USA). Other chemicals were of analytical grade.
Instrumentation
Chromatographic separations were carried out on a Surveyor HPLC with an Alltima-C18 column (2.1 mm×100 mm, 3.0 μm). A mobile phase consisting of 0.1% formic acid-acetonitrile (40:60, v/v) was used with a flow rate of 0.2 ml/min. The mobile phase was filtered by passing through a 0.22 μm membrane filter. Measurements were made at 30 °C, and sample volume was 2 μl.
Mass spectra were obtained using a Finnigan TSQ Quantum discovery mass spectrometer (USA) and operated using electrospray ionization (ESI) condition. The positive-ion selected reaction monitoring (SRM) mode was chosen for quantification. The electrospray voltage: 3500 eV, nebulizer N2 gas temperature: 350 °C, drying N2 gas flow: 200 ml/min, sheath gas pressure: 30 Arb, and auxiliary gas pressure: 5 Arb. The peak area of transition from m/z 411.3, [M+H]+ ion, to m/z 191.1, a product ion, with collision energy of 30 eV was measured for RIS. Paroxetine was monitored using the transitions from m/z 330.1 to m/z 192.1 with collision energy of 27 eV. The data acquisition was ascertained by Xcalibur software.
Standard solutions
RIS stock solutions were prepared in acetonitrile (1.0 μg/ml) and stored at 4 °C. Working standards from the concentrated stock solution were prepared with acetonitrile to yield the final concentrations of 2.5, 5.0, 10.0, 25.0, 50.0, 100.0, 200.0 and 500.0 ng/ml. The stock solution of IS (paroxetine, 12 µg/ml) was stored at 4 °C. It was diluted with acetonitrile to give a final concentration of 60 ng/ml before added to the samples.
The working standards, 30 μl, were dried under nitrogen at 40 °C. The dry residues were vortex-mixed with 300 μl blank serum to make a series of serum samples, which were added with 0.9 ml 60 ng/ml of IS. Then the samples were vortex-mixed up vigorously for 5 min and centrifuged at 15000×g (2 °C) for 15 min. Its supernatants (2 μl) were injected into the LC-MS/MS system.
Sample preparation
Blood samples drawn from 18 healthy volunteers after a single oral administration of 2 mg RIS were centrifuged at 15000×g for 15 min. Serum samples were then stored in polypropylene tubes at −20 °C until analyzed. The preparation of serum samples was treated as described in subsection “standard solutions”.
Validation
1. Selectivity
The selectivity study was performed on the human serum from individual healthy donors receiving no medication for assessment of potential interferences with endogenous substances at the retention time of RIS and IS.
2. Linearity
Serum samples spiked with RIS and IS working solutions were processed according to the procedure described above for the construction of calibration curves. The eight-point (0.25, 0.50, 1.00, 2.50, 5.00, 10.00, 20.00, 50.00 ng/ml) calibration curves were obtained by plotting the peak area ratio (y) of RIS to IS against the concentration (x) of RIS. The concentrations of calibration standards were analyzed for five replicates and the goodness-of-fit was determined by linear regression.
3. Precision and accuracy
The intraday precision and accuracy for the analytical method were evaluated by analysis of five replicates of serum samples containing RIS at three different concentrations of 0.25, 5.00 and 50.00 ng/ml on the same day. The interday precision and accuracy were evaluated at the above concentration levels on five separate days. The precision was estimated by calculating the relative standard deviation [RSD (%)] which is expressed as: RSD (%)=(standard derivation)/(mean observed concentration)×100%, and the RSD value must be within 15%. The accuracy was calculated for each batch as the mean concentration found for that batch relative to the actual concentration. The accuracy must be between 85% and 115%, and the range nearly LLOQ (the lowest limit of quantification) was 80%~120%.
4. Recovery
The recovery of RIS was evaluated in quintuplicate at three concentration levels of 0.25, 5.00 and 50.00 ng/ml from peak area ratios (R) of assayed samples compared to the reference standard prepared in acetonitrile. Each of the samples was also spiked with IS at working concentration of 60 ng/ml. The recovery was calculated using the formula:
| Recovery (%)=(Rserum)/(Racetonitril)×100%, |
where R serum was peak area ratios of serum samples, and R acetonitril was peak area ratios of standard solutions.
5. Stability
The processed serum samples (0.25, 5.00 and 50.00 ng/ml) were kept at room temperature for 24 h and then the stability was determined. The freeze-thaw stability was determined after three repeated freezing and thawing cycles on Days 0, 10 and 15.
Pharmacokinetic studies
Eighteen healthy male Chinese volunteers [median age: 20.5 years (18~22 years), median weight: 58.5 kg (54.5~75 kg), median height: 170.5 cm (166~185 cm)] were selected as subjects. All subjects gave written consent to their participation after informed by the medical supervisor about the aim, course and possible risks of the study. The study protocols were approved by the relevant Ethical Review Committee in accordance with the principles of the Declaration of Helsinki, and the recommendations of the State Food and Drug Administration of China.
The volunteers participated in a single dose fasting crossover bioequivalence study with a one-week interval between each administration. Subjects were admitted to the study clinical unit at evening before the day of each administration and remained under close medical supervision during the study. Each subject received two RIS test or reference tablets in a randomized order. Subjects were fasted for 12 h before drug administration. About 3 ml of venous blood samples were collected at 0.0, 0.33, 0.67, 1.0, 1.5, 2.0, 3.0, 4.0, 6.0, 8.0, 10.0, 12.0 and 16.0 h postdose administration.
Serum samples were prepared for analysis. Pharmaceutical Kinetics Software (PKS) 1.0.2 software package (Shanghai Hongneng Software Co., Ltd., China) was used for calculation of pharmacokinetic parameters. The peak concentration (C max) and peak time (t max) were observed values. The elimination rate constant (K e) was estimated from the terminal linear segment of the log serum concentration/time data. The elimination half-life (t 1/2(k e)) was calculated from ln2/K e. The area under the curve (AUC 0→t) was estimated by trapezoidal rule with extrapolation.
RESULTS AND DISCUSSION
Validation of LC-MS/MS method
1. Selectivity
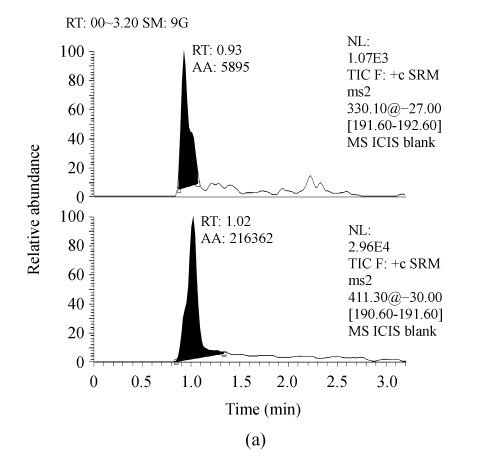
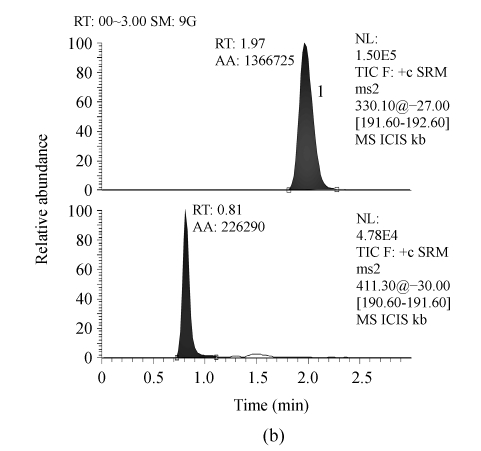
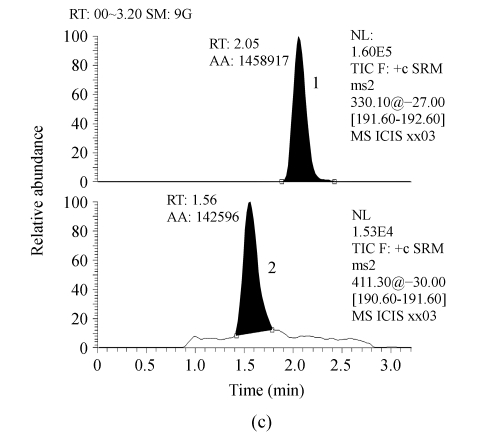
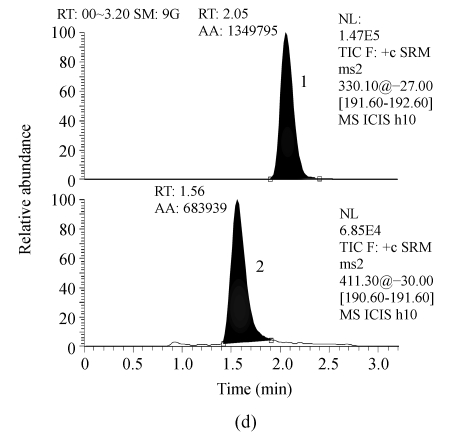
Serum samples from different sources were found to be free from interfering molecular ions at the retention time of RIS and IS. Observed retention time was about 1.56 and 1.97 min for RIS and IS, respectively (Fig.1).
Fig. 1.
Representative LC-MS/MS chromatograms from human serum. (a) Blank serum; (b) Blank serum spiked with 60 ng/ml of IS; (c) Blank serum added with 1.0 ng/ml of RIS and 60 ng/ml of IS; (d) Serum sample from a subject 8 h after receiving 2 mg RIS tablets, and added with 60 ng/ml of IS (the assayed concentration of RIS was 4.97 ng/ml)
1: 60 ng/ml of IS; 2: RIS. RT: Retention time; AA: Area of peak
2. Linearity
The calibration curve of RIS in serum was linear in the range of 0.25~50.00 ng/ml. The average regression equation of calibration curve was:
| y=(0.101±0.0039)x+(0.005±0.0007) (n=5, r=0.9999) |
. Its correlation coefficient showed good linearity. The accuracy of each point on the standard curve was greater than 96.45%. This result shows the usefulness of the present LC-MS/MS method in the assay of RIS from low to high serum levels. The limit of quantification (LOQ) of RIS (signal-to-noise ratio of 3) in serum was determined to be approximately 0.25 ng/ml.
3. Precision and accuracy
The intraday precision showed a RSD (%) of 1.85%~9.09% for RIS. The interday RSD (%) was 1.56%~4.34%. The intraday and interday accuracies for RIS were 88.80%~106.84% and 91.20%~103.76%, respectively. The data proved good precision of the developed LC-MS/MS method (Tables 1 and 2).
Table 1.
Intraday and interday precision of LC-MS/MS for determination of risperidone in serum
| Nominal concentration (ng/ml) | Calculated concentration (ng/ml) |
Mean±SD (ng/ml) | RSD (%) | |||||
| 1 | 2 | 3 | 4 | 5 | ||||
| Intraday | 0.25 | 0.25 | 0.22 | 0.22 | 0.20 | 0.22 | 0.22±0.02 | 9.09 |
| 5.00 | 5.31 | 5.29 | 5.43 | 5.22 | 5.46 | 5.34±0.10 | 1.88 | |
| 50.00 | 50.89 | 53.37 | 52.48 | 52.82 | 53.07 | 52.53±0.97 | 1.85 | |
| Interday | 0.25 | 0.22 | 0.22 | 0.22 | 0.24 | 0.24 | 0.23±0.01 | 4.34 |
| 5.00 | 5.34 | 5.43 | 4.97 | 5.18 | 5.11 | 5.21±0.18 | 3.45 | |
| 50.00 | 52.53 | 51.22 | 50.32 | 51.02 | 51.34 | 51.28±0.80 | 1.56 | |
Table 2.
Intraday and interday accuracies of LC-MS/MS for determination of risperidone in serum
| Nominal concentration (ng/ml) | Relative recovery (%) |
Mean±SD (%) | RSD (%) | |||||
| 1 | 2 | 3 | 4 | 5 | ||||
| Intraday | 0.25 | 100.00 | 88.00 | 88.00 | 80.00 | 88.00 | 88.80±7.16 | 8.06 |
| 5.00 | 106.20 | 105.80 | 108.60 | 104.40 | 109.20 | 106.84±2.01 | 1.88 | |
| 50.00 | 101.78 | 106.74 | 104.96 | 105.96 | 106.14 | 105.12±1.97 | 1.87 | |
| Interday | 0.25 | 88.00 | 88.00 | 88.00 | 96.00 | 96.00 | 91.20±4.38 | 4.80 |
| 5.00 | 106.80 | 106.80 | 99.40 | 103.60 | 102.20 | 103.76±3.16 | 3.04 | |
| 50.00 | 105.06 | 102.44 | 100.64 | 102.04 | 102.68 | 102.57±1.60 | 1.56 | |
4. Recovery
The mean recovery of serum samples from low to high concentrations after treatment was (70.20±3.21)% (0.25 ng/ml), (84.50±2.90)% (5.00 ng/ml), and (82.60±2.74)% (50.00 ng/ml) for RIS. These results suggest that there were no relevant differences in serum treatment recoveries at different concentration levels of RIS.
5. Stability
No significant loss of RIS (RSD≤7.50%) was observed after storage of the processed serum samples at room temperature for at least 24 h (Table 3). Serum samples were stable over at least three freeze-thaw cycles (Table 4), indicating that the serum samples can be frozen and thawed at least three times prior to analysis.
Table 3.
The stability of risperidone in processed serum (n=5)
| Nominal concentration (ng/ml) | Found concentration (ng/ml)* |
RSD (%) | ||
| 0 h | 10 h | 24 h | ||
| 0.25 | 0.22±0.018 | 0.25±0.009 | 0.22±0.012 | 7.20 |
| 5.00 | 5.34±0.096 | 5.18±0.075 | 5.01±0.095 | 3.10 |
| 50.00 | 52.53±0.971 | 52.51±1.361 | 50.82±2.517 | 1.90 |
Mean±SD
Table 4.
Freeze-thaw stability of risperidone in human serum (n=5)
| Nominal concentration (ng/ml) | Found concentration (ng/ml)* |
RSD (%) | ||
| Day 0 | Day 10 | Day 15 | ||
| 0.25 | 0.22±0.017 | 0.24±0.009 | 0.26±0.012 | 7.50 |
| 5.00 | 5.34±0.096 | 4.97±0.064 | 5.19±0.087 | 3.60 |
| 50.00 | 52.53±0.971 | 48.65±0.487 | 51.15±0.822 | 3.90 |
Mean±SD
Clinical application
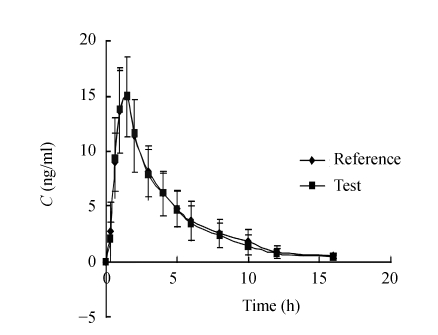
The developed method was applied to a bioequivalence study of two RIS formulations. Fig.2 shows mean serum concentration-time profiles of RIS after a single administration of 2 mg of either formulation to 18 healthy male Chinese volunteers. Pharmacokinetic analysis of the serum concentration data using PKS gave comparable results for all volunteers. The mean values of the major pharmacokinetic parameters of C max, AUC 0→16, AUC 0→∞, t max and t 1/2(k e) of the two RIS formulations in healthy male Chinese volunteers were shown in Table 5. There was no significant difference between the two formulations on the basis of assessment by a two one-sided t-test of the data obtained with logarithmically transformed C max and AUC. The 95% confidence intervals of test to reference ratio of the AUC 0→16, were within the bioequivalence criteria range of 80%~125%, and that of C max was within 70%~143%. Therefore, two products were concluded to be bioequivalent.
Fig. 2.
Mean serum risperidone concentration-time profiles following administration of test or reference containing 2 mg of risperidone to 18 healthy subjects
Error bars represent SD
Table 5.
Pharmacokinetic parameters of risperidone after oral administration (2 mg) of two formulations to 18 subjects*
| tmax (h) | Cmax (ng/ml) | AUC0→16 ((ng·h)/ml) | AUC0→∞ ((ng·h)/ml) | t1/2(ke) (h) | Ke (h−1) | Ka (h−1) | F (%) | |
| Reference | 1.28±0.26 | 16.94±2.31 | 62.43±16.23 | 64.65±16.85 | 3.23±1.05 | 0.2294±0.0522 | 4.4992±3.7885 | 100 |
| Test | 1.31±0.30 | 17.24±2.40 | 60.37±15.54 | 62.03±16.16 | 3.11±0.65 | 0.2320±0.0496 | 3.9294±3.4050 | 96.93±9.27 |
Mean±SD;
K a: Absorption rate constant; F: Relative bioavailability
CONCLUSION
The LC-MS/MS method for quantifying RIS in human serum has been developed in the present study. Method validation has been demonstrated for selectivity, linearity, sensitivity, precision, recovery and stability. The developed LC-MS/MS method has several advantages compared to the previously reported methods, as it provides simpler sample pretreatment and requires small mobile phase and sample volume and short chromatographic run. The LC-MS/MS method was successfully applied to a pharmacokinetic analysis of RIS in Chinese volunteers.
The results of statistical analysis show that the two formulations of RIS were bioequivalent in 95% confidential limit, and that the relative bioavailability of the test tablets was (96.93±9.27)%. The major pharmacokinetic parameters of RIS obtained in Chinese volunteers are very important for its optimal clinical usage.
References
- 1.Aravagiri M, Marder SR. Simultaneous determination of risperidone and 9-hydroxyrisperidone in plasma by liquid chromatography/electrospray tandem mass spectrometry. J Mass Spectrom. 2000;35(6):718–724. doi: 10.1002/1096-9888(200006)35:6<718::AID-JMS999>3.0.CO;2-O. [DOI] [PubMed] [Google Scholar]
- 2.Aravagiri M, Marder SR, Wirshing D, Wirshing WC. Plasma concentrations of risperidone and its 9-hydroxy metabolite and their relationship to dose in schizophrenic patients: Simultaneous determination by a high performance liquid chromatography with electrochemical detection. Pharmacopsychiatry. 1998;31(38):102–109. doi: 10.1055/s-2007-979308. [DOI] [PubMed] [Google Scholar]
- 3.Balant-Gorgia AE, Gex-Fabry M, Genet C, Balant LP. Therapeutic drug monitoring of risperidone using a new, rapid HPLC method: Reappraisal of interindividual variability factors. Ther Drug Monit. 1999;21(1):105–115. doi: 10.1097/00007691-199902000-00017. [DOI] [PubMed] [Google Scholar]
- 4.Bhatt J, Subbaiah G, Singh S. Liquid chromatography/tandem mass spectrometry method for simultaneous determination of risperidone and its active metabolite 9-hydroxyrisperidone in human plasma. Rapid Commun Mass Spectrom. 2006;20(14):2109–2114. doi: 10.1002/rcm.2537. [DOI] [PubMed] [Google Scholar]
- 5.Cabovska B, Cox SL, Vinks AA. Determination of risperidone and nantiomers of 9-hydroxyrisperidone in plasma by LC-MS/MS. J Chromatogr B. 2007;852(1-2):497–504. doi: 10.1016/j.jchromb.2007.02.007. [DOI] [PMC free article] [PubMed] [Google Scholar]
- 6.Flarakos J, Luo W, Aman M, Svinarov D, Gerber N, Vouros P. Quantification of risperidone and 9-hydroxyrisperidone in plasma and saliva from adult and pediatric patients by liquid chromatography-mass spectrometry. J Chromatogr A. 2004;1026(1-2):175–183. doi: 10.1016/j.chroma.2003.10.138. [DOI] [PubMed] [Google Scholar]
- 7.Huang ML, van Peer R, Woestenborghs R, de Coster R, Heykants J, Jansen AA. Pharmacokinetics of the novel antipsychotic agent risperidone and the prolactin response in healthy subjects. Clin Pharmacol Ther. 1993;54(3):257–268. doi: 10.1038/clpt.1993.146. [DOI] [PubMed] [Google Scholar]
- 8.Kousoulos C, Dotsikas Y, Yannis L, Loukas YL. Turbulent flow and ternary column-switching on-line clean-up system for high-throughput quantification of risperidone and its main metabolite in plasma by LC-MS/MS application to a bioequivalence study. Talanta. 2007;72(2):360–367. doi: 10.1016/j.talanta.2006.10.049. [DOI] [PubMed] [Google Scholar]
- 9.Mannens G, Huang ML, Meuldermans W, Hendrickx J, Woestenborghs R, Heykants J. Absorption, metabolism, and excretion of risperidone in humans. Drug Metab Dispos. 1994;21(6):1134–1141. [PubMed] [Google Scholar]
- 10.McClean S, O′Kane EJ, Smyth WF. Electrospray ionisation-mass spectrometric characterisation of selected anti-psychotic drugs and their detection and determination in human hair samples by liquid chromatography-tandem mass spectrometry. J Chromatogr B. 2000;740(2):141–157. doi: 10.1016/S0378-4347(00)00038-4. [DOI] [PubMed] [Google Scholar]
- 11.McCracken JT, McGough J, Shah B, Cronin P, Hong D, Aman MG, Davies M, Arnold LM, Posey DJ, Martin A, et al. Risperidone in children with autism and serious behavioral problems. N Engl J Med. 2002;347(5):314–321. doi: 10.1056/NEJMoa013171. [DOI] [PubMed] [Google Scholar]
- 12.McDougle CJ, Scahill L, Aman MG, McCracken JT, Tierney E, Arnold LM, Lindsay R. Risperidone for the core symptom domains of autism: Results from the study by the autism network of the research units on pediatric psychopharmacology. Am J Psychiatry. 2005;162(6):1142–1148. doi: 10.1176/appi.ajp.162.6.1142. [DOI] [PubMed] [Google Scholar]
- 13.Moody DE, Laycock JD, Huang W, Foltz RL. A high-performance liquid chromatographic-atmospheric pressure chemical ionization-tandem mass spectrometric method for determination of risperidone and 9-hydroxyrisperidone in human plasma. J Anal Toxicol. 2004;28(6):494–497. doi: 10.1093/jat/28.6.494. [DOI] [PubMed] [Google Scholar]
- 14.Remmerie BM, Sips LL, de Vries R, de Jong J, Schothuis AM, Hooijschuur EW. Validated method for the determination of risperidone and 9-hydroxyrisperidone in human plasma by liquid chromatography-tandem mass spectrometry. J Chromatogr B. 2003;783(2):461–472. doi: 10.1016/S1570-0232(02)00715-8. [DOI] [PubMed] [Google Scholar]
- 15.Zhou Z, Li X, Li K, Xie Z, Cheng Z, Peng W, Wang F, Zhu R, Li H, Flarakos J, et al. Simultaneous determination of clozapine, olanzapine, risperidone and quetiapine in plasma by high-performance liquid chromatography-electrospray ionization mass spectrometry. J Chromatogr B. 2004;802(2):257–262. doi: 10.1016/j.jchromb.2003.11.037. [DOI] [PubMed] [Google Scholar]


