Abstract
We have developed temperature-pulse microscopy in which the temperature of a microscopic sample is raised reversibly in a square-wave fashion with rise and fall times of several ms, and locally in a region of approximately 10 μm in diameter with a temperature gradient up to 2°C/μm. Temperature distribution was imaged pixel by pixel by image processing of the fluorescence intensity of rhodamine phalloidin attached to (single) actin filaments. With short pulses, actomyosin motors could be activated above physiological temperatures (higher than 60°C at the peak) before thermally induced protein damage began to occur. When a sliding actin filament was heated to 40–45°C, the sliding velocity reached 30 μm/s at 25 mM KCl and 50 μm/s at 50 mM KCl, the highest velocities reported for skeletal myosin in usual in vitro assay systems. Both the sliding velocity and force increased by an order of magnitude when heated from 18°C to 40–45°C. Temperature-pulse microscopy is expected to be useful for studies of biomolecules and cells requiring temporal and/or spatial thermal modulation.
Recent advances in optical microscopic techniques have made it possible to image single protein molecules in solution (1, 2) and investigate the dynamic nature of molecular motors (3–8). To introduce an additional dimension to this technology, we have developed temperature-pulse microscopy (TPM), in which a microscopic sample(s) in aqueous solution is heated reversibly.
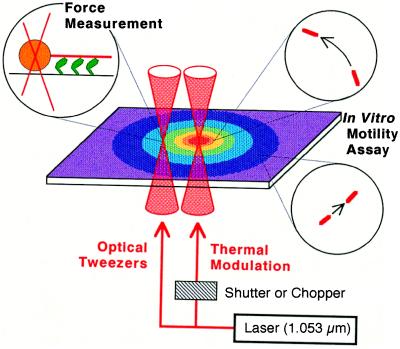
There have been several reports on the effects of temperature jumps under an optical microscope: for example, on physiological functions of muscle fibers (9–12) and on phase transition phenomena in membranes of phospholipid vesicles and cells (13). To prevent thermal deterioration of biological samples, and to confirm the absence of the deterioration, it is highly desirable to restore the starting temperature as soon as the measurement is finished. In our TPM, temperature is elevated spatially and temporally by illuminating a lump of metal particles by IR laser; a concentric temperature gradient is created around the lump of metal particles. When the laser beam is shut off, the heat is rapidly dissipated into the surrounding medium. Thus, a square-wave temperature pulse with rise and fall times of less than 10 ms is generated. Exposure to high temperature is minimized, and repetitive thermal cycling is easily programmed. The local heating also permits simultaneous observation of the sample behaviors at various temperatures.
In the microscopic temperature-imaging techniques reported so far, the temperature was estimated either from the thermal quenching of fluorescence (14–16) or from the thermal shift of the fluorescence spectrum (13). Here, we applied the former technique. In our TPM, a concentric temperature gradient is formed around the metal aggregate, as assessed from thermal quenching of a fluorescent dye bound to actin filaments with a slope of 1–2°C/μm and extension out to 10–20 μm. The temperature distribution on single actin filaments also could be imaged.
We have applied this TPM technique to the thermal activation of sliding movement and tension development of actomyosin motors in an in vitro motility assay. We demonstrate that the motor functions can be thermally activated even at temperatures that are high enough to normally damage the proteins, if the duration of the temperature pulse is short enough.
MATERIALS AND METHODS
TPM.
As schematically illustrated in Fig. 1, local heating was achieved by illuminating an aggregate of metal particles in the sample with an IR laser beam (1 W Nd:YLF laser, 1,053–1,000 p: λ = 1.053 μm; Amoco Laser, Naperville, IL; 50–100 mW on the sample plane). In most experiments we used aluminum (0.1 μmφ; AL-014050, Nilaco, Tokyo), but gold (0.5 μmφ; AU-174020, Nilaco), silver (0.07 μmφ; AG-404050, Nilaco), and platinum (1.0 μmφ; PT-354012, Nilaco) powders served equally well. The metal particles spontaneously formed aggregates in the sample and had irregular shapes. [Heat production by laser irradiation also can be achieved in other ways. For example, we have deposited, by vacuum evaporation, a thin layer of metal on a glass surface in the form of a regular array of μm-sized circles (not shown). This method allowed well-controlled and reproducible heating, whereas the use of amorphous metal aggregates described here is very simple. A magnetic bead also can be used (17).]
Figure 1.
Schematic illustration of TPM system. Metal aggregates of irregular shape and several to 10 μm in size, lumps of metal particles of 0.1–1.0 μm in diameter, are scattered on a glass coverslip in an in vitro motility assay system under an optical microscope. A peripheral, not the central, portion of one of the aggregates is illuminated by focusing an IR laser beam. If the central portion is illuminated, the aggregate is frequently blown off or the surrounding medium gets boiled. The metal aggregate that absorbs the laser light functions as a local heat source, around which a concentric temperature gradient is formed. Sliding movement of actin filaments occurs at temperature-dependent velocities, as illustrated by movement in circles. When tension is measured, the incident laser beam is split into two; one constitutes optical tweezers that hold a polystyrene bead attached at the rear end of an actin filament, and the other illuminates a metal aggregate. For repetitive temperature modulation, a chopper or shutter is used.
The presence of Al aggregates did not affect the in vitro motility for at least 2 h. The actin filament temperature was estimated from thermal quenching of the fluorescence of rhodamine phalloidin bound to the filament. The fluorescence images were taken with an image intensifier (KS1381; Video Scope International, Washington, DC) connected to a charge-coupled device camera (CCD-72; Dage MTI, Michigan City, IN) at the video rate of 30 frames/s. The decay lag in this camera system was well within one frame (33 ms). For the measurement of the rise and fall times of the temperature pulse, an image intensifier (ILS-3a; nac, Tokyo) connected to a high-speed camera (HSV-500DM; nac) was used at a rate of 500 frames/s.
The fluorescence image of labeled filaments at T°C was divided by that at 18°C (reference temperature) to yield the intensity ratio (r) in every pixel (18). r was related with T in a control experiment in which the temperature of the microscope stage was held at precise temperatures with the use of a thermal insulation chamber, which took about 45 min for stabilization (Nikon). Room temperature was maintained at 18°C ± 1°C. We obtained the empirical equation r = 1 − α(T − T0), where α and T0 are, respectively, 0.018°C−1 and 18°C, in agreement with a spectroscopic measurement in a cuvette (fluorescence spectrophotometer F-4500, Hitachi, Tokyo). The temperature estimated from the fluorescence intensity averaged over a short (< a few μm) filament fluctuated from frame to frame, with a SD of ± 5°C over the duration of 0.5 s (15 frames). Spectroscopic studies in a cuvette (19) indicated that rhodamine phalloidin tended to detach from actin at high temperatures. We confirmed that the half-time for detachment under the solvent condition examined here was approximately 12 min at 35°C and 3 min at 45°C, which was much longer than the duration of the temperature pulse (<10 s). Photobleaching of rhodamine fluorescence was negligible within the period of time we examined. Thus, the linear relationship between relative fluorescence intensity and temperature, r(T), is attributed solely to reversible thermal quenching of rhodamine.
Proteins.
Actin and heavy meromyosin (a fragment of myosin prepared by chymotryptic digestion) were prepared from rabbit white skeletal muscle as described (20). Actin filaments were labeled with rhodamine phalloidin (Molecular Probes) according to Yanagida et al. (21).
In Vitro Motility Assay.
Details of the in vitro motility assay and tension measurement performed under an inverted microscope (TMD300; an oil-immersion objective lens with a phase ring, ×100 numerical aperture = 1.3 or ×60 numerical aperture = 1.4; Nikon) equipped with optical tweezers have been described (7, 8). The assay buffer used was 25 mM KCl/2.0 mM ATP/4.0 mM MgCl2/25 mM imidazole-HCl, pH 7.4/1.0 mM EGTA/10 mM DTT with an oxygen-scavenger enzyme system (22); in one experiment where the highest sliding velocity was recorded, 50 mM KCl was used instead of 25 mM KCl, in which 1% (wt/vol) of methylcellulose was included to suppress the dissociation of actin filaments from the glass surface at high ionic strength. An in vitro motility cell was prepared by infusing 30 μg/ml heavy meromyosin in the assay buffer containing 0.5 mg/ml BSA. To measure the tension, a polystyrene bead of 1.0 μm in diameter was attached at the rear end of an actin filament through a barbed end capping protein, gelsolin, covalently attached to the bead (23), and the bead was trapped with optical tweezers (trap stiffness, 0.14 pN/nm). In this case, the laser beam was split into two by a polarizing beam splitter (Sigma Koki, Hidaka, Japan); one beam was used for optical tweezers and the other for heating. Movement of the bead in the trap was detected in a phase-contrast image under a dual-view microscope (18) and analyzed with sub-nm precision.
RESULTS AND DISCUSSION
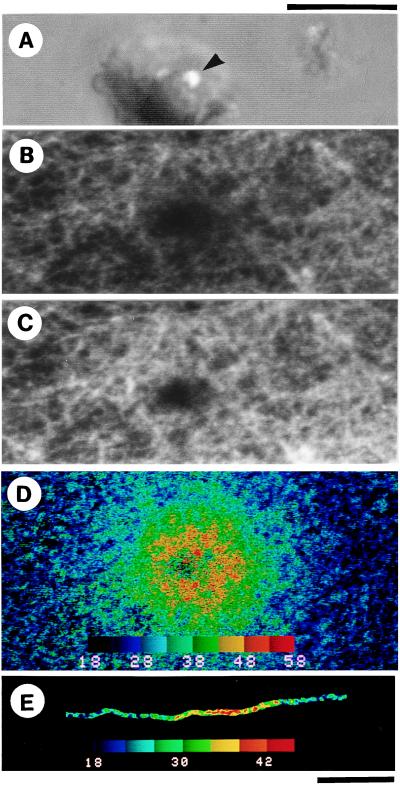
A steady, concentric temperature gradient was produced within 10 ms around the metal after laser illumination was started, as monitored by the fluorescence intensity of the temperature-sensitive rhodamine phalloidin attached to actin filaments in the sample chamber (Fig. 2 A–D). Temperatures on a single actin filament could be imaged (Fig. 2E), even during sliding as shown below. A temperature difference as large as 40°C could be created across a high-magnification image, allowing simultaneous evaluation of sample behaviors over a wide range of temperatures. When the laser illumination was terminated, the sample cooled down to the original temperature within 10 ms, presumably because of the presence of a substance of large heat conductivity (glass and water) in contact with the small heat source. For a long actin filament, a temperature gradient around 2°C/μm was demonstrated (Fig. 2E).
Figure 2.
Imaging of temperature distribution on actin filaments around the metal aggregate. (A) Phase-contrast image corresponding to the central part of fluorescence images (B–D). A laser beam was focused at a periphery (shown by an arrowhead) of a lump of Al particles of irregular shape. (B–D) Fluorescence images of a two-dimensional network of rhodamine phalloidin-labeled actin filaments (12 μg/ml) attached to heavy meromyosin molecules that adhered to the glass surface coated with nitrocellulose (24). Excess actin filaments were washed away, so that filaments were mostly in focus and thus within 1 μm of the glass surface. (B) Fluorescence image of the actin network taken in a single video frame coincident with laser illumination for 1/30 s under shutter control. A periphery of a ≈10-μm lump of Al particles observed in A was illuminated. Fluorescence under and close to the metal aggregate disappeared because of excessively high temperature. (C) A single-frame fluorescence image obtained two video frames after B; the image was indistinguishable from that obtained before laser illumination at 18°C ± 1°C, i.e., temperature of the coverslip. (D) Two-dimensional temperature distribution constructed from the ratio of the fluorescence intensities of the images B and C. (E) Temperature distribution on a single actin filament; only in this micrograph, the background fluorescence intensity was subtracted. In D and E, the temperature is scaled in pseudocolor as shown in color bars in °C unit. (Scale bars: upper one for A–D, lower one for E, 10 μm.)
First, we examined the effects of the temperature gradient on the sliding movement of a long actin filament. When the temperature of the front portion of a sliding filament was higher, the filament was straightened and sliding was smooth. However, when the temperature of the rear portion was higher, buckling occurred at the middle of the filament, the buckled portion being on the glass surface without looping out into the medium. In all likelihood, front motors can pull the whole filament, whereas rear motors cannot efficiently push the front portion because of the flexibility of the filament (20, 25, 26). When the rear part is faster, formation of a superhelix may be expected at the slow/fast junction, because a sliding actin filament has been shown to rotate as a right-handed screw (3, 20, 26). Indeed we observed a superhelix when the front part of an actin filament was completely fixed on a glass surface (20). In the present experiment, the temperature gradient in the running filament could not be maintained for a sufficiently long period to allow the buckled portion to loop out.
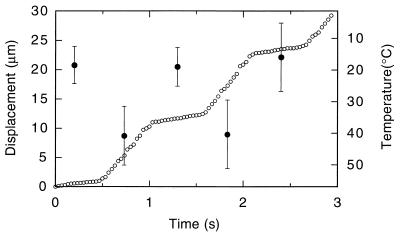
Then, we observed reversible acceleration of sliding movement by repetitive application of relatively long temperature pulses (0.5 to several seconds) by using a chopper. As shown in Fig. 3, sliding velocities reversibly reached two steady-state values within 1/30 s: the average velocities were 1.9, 19.3, 2.5, 20.7, and 2.2 μm/s, respectively, at 18°C, 41°C, 19°C, 40°C, and 15°C, which were estimated from the average fluorescence intensity of the sliding filament according to the relation, r(T), described above. (Note that the coverslip temperature was maintained at 18°C ± 1°C.) On average, the sliding velocities at 25 mM KCl, the ionic strength usually used for in vitro motility assays (24), were 2.0 ± 0.1 (n = 6), 10 ± 1.5 (n = 6), and 20 ± 1.8 (n = 6) μm/s at 18°C, 30°C, and 40°C, respectively. For comparison, thermostatic regulation of the whole stage resulted in the average sliding velocities, respectively, of 2.0 ± 0.1 (n = 6), 8.0 ± 0.5 (n = 6), 13 ± 0.7 (n = 6), and 22 ± 2.1 (n = 6) μm/s at 18°C, 30°C, 40°C, and 50°C, consistent with previous reports (27–29). In this case, the sliding filaments tended to detach from the glass surface at higher temperatures, e.g., within 1 min at 50°C, suggesting gradual deterioration of motor functions. The higher velocities obtained with our TPM at 40°C demonstrate that the motors can be fully activated for a short period of time before thermally induced protein damage begins.
Figure 3.
Time course showing reversible changes in the sliding movement of an actin filament with repetitive temperature pulses. Displacement of the centroid of the fluorescence image of the actin filament (1.0 μm long) is shown by ○ every 1/30 s. A laser pulse of 0.53-s duration was given every 1.07 s. The temperature was estimated from the average intensity of the actin filament in each frame at 30 frames/s. ● and error bars show the average ± SD for 14 consecutive frames (0.47 s). The coverslip temperature was kept at 18°C ± 1°C.
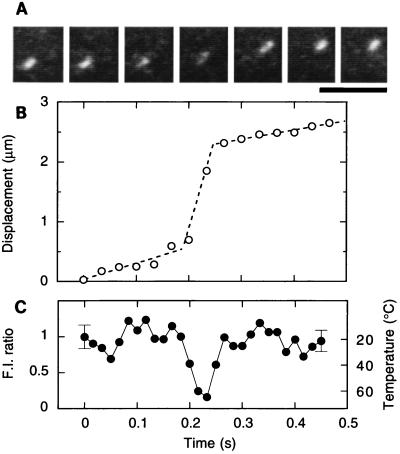
Next, we examined sliding movement of an actin filament during very short temperature pulses by using a shutter (Fig. 1). When illuminated with a laser pulse with a duration of 1/16 s, an abrupt displacement of the actin filament, by as much as 1.6 μm, occurred, corresponding to a sliding velocity of about 26 μm/s (Fig. 4 A and B). The average temperature during this 1/16-s illumination was estimated to be 45°C and the maximum temperature exceeded 60°C (Fig. 4C). On shortening the duration of the temperature pulse, the degree of abrupt displacement correspondingly decreased, i.e., 1 μm (average sliding velocity, 32 μm/s) for 1/32 s, 0.5 μm (32 μm/s) for 1/64 s, and 0.2 μm (26 μm/s) for 1/128-s illumination. The fact that the displacement was proportional to the duration of the temperature pulse implies that steady-state sliding at the high temperature already was achieved at the shortest duration of 1/128 s. In the Huxley scheme (30), the steady-state velocity of unloaded sliding is given by hg2/2, where h is the maximal distance over which a myosin head attached to actin can exert positive tension (power stroke) and g2 is the rate of unbinding for the head that has undergone a power stroke and is exerting a negative tension. The increase in the sliding velocity by more than an order of magnitude upon heating likely resulted from a corresponding increase in g2 rather than in h. That is, the rate of unbinding, which is presumably coincident with the ADP release under the present condition where ATP was abundant, increases sharply with temperature. The rate of head binding is likely to also increase with temperature, because otherwise the actin filament would tend to float into the medium, and the tension, proportional to the number of heads attached to the filament, would be greatly reduced whereas our experiment showed the contrary (see below). The high temperature coefficient of the rate of ATP hydrolysis (22), a 5-fold increase from 22°C to 30°C, is consistent with these views. Kitamura et al. (31) have reported that the sliding distance per head per ATP can be as long as 30 nm, a value difficult to explain with a conventional power stroke model. Even so, the distance per ATP is not critically dependent on temperature (31), and thus the unbinding rate has to increase with temperature.
Figure 4.
Time course showing a reversible change in the sliding movement of an actin filament with a single temperature pulse. (A) Snapshots of a sliding actin filament (1.1 μm long) at 1/30-s intervals. A laser pulse of 1/16-s duration was given halfway at 0.19 s. (Scale bar, 5 μm.) (B) Time course of sliding movement of the actin filament; displacement of the centroid of the fluorescence image of the actin filament is shown by ○. (C) The temperature estimated from the average intensity of the filament at 1/60-s intervals. In this particular case, odd and even fields of interlaced images were analyzed separately. The coverslip temperature was kept at 18°C ± 1°C.
The sliding velocities, v, obtained under the long and short temperature pulses were fitted with an Arrhenius equation, v(T) = v0exp(−Ea/RT) where v0 is a constant and R is the gas constant. The apparent activation energies, Ea, turned out to be 100 kJ/mol between 18°C and 30°C and 50 kJ/mol between 30°C and 45°C. These activation energies agree with those of prior reports (27–29), although the transition between the two temperature regions in the previous studies was at about 20°C rather than 30°C as shown here. The discrepancy could be the result of thermal deterioration that might have occurred at lower temperatures in the previous studies.
Next, to examine the potential of skeletal myosin for high sliding velocity, we used a higher ionic strength (50 mM KCl) (29), resulting in 52 ± 5 μm/s (n = 8) for a 0.5-s period at 46°C ± 7°C (n = 8) (estimated by averaging the fluorescence intensity over 0.5 s for each sample). The sliding velocity obtained here is the highest reported for skeletal myosin in a usual in vitro motility assay, although there is a report that the velocity of a large bead coated with myosin (65 μm in diameter) reached 500 μm/s at room temperature in a specially designed motility assay system (32). Faster sliding at higher ionic strength has been observed at lower temperatures (29). High salt may induce faster release of strongly bound heads (g2 above) and/or the reduction of weakly binding interactions (33) that precede strong binding and that may impede sliding (34). The weakly binding interactions operate mainly at low ionic strengths (33).
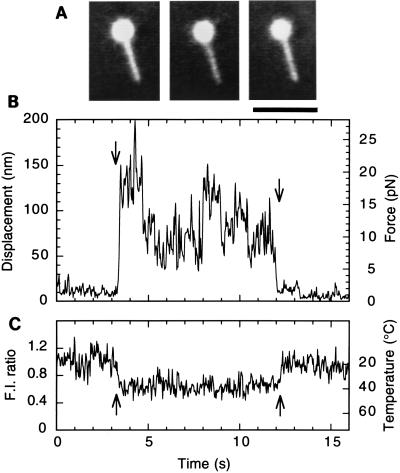
We applied TPM to tension generation on single actin filaments. The tension record presented in Fig. 5 shows that an abrupt increase in tension (from 2 pN to 15–20 pN), in other words, sliding movement extending over a longer distance (10 nm to 100–150 nm) from the center of an optical trap, occurred after the temperature jump. A large tension fluctuation was observed around steady-state levels that were maintained for 1–2 s, during each of which the actin filament appeared to slide in one direction. The abrupt changes in the steady tension level, observed several times at 40°C in Fig. 5B, may be attributable to slight changes in the sliding direction resulting in a different number of heavy meromyosin molecules that can interact with the actin filament. The tension fluctuation did not correlate with the fluctuation of fluorescence intensity, indicating that the tension fluctuation is not attributable to temperature fluctuation. The average tension increased 5- to 10-fold with the increase in temperature from 18°C to 40°C and paralleled the increase in sliding velocity (Figs. 3 and 4).
Figure 5.
Tension response of a single actin filament to a temperature pulse. (A) Fluorescence image of a bead-tailed actin filament (3.7 μm long) obtained by averaging 15 video frames for 0.5 s before, during, and after the temperature pulse, respectively, from left to right. The bead was coated with rhodamine-labeled BSA (23). The bead brightness is clipped in the central portion. (Scale bar, 5 μm.) (B) Time course of tension generation (displacement of the bead); a shutter for laser illumination was opened and closed at the times indicated by the left and right arrows, respectively. (C) Temperature was estimated from the fluorescence intensity profile obtained at the middle portion of the actin filament during the laser illumination and was 40°C ± 5°C (estimated by averaging the fluorescence intensity over 0.5 s). Only in this case, the fluorescence intensity gradually decreased with photobleaching because of prolonged laser illumination. The coverslip temperature was kept at 18°C ± 1°C.
In muscle fibers, it was reported that force rose by a factor of 2 to 3 (9, 11, 12, 35) between 5°C and 20°C but only by a factor of ≈1 (9, 12) or ≈1.5 (11) between 20°C and 40°C, much less than the 5- to 10-fold increase in our case. In principle, an increase in tension implies that each myosin head while attached to an actin filament exerts a larger force, and/or that a larger number of heads are attached at any instant. However, the former possibility, an increase in tension per attached head, is unlikely to be the major factor for the 5- to 10-fold increase in tension observed here. The number of attached heads must increase with temperature. Because the increase in the sliding velocity at no external load points to an increase in the rate of unbinding, as discussed above, the rate of head binding to actin has to increase with temperature more than the increase in the unbinding rate. This enormous increase in binding rate is probably peculiar to the in vitro system. On the glass surface, unlike muscle interior, an actin filament tends to float into the medium by Brownian motion. Myosin heads cannot bind to the filament unless the filament happens to be close to the heads. The binding is thus cooperative in that binding of one head greatly facilitates the binding of neighboring heads. A slight increase in the affinity of myosin to actin, enough to account for the fiber data, will be amplified by this cooperativity.
As demonstrated by TPM, motor activity can be reversibly enhanced without denaturation upon raising the temperature above physiological levels (instantaneously, higher than 60°C). We can study the effects of various temperatures (and also the temperature gradient) at the same time for different molecules and different periods of time for the same molecules. The TPM described here can be improved to meet various applications. For example, the heat source of any size and shape can be made by microfabrication techniques. TPM in combination with real-time imaging of temperature on proteins should find broad applications in the studies of the energetics of protein–protein interactions and the response of cellular processes to thermal modulation, not only limited to cell motility but also on various aspects of cellular metabolism and signal transduction within and between cells.
Acknowledgments
This research was supported by Grants-in-Aid for Scientific Research, for Scientific Research on Priority Areas and for the High-Tech Research Center Project from the Ministry of Education, Science, Sports and Culture of Japan, by Core Research for Evolutional Science and Technology (CREST) of Japan Science and Technology Corporation and by a Waseda University Special Grant-in-Aid.
ABBREVIATION
- TPM
temperature-pulse microscopy
References
- 1.Funatsu T, Harada Y, Tokunaga M, Saito K, Yanagida T. Nature (London) 1995;374:555–559. doi: 10.1038/374555a0. [DOI] [PubMed] [Google Scholar]
- 2.Sase I, Miyata H, Corrie J E T, Craik J S, Kinosita K., Jr Biophys J. 1995;69:323–328. doi: 10.1016/S0006-3495(95)79937-4. [DOI] [PMC free article] [PubMed] [Google Scholar]
- 3.Sase I, Miyata H, Ishiwata S, Kinosita K., Jr Proc Natl Acad Sci USA. 1997;94:5646–5650. doi: 10.1073/pnas.94.11.5646. [DOI] [PMC free article] [PubMed] [Google Scholar]
- 4.Ishijima A, Kojima H, Funatsu T, Tokunaga M, Higuchi H, Tanaka H, Yanagida T. Cell. 1998;92:161–171. doi: 10.1016/s0092-8674(00)80911-3. [DOI] [PubMed] [Google Scholar]
- 5.Svoboda K, Schmidt C F, Schnapp B J, Block S M. Nature (London) 1993;365:721–727. doi: 10.1038/365721a0. [DOI] [PubMed] [Google Scholar]
- 6.Finer J T, Simmons R M, Spudich J A. Nature (London) 1994;368:113–119. doi: 10.1038/368113a0. [DOI] [PubMed] [Google Scholar]
- 7.Miyata H, Hakozaki H, Yoshikawa H, Suzuki N, Kinosita K, Jr, Nishizaka T, Ishiwata S. J Biochem. 1994;115:644–647. doi: 10.1093/oxfordjournals.jbchem.a124389. [DOI] [PubMed] [Google Scholar]
- 8.Nishizaka T, Miyata H, Yoshikawa H, Ishiwata S, Kinosita K., Jr Nature (London) 1995;377:251–254. doi: 10.1038/377251a0. [DOI] [PubMed] [Google Scholar]
- 9.Goldman Y E, McCray J A, Ranatunga K W. J Physiol (London) 1987;392:71–95. doi: 10.1113/jphysiol.1987.sp016770. [DOI] [PMC free article] [PubMed] [Google Scholar]
- 10.Davis J S, Harrington W F. Proc Natl Acad Sci USA. 1987;84:975–979. doi: 10.1073/pnas.84.4.975. [DOI] [PMC free article] [PubMed] [Google Scholar]
- 11.Bershitsky S Y, Tsaturyan A K. J Physiol (London) 1992;447:425–448. doi: 10.1113/jphysiol.1992.sp019010. [DOI] [PMC free article] [PubMed] [Google Scholar]
- 12.Ranatunga K W. Biophys J. 1996;71:1905–1913. doi: 10.1016/S0006-3495(96)79389-X. [DOI] [PMC free article] [PubMed] [Google Scholar]
- 13.Liu Y, Cheng D K, Sonek G J, Berns M W, Chapman C F, Tromberg B J. Biophys J. 1995;68:2137–2144. doi: 10.1016/S0006-3495(95)80396-6. [DOI] [PMC free article] [PubMed] [Google Scholar]
- 14.Kolodner P, Tyson J A. Appl Phys Lett. 1982;40:782–784. [Google Scholar]
- 15.Romano V, Zweig A D, Frenz M, Weber H P. Appl Phys B. 1989;49:527–533. [Google Scholar]
- 16.Zohar O, Ikeda M, Shinagawa H, Inoue H, Nakamura H, Elbaum D, Alkon D L, Yoshioka T. Biophys J. 1998;74:82–89. doi: 10.1016/S0006-3495(98)77769-0. [DOI] [PMC free article] [PubMed] [Google Scholar]
- 17.Washizu M, Kurosawa O, Suzuki S, Shimamoto N. SPIE. 1996;2716:133–143. [Google Scholar]
- 18.Kinosita K, Jr, Itoh H, Ishiwata S, Hirano K, Nishizaka T, Hayakawa T. J Cell Biol. 1991;115:67–73. doi: 10.1083/jcb.115.1.67. [DOI] [PMC free article] [PubMed] [Google Scholar]
- 19.De la Cruz E M, Pollard T D. Biochemistry. 1994;33:14387–14392. doi: 10.1021/bi00252a003. [DOI] [PubMed] [Google Scholar]
- 20.Nishizaka T, Yagi T, Tanaka Y, Ishiwata S. Nature (London) 1993;361:269–271. doi: 10.1038/361269a0. [DOI] [PubMed] [Google Scholar]
- 21.Yanagida T, Nakase M, Nishiyama K, Oosawa F. Nature (London) 1984;307:58–60. doi: 10.1038/307058a0. [DOI] [PubMed] [Google Scholar]
- 22.Harada Y, Sakurada K, Aoki T, Thomas D D, Yanagida T. J Mol Biol. 1990;216:49–68. doi: 10.1016/S0022-2836(05)80060-9. [DOI] [PubMed] [Google Scholar]
- 23.Suzuki N, Miyata H, Ishiwata S, Kinosita K., Jr Biophys J. 1996;70:401–408. doi: 10.1016/S0006-3495(96)79583-8. [DOI] [PMC free article] [PubMed] [Google Scholar]
- 24.Kron S J, Toyoshima Y Y, Uyeda T Q P, Spudich J A. Methods Enzymol. 1991;196:399–416. doi: 10.1016/0076-6879(91)96035-p. [DOI] [PubMed] [Google Scholar]
- 25.Sellers J R, Kachar B. Science. 1990;249:406–408. doi: 10.1126/science.2377894. [DOI] [PubMed] [Google Scholar]
- 26.Tanaka Y, Ishijima A, Ishiwata S. Biochim Biophys Acta. 1992;1159:94–98. doi: 10.1016/0167-4838(92)90079-s. [DOI] [PubMed] [Google Scholar]
- 27.Anson M. J Mol Biol. 1992;224:1029–1038. doi: 10.1016/0022-2836(92)90467-x. [DOI] [PubMed] [Google Scholar]
- 28.Winkelmann D A, Bourdieu L, Ott A, Kinose F, Libchaber A. Biophys J. 1995;68:2444–2453. doi: 10.1016/S0006-3495(95)80426-1. [DOI] [PMC free article] [PubMed] [Google Scholar]
- 29.Homsher E, Wang F, Sellers J R. Am J Physiol. 1992;262:C714–C723. doi: 10.1152/ajpcell.1992.262.3.C714. [DOI] [PubMed] [Google Scholar]
- 30.Huxley A F. Prog Biophys Biophys Chem. 1957;7:255–318. [PubMed] [Google Scholar]
- 31.Kitamura K, Tokunaga M, Hikikoshi-Iwane A, Yanagida T. Nature (London) 1999;397:129–134. doi: 10.1038/16403. [DOI] [PubMed] [Google Scholar]
- 32.Suda H, Ishikawa A. Biochem Biophys Res Commun. 1997;237:427–431. doi: 10.1006/bbrc.1997.7048. [DOI] [PubMed] [Google Scholar]
- 33.Brenner B. Annu Rev Physiol. 1987;49:655–672. doi: 10.1146/annurev.ph.49.030187.003255. [DOI] [PubMed] [Google Scholar]
- 34.Tawada K, Sekimoto K. J Theor Biol. 1991;150:193–200. doi: 10.1016/s0022-5193(05)80331-5. [DOI] [PubMed] [Google Scholar]
- 35.Bershitsky S Y, Tsaturyan A K, Bershitskaya O N, Mashanov G I, Brown P, Burns R, Ferenczi M A. Nature (London) 1997;388:186–190. doi: 10.1038/40651. [DOI] [PubMed] [Google Scholar]


