

Abstract
Laminin-1 (α1β1γ1), a basement membrane (BM) constituent, has been associated with differentiation processes and also with malignant progression. In the intestinal tissue, the α1 chain is expressed and secreted in the subepithelial BM during the developmental period; in the adult rodent tissue, it is restricted to the BM of the dividing cells. To understand how laminin α1 chain expression is regulated, we cloned and characterized a 2-kb promoter region of the Lama1 mouse gene. Analysis of the promoter was conducted in the Caco2-TC7 intestinal epithelial cells by transient transfection of serially deleted and site-directed mutated promoter constructs, by electrophoretic mobility shift assays, and expression of selected transcription factors. We determined that a proximal region, which includes an Sp1-binding GC box and a Krüppel-like element, was important for the promoter activity. This region is conserved between the human and mouse genes. Interestingly, two Krüppel-like factors KLF4 and KLF5 exhibit opposing effects on the Lama1 promoter activity that are decreased and increased, respectively, in the intestinal epithelial cells. These data corroborate the complementary expression of KLF4 and KLF5 along the intestinal crypt-villus axis and the parallel expression of KLF5 and laminin α1 chain in the crypt region. Finally, we showed that glucocorticoids stimulate the promoter activity. This study is the first characterization of the Lama1 promoter; we identified regulatory elements that may account for the expression pattern of the endogenous protein in the mouse intestine.
Laminins are large glycoproteins of the extracellular matrix and more precisely of the basement membranes (BMs).1 Laminins are heterotrimeric molecules formed by the association of α, β, and γ chains through disulfide bonds. Up to now, five different α chains (α1 to α5), three β chains (β1 to β3), and three γ chains (γ1 to γ3) have been identified; they are encoded by different genes. To date 15 laminin isoforms have been described (1–3). Laminin-1 (LN-1), the originally discovered laminin, consists of α1, β1, and γ1 chains (4). Laminin-1 is expressed at early stages of embryonic development (5), and it has been demonstrated that its constituent α1 chain is important for the secretion of the molecule (6, 7).
In the course of the last years, the different laminin isoforms described so far have been found in various organs, where they are expressed in BMs according to tightly controlled developmental and spatial localization. The role of laminins has been approached in various cellular models and elucidated because of genetic defects in humans and gene inactivation in mice (1, 8). These experiments point to the major contribution of these molecules in the embryonic development, morphogenesis, and physiological processes (like cell proliferation, differentiation, cell shape, and movement) directly linked to tissue homeostasis and wound healing but also in tumor development and metastasis formation. Therefore, BM molecules must be precisely controlled to be expressed at the right time, in the relevant location, and in the appropriate amount. Significant progress has been achieved during the last years in the elucidation of the transcriptional regulation of laminin promoters and in the nature of the transcription factors involved in this regulation (see Refs. 9–17).
The intestinal tissue develops from the association of the embryonic visceral endoderm and of the mesoderm, immediately separated by a BM. In parallel to the formation of a single epithelial cell layer, morphogenesis proceeds with the segregation of the epithelial cells into two distinct compartments comprising the proliferative cells (crypts) and the differentiating and differentiated cells (villi), respectively, underlined by a subepithelial BM. We and others have elucidated the composition of the intestinal BM during development as well as in the adult organ. At least five different LN isoforms have been found to be expressed with specific patterns as a function of the developmental stage and of the crypt-to-villus localization in rodents and humans (for reviews see Refs. 3, 18, and 19). We have been particularly interested in further analyzing the regulation and role of laminin-1 (LN-1) and, in particular, of the α1 chain encoded by the LAMA1 gene for the following reasons. LN-1 is expressed early during intestinal development, specifically at the interface between endoderm and mesenchyme, and during the morphogenetic period in the subepithelial BM. In contrast, in the mature organ, the α1 chain is restricted to the crypt BM in rodents (20, 21). The use of interspecies intestinal endoderm/mesenchyme recombinants developed for various times as intracoelomic grafts allowed us to conclude that at the early stages of BM formation, the α1 chain found deposited in the BM is produced exclusively by the endodermal cells, whereas at later stages it is produced by both epithelial and mesenchymal tissue components (22).
Concerning the role of LN-1, earlier experimental work allowed us to point to the importance of this molecule in the differentiation of fetal intestinal endodermal and human colonic cancer cells. Indeed, in co-cultures of endodermal micro-explants on mesenchymal cells, the deposition of LN-1 precedes the functional differentiation of the epithelial cells, which was blocked by the addition of anti-laminin antibodies. Furthermore, the deposition of the α1 chain was accelerated by the addition in the culture medium of glucocorticoids (GCs), known to accelerate the intestinal maturation (23, 24). Further experiments, including mainly cultures of intestinal cells on LN-1 coatings, suggested the role of this matrix molecule in the morphological and functional cell differentiation (25–27). In contrast, other experimental models, laminin α1 chain overexpression or LN-1 co-injection with cancer cells, indicated that this laminin isoform is also associated to tumor cell growth and metastasis promotion (28–30). The complex spatiotemporal expression pattern as well as the different roles of LN-1 observed in various experimental conditions suggest the existence of various regulatory pathways controlling its expression.
In the present study, we characterize for the first time the 5′-flanking region of the Lama1 gene encoding laminin α1 chain. Through transient transfections in intestinal epithelial cells, we show that a proximal Sp1 site is crucial for the basal promoter activity. We also present evidence that the transcription of LAMA1 is regulated by transcription factors belonging to the intestinal Krüppel family: KLF4 (GKLF) and KLF5 (IKLF). In addition, glucocorticoids up-regulate the laminin α1 mRNA level and stimulate the promoter activity. This promoter analysis suggests a molecular basis for the tissue-specific expression pattern of the laminin α1 chain.
EXPERIMENTAL PROCEDURES
Materials
Oligonucleotides were obtained from MWG Biotech (Germany). The λ 129/sv genomic library was a kind gift from Dr. J. M. Garnier (Illkirch, France). The pGL3-basic and pGEMT easy vectors were purchased from Promega. pBluescript SK+ and pPCRscript vectors were from Stratagene. The pCMV β-galactosidase expression vector was obtained from Clontech. pCMV Sp1 and pCMV Sp3 were from Dr. G. Suske (Marburg, Germany); pMT3 KLF4 and pMT3 KLF5 were from Dr. V. Yang (Atlanta, GA); pPAC β-galactosidase, pPAC Sp1, and pPAC Sp3 were from Dr. R. Tjian (Berkeley, CA); pPAC KLF4 was from Dr. K. Bomsztyk (Seattle, WA); and the pGo glucocorticoid receptor expression vector was from D. Metzger (Illkirch, France). Gene Editor kit was from Promega. T4 polynucleotide kinase and T4 DNA ligase were from Invitrogen, and restriction enzymes were from New England Biolabs. The RNase protection kit (RPA III) was from Ambion. Radio-chemicals were from ICN Pharmaceuticals. All reagents for digoxigenin (DIG) labeling, hybridization, and revelation were from Roche Applied Science. The Exgen 500 transfection agent was obtained from Euromedex (France). Cell culture media, fetal calf serum (FCS), and non-essential amino acids were purchased from Invitrogen. Dexamethasone (DX) and Hoechst 33342 were purchased from Sigma.
Cell Lines
The human Caco2-TC7 colon adenocarcinoma cell line (31) was used between passages 25 and 38. The cells were maintained in Dulbecco's modified Eagle's medium (Invitrogen) supplemented with 20% heat-inactivated fetal calf serum (FCS, Invitrogen), 1% non-essential amino acids (Invitrogen), and 40 μg/ml gentamycin. In some experiments, dexamethasone (DX; 76.5 nm), a synthetic glucocorticoid, was added in the culture medium for 3, 4, 6, and 8 days. Mouse teratocarcinoma-derived parietal yolk sac carcinoma (PYS) cells that produce LN-1 (32) were provided by Dr. L. Sorokin (Lund, Sweden) and cultured in Dulbecco's modified Eagle's medium supplemented with 10% FCS and antibiotics. The C20 intestinal fibroblast cell line (33) was cultured in RPMI 1640 medium (Invitrogen) supplemented with 10% FCS and antibiotics. The Drosophila S2 cell line, provided by the Institut de Génétique et de Biologie Moléculaire et Cellulaire (Illkirch, France) cell culture service facilities, was cultured in Schneider medium (Invitrogen) supplemented with 10% FCS and antibiotics. All cultures were maintained in a humidified atmosphere containing 5% CO2 at 37 °C, except S2 cells which were maintained at 28 °C.
Sequence Analysis
Sequence alignment was done using a Fasta program (34), on www.infobiogen.fr/services/analyseq/cgi-bin/lfastan_in.pl. The search for putative transcription factor-binding elements was done by using MatInspector Professional program at www.genomatix.de or by using sequence data found in the literature.
Plasmid Construction
Two λ clones were isolated and purified from a 129/sv genomic library using a PCR fragment probe corresponding to positions 56−180 bp of the murine laminin α1 cDNA (GenBank™ accession number J04064). The inserts of these two clones were subcloned in the NotI site of pBluescript SK+ generating the plasmids pBSλ12 and pBSλ15 and were then sequenced. Each of them contains the potential promoter region, the first exon, and part of the first intron. A 2.4-kb BsrBI genomic fragment just upstream from the ATG initiator was subcloned in pPCRscript vector. From this construct, a 2-kb SpeI-BstXI fragment was subcloned in front of the luciferase gene at the NheI-SmaI sites of pGL3 basic, generating the plasmid pGL3-PLnα1. This 2-kb fragment was totally sequenced (GenBank™ accession number AJ519495). For the search of the initiation of the transcription, a genomic HincII-SacI fragment from pBSλ15 (containing the potential +1 transcription start site, the first exon, and a few nucleotides of the first intron) was subcloned into the SacI-HincII site of pBluescript SK+ vector generating pBSLnα1 5′HincII-SacI plasmid.
Site-directed Mutagenesis and Generation of the Deletion Constructs
Mutagenesis was performed on a pGL3-PLnα1 construct using the Gene Editor kit. Primers for point mutations (see Table I) were designed in order to introduce a KpnI or an XhoI site in the core sequence of the putative transcription factor-binding sites. Serial promoter deletions were performed by cutting the different point mutation constructs with KpnI and followed by ligation. All constructs were verified by sequencing at the Institut de Génétique et de Biologie Moléculaire et Cellulaire (Illkirch, France) sequencing service facility.
Table I.
Oligonucleotides used in this study for mutagenesis and shift experiments The mutated bases are underlined.
| Mutagenesis | Sequence |
|---|---|
| PLnα1s mut C/EBPβ and Δ-1836 | 5′-GGCAATTTAGGTATTGGGTACCAGAGTGAGG-3′ |
| PLnα1s mut GRE | 5′-GAGGAGTGGAAAACTCGAGCCTGTGAACTTTC-3′ |
| PLnα1s Δ-1805 | 5′-AAACTCTGTCCTGGTACCTTTCATAAAACA-3′ |
| PLnα1s mut AP1 and Δ-1596 | 5′-TCCAGCACCAGGGGTACCTGACCTGCAGGC-3′ |
| PLnα1s mut HNF3β | 5′-GGGCTGGCAAAGGTACCAAATGAAAACACAG-3′ |
| PLnα1 Δ-512 | 5′-AACAAACAAAATGGTACCACAGCCACCCAA-3′ |
| PLnα1s mut KLF4 and Δ-98 | 5′-GGGCGCAGCGGGTACCCTTTGGGGGAG-3′ |
| PLnα1s mut Sp1 and Δ-63 | 5′-TGGGTAGGACAGGGGTACCGCGCGGCCAGG-3′ |
| Shift experiments | Sequence |
|---|---|
| Sp1 shift | 5′-GGGTAGGACAGGGGCGGGGCGCGGCCA-3′ |
| Mut Sp1 shift | 5′-GGGTAGGACAGGGGTACCGCGCGGCCA-3′ |
| KLF shift | 5′-TGGGCGCAGCGGGGCGCCTTTGGGGGA-3′ |
| Mut KLF shift | 5′-TGGGCGCAGCGGGTACCCTTTGGGGGA-3′ |
| SIF | 5′-GATCCGTGCAATAAAACTTTATGAGTAA-3′ |
| TDA | 5′-ATGCAGGAGAAAGAAGGGATGC-3′ |
Reverse Transcriptase (RT)-PCR
After cell homogenization with TriReagent (Molecular Research Center Inc.), the mixture was centrifuged for 5 min at 12,000 × g to discard genomic DNA contained in the pellet. RNA was then extracted according to the recommendations of the supplier. RNA concentration was determined by absorbance at 260 nm. After initial denaturation of 3 μg of total RNA with 50 pmol of oligo(dT) for 5 min at 75 °C, single-stranded cDNA was synthesized for 1 h at 42 °C in 30 μl containing 10 units of avian myeloblastosis virus-reverse transcriptase (Finnzymes, Finland), 0.4 mm each dNTP, in the 1× buffer supplied with the enzyme.
PCRs were performed in 100 μl, containing 1 μl of cDNA solution, 50 pmol of primers, 0.5 unit of Dynazyme DNA polymerase (Finnzymes, Finland), 0.25 mm each dNTP in 1× buffer (containing 1.5 mm MgCl2) supplied with the enzyme. Dynawax (Finnzymes) was used to separate the template cDNA and primers from the DNA polymerase before the first step of denaturation. PCR used an I-Cycler apparatus (Bio-Rad). Glucocorticoid receptor primers (recognizing mouse and human sequences) are as follows: RGC1, 5′-CAGCATGCCGCTATCGAAAATGTC-3′; RGC2, 5′-TGTCAGTTGATAAAACCGCTGCCA-3′; annealing temperature 55 °C, between 35 and 40 cycles, product 737 bp (GenBank™ accession number M10901). Glyceraldehyde phosphate dehydrogenase primers are as follows (recognizing mouse and human sequences): GAPDH1, 5′- GGCTGAGAACGGGAAGCTTGTGATCAATGG-3′; GAPDH2, 5′-GTCGCTGTTGAAGTCAGAGGAGACCACCTG-3′; annealing temperature 60 °C, between 25 and 30 cycles, product 685 bp (GenBank™ accession number M33197). General conditions were as follows: initial denaturation at 94 °C for 3 min followed by 25−40 cycles (depending of the pair of primers used) with denaturation at 94 °C for 30 s, annealing temperature (55−60 °C) for 30 s, and elongation at 72 °C for 1 min. A final elongation of 5 min was done at the end of cycling. Control PCR was performed directly on RNA without the step of cDNA synthesis; no amplified DNA fragment was detected in this case.
PCR fragments were loaded on 3% (w/v) agarose ethidium bromide-stained gels and analyzed using Gel Doc 1000 apparatus (Bio-Rad). RT-PCR fragments were cloned in the pGEM-T easy plasmid and sequenced to confirm their identities.
Northern Blot
10 μg of total RNA from Caco2-TC7 cells, treated or not with DX for 4, 6, and 8 days, or 3 μg of 0.24−9.5-kb RNA ladder (Invitrogen) were fractionated by electrophoresis on 1% agarose gels in the presence of 2 m formaldehyde, transferred to nylon membranes (Roche Applied Science), and bound to the membrane with an UV cross-linker (Bioblock Scientific, France). The RNA integrity was checked by methylene blue staining of the membrane.
Plasmids containing specific probe for mouse laminin α1 (26) and mouse GAPDH (described above) were employed. Antisense DIG RNA-labeled probes were synthesized using 1 μg of linearized plasmid DNA with the DIG RNA labeling kit according to the manufacturer's instructions (Roche Applied Science). Probe concentrations were estimated by serial dilutions of the labeling mix compared with an RNA labeling DIG standard (Roche Applied Science). Pre-hybridization was performed at 68 °C in 10 ml of DIG Easy Hyb solution (Roche Applied Science) for at least 1 h. For hybridization, laminin α1 (50 ng/ml) or GAPDH (2 ng/ml) probe was denatured for 5 min at 100 °C, chilled on ice, and added to 10 ml of pre-warmed (68 °C) DIG Easy Hyb solution. Following overnight hybridization at 68 °C, the membranes were washed two times for 15 min in 2× SSC, 0.1% SDS at 68 °C and two times 30 min in 0.1× SCC, 0.1% SDS at 68 °C. Saturation of nonspecific binding sites was done for 1 h using blocking solution from Roche Applied Science. Anti-digoxigenin antibody conjugated to alkaline phosphatase (Roche Applied Science) diluted to 1/20,000 was added for 30 min, and the blots were then washed twice with wash solution set from Roche Applied Science. Attophos (Roche Applied Science) was then added for 12 h, and the fluorescent signal was analyzed using a Molecular Imager FX apparatus (Bio-Rad) allowing quantifying signal over a 4 log range.
RNase Protection Assay
One μg of pBS Lnα1 5′HincII-SacI plasmid linearized with XhoI was transcribed with 40 units of T3 RNA polymerase (Roche Applied Science) in the presence of 30 μCi of [α-32P]UTP (3000 Ci/mmol), 0.5 mm ATP, 0.5 mm CTP, 0.5 mm GTP, 1 nm UTP, 1 mm DTT, 25 units of RNaseout (Invitrogen) in 1× buffer supplied with the enzyme (Roche Applied Science) in a final volume of 30 μl at 37 °C for 1 h. Template DNA was removed by digestion with 5 units of RNase-free DNase I for 15 min at 37 °C, followed by phenol/chloroform extraction and sodium acetate precipitation. Hybridization and RNase digestion were performed with the RPA III kit in accordance to the manufacturer's instructions (Ambion). In brief, 10 μg of total RNA (from a 15-day mouse placenta or PYS cells) was mixed with 80,000 cpm of Lnα1s 5′HincII-SacI antisense RNA probe in a final volume of 10 μl in the Ambion hybridization buffer. After initial denaturation at 95 °C for 3 min, hybridization was performed at 42 °C for 14 h. RNase A (0.25 unit/ml) and RNase T1 (10 units/ml) was then added in the RNase Digestion Buffer III for 30 min at 37 °C. After precipitation, the protected fragments were separated by electrophoresis through a 7 m urea in a 6% (w/v) polyacrylamide sequencing gel together with an unrelated sequence as a 1-bp molecular marker. Detection was done using a Molecular Imager FX apparatus (Bio-Rad).
Transfection Experiments
For transfections, exponentially growing Caco2-TC7 (6 × 10⁴ cells per well), C20, or S2 cells (15 × 104 per well) were seeded in 24-well culture dishes. For Caco2-TC7, 3 h before transfection, the cells were depleted in FCS and then transfected with Exgen 500/DNA solution (5 μl/1 μg of plasmid DNA) according to the manufacturer's instructions. Each transfection experiment contained 0.15 μg of pCMVβ-galactosidase as an internal transfection control. Transfected cells were lysed after 24−72 h in 150 μl of Dual Light lysis buffer (Tropix). In some experiments, dexamethasone at 76.5 nm final concentrations was added 24 h after transfection, and the cells were then harvested 48 h later.
Luciferase and β-galactosidase activities were measured with the Dual Light system according to the manufacturer's instructions (Tropix). To permit comparison between the various experimental situations, the luciferase activities were normalized to the β-galactosidase activity. For C20 and S2 cells, transfections were done using jetPEI reagent (2 μl/μg DNA for C20 and 1 μl/μg DNA for S2) according to the manufacturer's instructions (Polyplus Transfection, France). Each transfection experiment contained 0.5 μg of reporter plasmid with different amounts (ranging from 5 to 500 ng) of transcription factor expression vectors and with 20 ng of pRL-null vector (Promega) as an internal transfection control. Transfected cells were lysed 48 h later in 150 μl of lysis buffer (Dual Luciferase kit, Promega), and luciferase activities were measured with the dual luciferase system according to the manufacturer's instructions (Promega). Transfections were performed in triplicate, and the results of two to six independent experiments were calculated as the mean of luciferase activity. A lumistar luminometer (BMG, Germany) was used to quantify light signal.
Nuclear Extracts and Electrophoretic Mobility Shift Assay (EMSA)
Nuclear extracts from Caco2-TC7 or C20 cells cultured for 5−6 days were prepared as described (35). For EMSA, 2−5 μg of nuclear extract were mixed with 105 cpm of 5′-32P-labeled double-strand oligonucleotide probes (see Table I) in a DNA binding buffer containing 2.5 mm HEPES, pH 7.9, 20 mm KCl, 0.1 mm EDTA, 0.2 mm DTT, 2% glycerol, 500 ng of poly(dI-dC) (Roche Applied Science) in a final volume of 20 μl and incubated at room temperature for 20 min. The protein-DNA complexes were then separated on a non-denaturing 6% (w/v) polyacrylamide gel at 4 °C. To demonstrate the specificity of the protein-DNA complexes, a large excess (50-fold) of a corresponding, mutated, or unrelated (SIF) unlabeled double-strand oligonucleotide (see Table I) was added 15 min before the radioactive probe. For supershift assays, nuclear extracts were incubated with the radioactive probe for 15 min at room temperature. Antibodies against Sp1 (rabbit antibody SC-59, Santa Cruz Biotechnology), KLF4 (rabbit antiserum kindly provided by Dr. C-C. Tseng, Baltimore), or normal rabbit serum (Vector Laboratories) were then added for 15 min at room temperature.
Western Blot
Western blot analysis of nuclear proteins extracted from Caco2-TC7 or C20 cells (cultured for 5−6 days) was performed. Protein concentration was determined using the Bradford method. Fifty μg of proteins were incubated for 5 min in Laemmli buffer (6.25 mm Tris-HCl, pH 6.8) containing 1% SDS (w/v) with 10 mm DTT at 100 °C. The proteins were then separated on 10% SDS-PAGE gels and subsequently electrotransferred onto nitrocellulose in 25 mm Tris, 0.192 m glycine, pH 8.6, 20% (v/v) ethanol. After transfer, the nitrocellulose was saturated for 1 h at 37 °C in PBS buffer containing 0.05% (v/v) Tween 20 and 5% non-fat dry milk (Bio-Rad), and then incubated overnight at 4 °C in PBS/Tween 0.05%, milk 1% with specific antibodies (see Table II). After reaction with the secondary antibody (see Table II), nitrocellulose membranes were treated with the enhanced chemiluminescence reagent (ECL, Amersham Biosciences) and exposed with Biomax films using an intensifying TranScreen HE (Eastman Kodak). The Magic-Mark Western Standard (Invitrogen) was used as molecular weight markers.
Table II.
Antibodies used in this study The abbreviations used are as follows: WB, Western blot; IF, immunofluorescence.
| Name | Origin | Specificity | Use/dilution | Supplier |
|---|---|---|---|---|
| Sp1 (sc-59) | Rabbit | Sp1 | WB, 1/1000; IF, 1/2000 | Santa Cruz Biotechnology |
| Sp3 (sc-644) | Rabbit | Sp3 | WB, 1/1500; IF, 1/2000 | Santa Cruz Biotechnology |
| KLF4 | Rabbit | KLF4 | WB, 1/200; IF, 1/1000 | Yang et al. (49) |
| BTEB-2 (sc-12998) | Goat | KLF5 | WB, 1/50 | Santa Cruz Biotechnology |
| Rabbit-FITC | Goat | Rabbit IgG | IF, 1/50 | Nordic (France) |
| Goat-FITC | Donkey | Goat IgG | IF, 1/200 | Jackson ImmunoResearch |
| Goat-peroxidase | Rabbit | Goat IgG | WB, 1/4000 | Biosys SA (France) |
| Rabbit-peroxidase | Donkey | Rabbit IgG | WB, 1/5000 | Amersham Biosciences |
Immunofluorescence
Detection of transcription factors was performed on Caco2-TC7 cells grown on glass coverslips for 3 days, fixed 10 min with 2% paraformaldehyde, and permeabilized for 10 min with 0.5% Triton X-100. After incubation in sodium borohydride solution (0.1% in PBS) for 20 min, the cells were washed in PBS and then incubated in 5% normal goat serum (Sigma) for 1 h. Primary antibody (see Table II) was then incubated overnight at 4 °C. After washing in PBS, cells were incubated with the appropriate fluorescein isothiocyanate (FITC)-conjugated secondary antibodies (see Table II) for 30 min. Finally, the cells were washed two times in PBS, incubated with Hoechst 33342 (0.5 μg/ml in PBS) for 10 min, rinsed again with PBS, and mounted under coverslips in 1% para-phenylenediamine dissolved in PBS/glycerol (v/v). The cells were then observed using an AX60 microscope (Olympus). On control experiments the primary antibody was omitted.
Statistical Analysis
The data are presented as means ± S.E. Statistical analysis was performed using the Student's t test.
RESULTS
Cloning and Organization of the 5′ Region of the Lama1 Gene
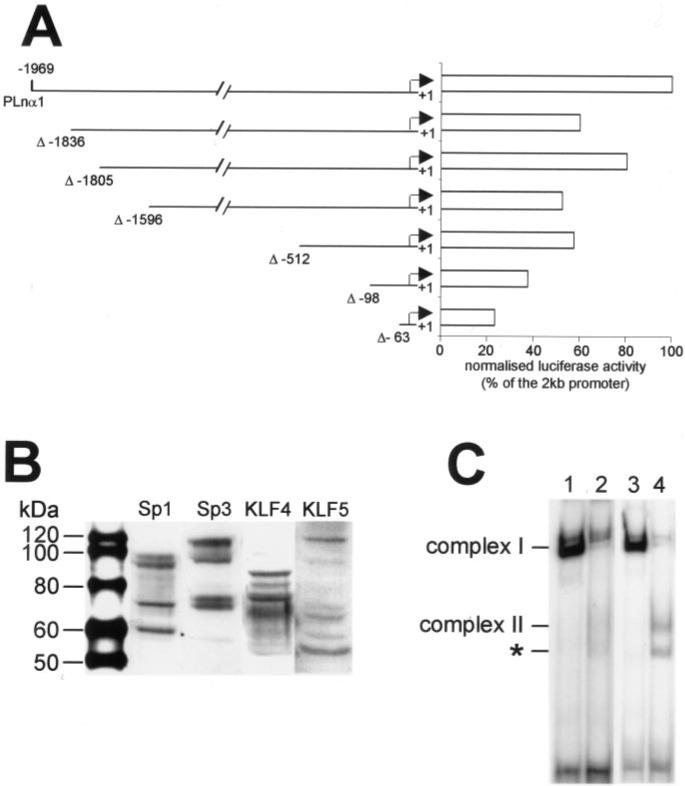
We cloned the 5′-flanking region of the mouse Lama1 gene from a 129/SV mouse genomic λ library. Two overlapping clones were isolated using the 5′ end of the murine Lnα1 cDNA as a probe. Sequencing data and comparison with the mouse Lnα1 cDNA sequence (36) indicate that these two clones contain part of the first intron, the first exon, and different lengths of the 5′-flanking region. 2 kb of the 5′-regulatory region of the mouse Lama1 gene was completely sequenced (Fig. 1A; GenBank™ accession number AJ519495). The transcription start site of the mouse Lama1 gene was determined in the PYS cell line (Fig. 1B, lane 1) and in mouse placenta (Fig. 1B, lane 2) using an RNase mapping approach. The results revealed two major close protected bands; the start site has been defined at the A (+1 on Fig. 1A), because the 160-bp band is more intense and because it is more common for transcription to start at an A rather than a G. Thus the +1 site is situated at 78 bp upstream from the ATG.
Fig.1. The Lama1 gene promoter.
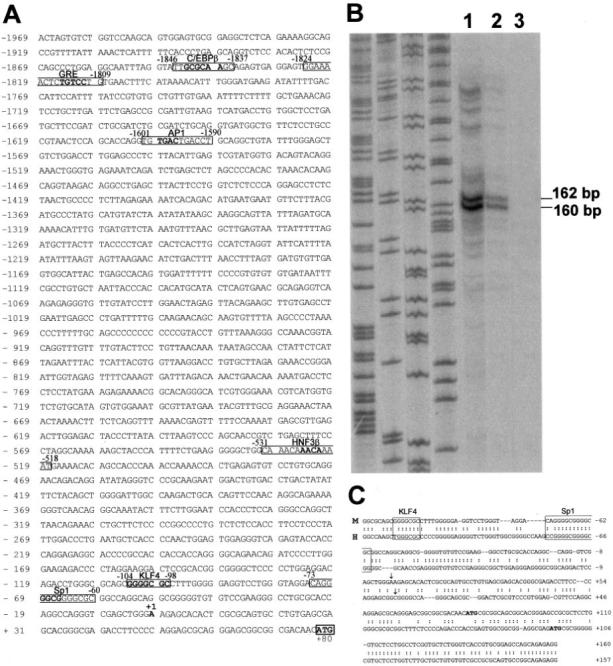
A, mouse DNA sequence of a 2-kb fragment upstream the first ATG (GenBank™ accession number AJ519495). The relative positions of the transcription start site (+1) and of potential regulatory sequences (boxes) are indicated. The boldface letters represent the core sequences of the cis-elements. B, two major transcription start sites were determined by RNase protection assay. A 531-bp HincII-SacI genomic fragment spanning the putative transcription start site was used to generate an RNA antisense 32P-labeled probe, which was hybridized to 10 μg of PYS (lane 1), mouse placenta (lane 2), total RNA or yeast RNA (lane 3) as negative control. After RNase digestion, the protected fragments were separated by electrophoresis through a polyacrylamide sequencing gel together with an unrelated sequence as molecular size marker. When yeast total RNA was used as template, no protected bands were seen. C, the sequence comparison of the proximal mouse (M, top) and human (H, bottom) LAMA1 (accession number AP005062) promoters was performed by the Fasta program. The ATG translation start sites are indicated in boldface. The transcription start sites are indicated by arrows (the human start site is postulated from the cDNA sequence). KLF4 and Sp1 binding sites are marked by boxes.
Conservation of Lama1 Upstream Sequences and of Putative Cis-regulatory Elements between Mouse and Human Genes
Comparison of the Lama1 mouse sequence with the genomic data available for the human LAMA1 gene indicates that the overall exon/intron organization of the mouse and human genes is identical; in addition, the first exon encodes the signal peptide in both species and is followed by a large first intron (personal data and accession number AP005062). Considering the sequence upstream from the mouse ATG, both sequences share a significant degree of homology (63%) in a stretch of about 200 bp (Fig. 1C). Both promoters lack canonical CAAT and TATA box elements.
Some potentially important DNA motifs in the proximal promoters are conserved in the human and murine genes (Fig. 1C) and may be functionally similar. In particular, an Sp1-binding element was found located nearly at the same distance from the first ATG, and a KLF4 (GKLF)-binding site (37, 38) was partially conserved between both sequences, suggesting that these two regulatory sites of the proximal untranslated region might be essential for the basic transcription of the LAMA1 gene.
More distally (Fig. 1A), the mouse promoter comprises other putative regulatory elements that are worthy of interest due to their known involvement in the regulation of intestinal genes: an HNF3β-binding element at −518 bp, an AP1 site at −1590 bp, a glucocorticoid-responsive element (GRE) at −1809 bp, and a CCAAT/enhancer binding protein (C/EBPβ) element at −1837 bp upstream from the transcription initiation site. All these sites are also present in the human Lama1 promoter region (data not shown).
The Transcriptional Activity of the Lama1 Promoter Varies in Different Cell Types
In order to examine the promoter activity, we prepared a chimeric construct (PLnα1) in which a 2-kb fragment of the mouse Lama1 promoter region was inserted upstream from the luciferase gene in the pGL3 basic vector. The transcriptional activity of the 2-kb region of the Lama1 promoter was first analyzed in the colon carcinoma Caco2-TC7 cells. This cell line represents a good in vitro model of intestinal epithelial cells, with successive proliferation and differentiation/polarization processes similar to those occurring in vivo (31). The 2-kb Lama1 promoter/luciferase and CMV promoter/LacZ constructs were co-transfected, and expression of both reporter genes was recorded after 48 h. Compared with the empty vector, the activity of the luciferase gene driven by the Lama1 promoter was increased at least 30-fold, indicating that the 2-kb fragment contains sequences capable of high promoter activity. We then compared its transcriptional activity in two other cell lines to that obtained in the Caco2-TC7 cells (Fig. 2). We found a correlation between the level of the promoter activity and the intrinsic expression of the laminin α1 gene. The highest activity was found in the PYS carcinoma cells that express high levels of endogenous laminin α1 chain (32). Conversely, C20 cells (intestinal mesenchymal cells), which do not express α1 transcripts (33), only support a low promoter activity compared with that recorded in the Caco2-TC7 cells.
Fig.2. Activity of the Lama1 promoter in different cell lines.
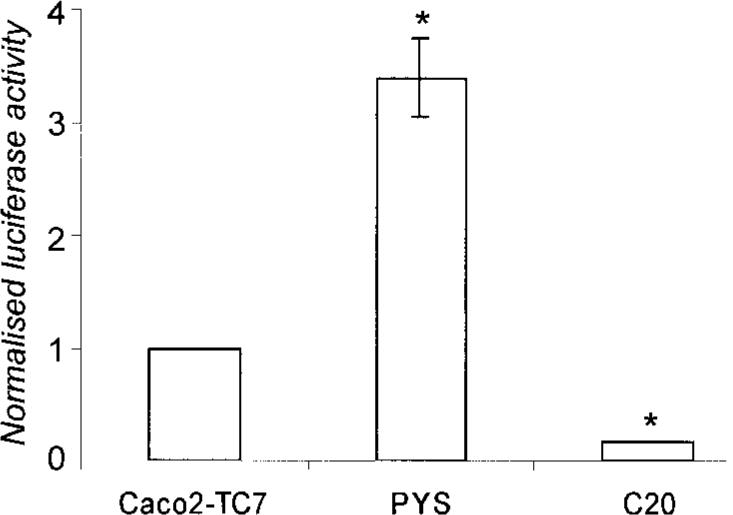
The full-length promoter fragment ligated upstream from the firefly luciferase gene was co-transfected with the control CMV-LacZ construct into different cell lines: the Caco2-TC7 colon carcinoma cell line; the PYS parietal yolk sac carcinoma cell line; and the C20 intestinal fibro-blast cell line. Luciferase activity was recorded 48 h later and expressed relative to the expression of β-galactosidase activity. The transcriptional activity found in the Caco2-TC7 cells was considered as 100%. Columns represent the mean value (±S.E.) of at least 3 different experiments comprising each 6 individual culture wells. The differences between each cell line and the Caco2-TC7 cells are significant: *, p ≤ 0.001.
Importance of the Proximal Sp1 and KLF-binding Elements in the Basal Promoter Activity
To evaluate the role of the various upstream elements of the promoter in controlling the basal expression of the Lama1 gene, we constructed a series of deletions of the 2-kb Lama1 5′-flanking region. They were designed to serially eliminate the putative important cis-regulatory elements described above. In parallel, point mutations within each of these elements were introduced in the full-length promoter. All these plasmids were transiently transfected in the intestinal epithelial Caco2-TC7 cells, and luciferase activity of these constructs was analyzed after 48 h. The various deleted fragments and mutated promoter constructs tested exhibited a transcriptional activity lower than that of the longest intact 2-kb promoter (Fig. 3, A and B). An ∼130-bp distal deletion (Δ-1836) including the deletion of the C/EBPβ-binding element led to a reduction of ∼50% of the basal activity (Fig. 3A). Further deletions (Δ-1805, Δ-1596, and Δ-512) that delete the GRE, AP1, and HNF3β regulatory elements, respectively, stabilize the transcriptional activity to ∼60% of the 2-kb promoter activity. Interesting effects were obtained with the more proximal deletions (Δ-98 and Δ-63) that lack the KLF4 and Sp1 sites, respectively. Indeed, with the shortest construct (Δ-63), the promoter activity was almost abolished, and the construct extending to nucleotide −98 retained only 38% of the 2-kb promoter activity.
Fig.3. Determination of the Lama1 promoter regions implicated in the transcriptional activity, assessed by serial deletions of the promoter (A) or by point mutations within individual putative regulatory elements (B).

A, the schematic representation of the full-length promoter (PLnα1) as well the corresponding size after progressive deletion of the promoter are indicated on the left part of the figure. The boxes on the full-length promoter indicate the putative binding sites for transcription factors. The promoter fragments were ligated upstream from the luciferase gene, and further details concerning the transfections are the same as in Fig. 2 legend. The right part of the figure illustrates the reporter gene activity driven by the different deleted constructs relative to the full-length promoter. Each bar represents the mean (±S.E.) of at least three different experiments comprising each the values of at least 6 individual culture wells. * indicates that the results are significantly different from PLnα1, p ≤ 0.001; **, significant difference between Δ-98 and Δ-512, p ≤ 0.005; ***, between Δ-63 and Δ-98, p ≤ 0.001. B, the left part of the figure illustrates the series of the mutated constructs with the relative positions of the different sites. The right part of the figure illustrates the reporter gene activity driven by the different mutated constructs relative to the pLnα1 full-length promoter. Further details are found in the legend to Fig. 2. *, significantly different from PLnα1, p ≤ 0.005.
To define further the direct implication of the individual cis-regulatory elements of the Lama1 gene, we analyzed constructions carrying mutations of the six putative transcription binding sites in the full-length promoter. Interestingly, the results showed that each point mutation nearly reproduced the results of the deleted constructs (Fig. 3B). In particular, the mutation introduced in the C/EBPβ site reduced the promoter activity by 50%; the mutation in the KLF4 site led to a reduction of the Lama1 promoter activity of ∼70%, and the mutation of the Sp1 site resulted in a 90% decrease of the basal activity.
Thus, both types of experiments emphasize the critical role of the Sp1 element and the participation of the KLF and C/EBPβ elements in the Lama1 gene transcription.
Protein Binding to the Sp1 and KLF Elements
To characterize DNA-protein interactions between transcriptional factors and two of the important cis-regulatory elements of the proximal Lama1 promoter fragment, we performed EMSA experiments using nuclear extracts prepared from Caco2-TC7 cells cultured for 5−6 days.
First, a radiolabeled double-stranded oligonucleotide probe spanning from −81 to −55 comprising the Sp1 consensus sequence (Table I) was incubated with 2 μg of nuclear proteins (Fig. 4A). We detected a major shifted band (complex I, lane 2) that was intensified with increasing concentrations of proteins (not illustrated). A second band was obvious, whose intensity varied according to the nuclear protein preparations (complex II, lane 2). Complexes I and II were both competed with 50× excess of unlabeled oligonucleotide (lane 3) but not with 50× excess of the unlabeled mutated oligonucleotide (Table I and Fig. 4A, lane 5) nor with an unrelated oligonucleotide (Table I and Fig. 4A, lane 6). A supershift of complex I was observed with an anti-Sp1 antibody (lane 4); in this condition complex II disappeared (lane 4). The anti-Sp3 antibody used was without effect (not shown). We tested whether complex II could be due to the binding of KLF factors to the Sp1 probe. We found by EMSA experiments that anti-KLF4 antibodies led to the formation of a smear that may correspond to a shifted complex II. We found by competition experiments that an unlabeled probe selected as a high affinity binding site for KLF factors named TDA (37) led to the disappearance of complex II (not illustrated). These results indicate that Sp1 proteins and most probably KLF factors bind to the −81 to −55-bp element of the Lama1 promoter.
Fig.4. Protein binding to the Sp1 site (A) and to the KLF binding element (B–D) of the proximal Lama1 promoter.
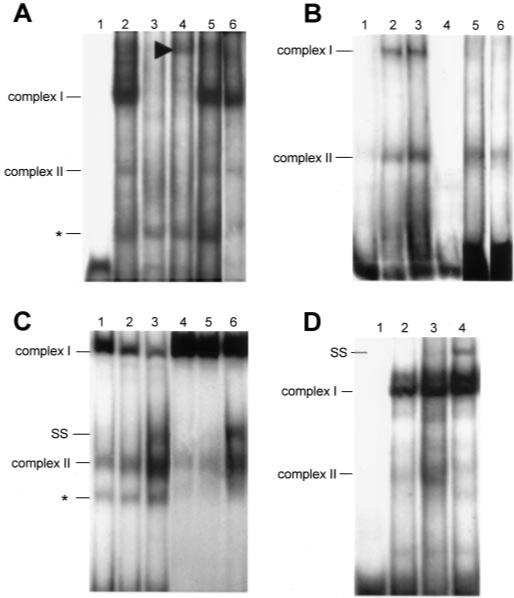
A, EMSA was performed with the radiolabeled probe comprising the Sp1 site and nuclear extracted proteins (2 μg) prepared from Caco2-TC7 cells cultured for 5 days. Two specific complexes (I and II) were regularly obtained (lane 2). Competition experiments were performed with 50× excess of the unlabeled Sp1 probe (lane 3), 50× excess of the unlabeled mutated Sp1 probe (lane 5), or 100× excess of an unlabeled unrelated SIF probe (lane 6). Incubation of the radiolabeled oligonucleotide-nuclear proteins complexes with Sp1 antibodies leads to a supershifted band (arrowhead, lane 4). Lane 1, labeled oligonucleotide without nuclear extracts. B–D, EMSA experiments, performed using the radiolabeled KLF probe and Caco2-TC7 nuclear extracts (2 μg), revealed two complexes similar to those observed with the Sp1 probe (B, lane 2); complex II was intensified with a higher protein concentration (5 μg of proteins, lane 3). Competition experiments were performed with 50× excess of the unlabeled KLF probe (B, lane 4), Sp1 probe (B, lane 5), or mutated KLF probe (B, lane 6). Labeled oligonucleotide without nuclear extracts (B, lane 1). Addition of KLF4 rabbit antiserum (40) (C, lane 3) led to a supershift (SS) of the DNA-Caco2-TC7 nuclear protein complex II although the overall intensity of the two bands was repeatedly intensified; normal rabbit serum had no effect (C, lane 2, compared with the control shift, lane 1). Additional controls were performed with the KLF consensus binding sequence TDA (C, lanes 4−6), which revealed the same bands with Caco2-TC7 nuclear extracts (C, lane 4), and the same supershift of complex II with the KLF4 rabbit antiserum (C, lane 6). Lane 5, addition of the normal rabbit serum to the Caco2-TC7 nuclear protein-TDA complex. Addition of Sp1 antibodies (D, lane 4) induced a supershift (SS) of complex I when compared with the incubation with the control rabbit serum (D, lane 3) or in the absence of antibody (D, lane 2). Lane 1, labeled oligonucleotide without nuclear extracts. The asterisks mark non-identified bands.
We then used a second radiolabeled probe spanning from −114 to −88 that composed the described KLF4-binding element. When the probe was incubated with Caco2-TC7 cell nuclear proteins, two shifted bands were observed (Fig. 4B, lanes 2 and 3, complexes I and II). The complex II was intensified with 5 versus 2 μg of nuclear proteins. Both complexes were competed with 50× excess unlabeled KLF probe (Table I and Fig. 4B, lane 4), whereas only complex II persisted after an incubation with an excess of the mutated KLF probe (Table I and Fig. 4B, lane 6). Similarly, competition with 50× excess unlabeled Sp1 oligonucleotide removed complex I but not complex II (lane 5). As both KLF4 and KLF5 can bind to the same cis-element (38, 39), we tried to define whether one of them, or both, is/are responsible for the shift. The addition of KLF4-specific antibody (40) supershifted the complex II (Fig. 4C, lane 3 compared with lane 1), whereas normal rabbit serum had no effect (Fig. 4C, lane 2). Similar results were obtained with the consensus TDA probe (Fig. 4C, lanes 4−6). Yet the commercial antibody to KLF5 did not modify complex II (not shown). We also confirmed that complex I resulted from the binding of Sp1 factors to the KLF probe as anti-Sp1 antibodies supershifted complex I (Fig. 4D). These results indicate that both KLF and Sp1 factors bind to the −114 to −88-bp element of the Lama1 promoter.
Caco2-TC7 Cells Express the Transcription Factors Sp1, Sp3, KLF4, and KLF5
To complete the EMSA experiments, we analyzed the expression of Sp proteins and of the KLF proteins by Western blotting in nuclear extracts cultured for 5−6 days. The results show that Caco2-TC7 cells express both Sp1 and Sp3 proteins as well as KLF4 and KLF5 proteins (Fig. 5A). The anti-Sp1 antibody revealed the expected doublet at ∼100 kDa but also a lower band at ∼70 kDa. Three major bands were seen with the anti-Sp3 antibody at ∼130, 80, and 60 kDa (as described for this antibody). KLF4 proteins were found migrating at ∼70 and 60 kDa (40), whereas two bands were detected in the case of KLF5, at ∼60 kDa (38) and at a high molecular weight. Immunodetection of these proteins in Caco2-TC7 cells cultured for 3 days (Fig. 5B) allowed us to visualize Sp1 and Sp3 proteins, which were located in the nucleus of the cells, except in the dividing cells where the proteins were cytoplasmic; in contrast, KLF4, which displayed a more punctated expression pattern in the nuclei, was also detectable in the cytoplasm of the quiescent cells. We could not localize the site of KLF5 expression in the cells, as no staining with the commercially available antibody was found.
Fig.5. Caco2-TC7 cells express Sp1, Sp3, KLF4, and KLF5 proteins.
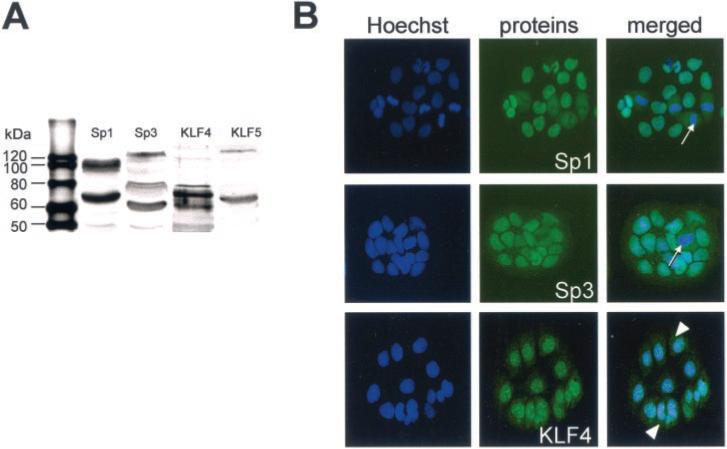
Expression and localization of the transcription factors were assessed by Western blot (A) and immunofluorescence (B) experiments. A, 50 μg of Caco2-TC7 nuclear extracts (5 days cultures) were separated by SDS-PAGE (10%), and protein expression was determined with anti-Sp1, anti-Sp3, anti-KLF4, and anti-KLF5 antibodies, respectively. 1st lane, molecular weight markers (in kDa). B, Caco2-TC7 cells cultured for 3 days on glass coverslips were fixed and permeabilized before incubation with the specific primary antibodies and then with the corresponding fluorescein-labeled secondary antibodies. The figure illustrates the cell nuclei stained with the Hoechst reagent, the specific anti-Sp1, -Sp3, and -KLF4 antibody labeling, and the superposition of both images. Arrows point to mitotic figures, and arrowheads to the cytoplasmic staining of KLF4 in quiescent cells.
Transcription Factors Belonging to the Sp and KLF Family Induce Differential Effects on the Lama1 Promoter Activity
As Sp1, Sp3, KLF4, and KLF5 are expressed in Caco2-TC7 cells, we studied the effects of their individual overexpression on the Lama1 promoter activity. This was done by co-transfection experiments of the corresponding expression vectors and of the wild type or mutated promoter construct. As seen on Fig. 6A, Sp1, Sp3, and KLF5 enhanced the basal activity of the full-length promoter by 2−3 times. Interestingly, co-transfection of KLF4 with the full-length promoter led to an opposing effect as KLF4 decreased this activity by 2-fold (Fig. 6A). To complete the observations obtained with the EMSA experiments, and to determine whether Sp1 factors may act via the KLF site and vice versa for the KLF factors, we did complementary co-transfection experiments of the corresponding expression vectors with the mutated KLF, the mutated Sp1, or the shortest Δ-98 promoter (Fig. 6A). The results indicate the following: (i) Sp1 proteins are able to bind to both Sp1 and KLF sites; (ii) the inhibitory effect of KLF4 involves equally the KLF or the Sp1 cis-elements, and thus may act by competing the binding of either KLF5 or Sp proteins on their respective preferential sites; and (ii) KLF5 is able to stimulate the Lama1 transcriptional activity via both regulatory elements.
Fig.6. Effects of the overexpression of Sp and KLF proteins on the transcriptional activity of the Lama1 promoter.
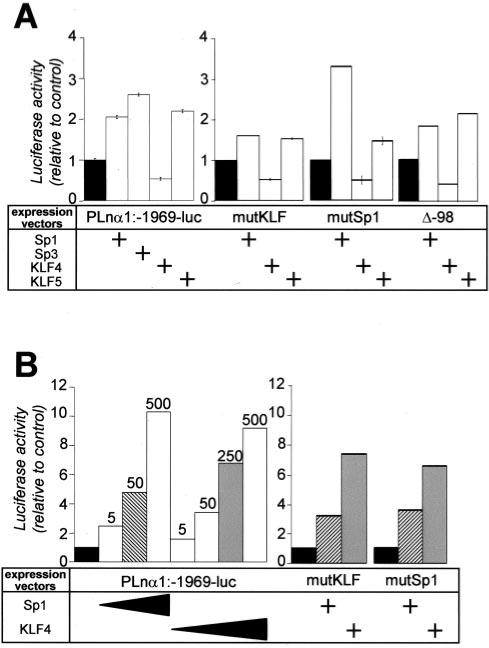
Experimental conditions of the co-transfections of Caco2-TC7 cells (A) and of Drosophila S2 cells (B) with different promoter constructs (PLnα1, mut KLF, mut Sp1, Δ-98) and with expression vectors are indicated below. The columns represent the luciferase activity (mean of at least 3 different experiments ± S.E.) in a given experimental condition relative to that found without transcription factor expression vector (black columns, considered as 100%). The concentrations of the expression vectors encoding the transcription factors used in these experiments were 500 ng in Caco2-TC7 cells (A) or 5−500 ng (5, 50, 250, and 500 ng) in Drosophila cells (left part of B); the concentrations of Sp1 and KLF4 were 50 (hatched columns) and 250 ng (gray columns), respectively, in the co-transfection experiments with the mutated promoters (right part of B).
We then analyzed the effect of Sp1 proteins and KLF4 factors on the Lama1 promoter activity in cells that do not express endogenous Sp1 factors, the Drosophila S2 cells (41). Co-transfection of the intact Lama1 promoter with the Sp1 expression vector led to an increased activity of the promoter according to a dose-dependent manner (Fig. 6B); under these conditions the stimulation with the highest dose tested (500 ng) was significantly higher than that observed in Caco2-TC7 cells (10-versus 2-fold increase). Interestingly, in Drosophila cells, exogenous expression of KLF4 also increased the transcriptional activity of the promoter in a dose-dependent manner (Fig. 6B). The effects of the two expression vectors were also analyzed with the mutated KLF or Sp1 promoter. The results (Fig. 6B) show the following: (i) the activation of the promoter by Sp1 factors was only slightly affected when either the Sp1 or KLF sites were mutated compared with the PLnα1 expression vector, and (ii) the stimulation of the promoter by KLF4 factor was maintained when the KLF or Sp1 site was mutated. These observations confirm that both Sp1 and KLF factors are able to bind both Sp1 and KLF4 sites of the Lama1 promoter and indicate that these factors modulate the promoter activity differentially according to the cellular context.
Finally, in an attempt to understand why the transcriptional activity of the Lama1 promoter was lower in the intestinal mesenchymal C20 cells (Fig. 2), we used different approaches (Fig. 7). Despite the low transcriptional activity of the promoter in C20 cells, the various promoter deletions resulted in the same effects than those observed in Caco2-TC7 cells (Fig. 7A compared with Fig. 3A). Yet no significant modulation of the promoter activity was observed with either the Sp1, Sp3, KLF4, or KLF5 expression vector (not illustrated). Western blot analysis revealed that the C20 cells synthesize Sp1, Sp3, and KLF factors (Fig. 7B) at amounts rather similar to those found in Caco2-TC7 cells (Fig. 5A). Interestingly, EMSA experiments show that Sp1 binding to Sp1 or KLF probe (complex I) was weak (Fig. 7C, lanes 2 and 4) compared with that found in epithelial cells (Fig. 7C, lanes 1 and 3). Altogether, these experiments indicate that the difference in the transcriptional activity of the Lama1 promoter between the intestinal epithelial (Caco2-TC7) and mesenchymal (C20) cells could be due either to transcription factor(s) that could prevent the binding of Sp1 factors to the Sp1 site or to the lack of co-activators in C20 cells.
Fig.7. Lama1 promoter activity and transcription factors expressed in the intestinal mesenchymal C20 cells.
A, transcriptional activity of the deleted constructs of the Lama1 promoter in C20 cells (for further details see legend to Fig. 3). B, expression of Sp1, Sp3, KLF4 and KLF5 factors by C20 cells determined by Western blot (for further details see legend to Fig. 5). C, comparative EMSA experiments using the labeled Sp1 (lanes 1 and 2) or KLF (lanes 3 and 4) probe with Caco2-TC7 (lanes 1 and 3) or C20 (lanes 2 and 4) cell extracts. *, non-identified band.
Glucocorticoids Enhance the Transcriptional Activity of the Lama1 Promoter
The Lama1 promoter carries a GRE comprising 16 nucleotides among which only two nucleotides are different from the proposed consensus sequence found on MatInspector software. The analysis of the potential effect of glucocorticoids on the regulation of the Lama1 promoter was undertaken because in earlier experiments we observed the following: (i) a precocious deposition of laminin α1 chain at the epithelial-mesenchymal interface in intestinal endoderm-fibro-blast co-cultures under the influence of DX, and (ii) the organization of the BM was prerequisite for endodermal differentiation (23).
In a first step, we showed by RT-PCR, that Caco2-TC7 cells express glucocorticoid receptor transcripts like the fetal intestine and liver and like the PYS cells (Fig. 8A). We could also show by Northern blot that the treatment of Caco2-TC7 cells by DX for 4 and 6 days resulted in about a 3-fold increase in the level of the α1 chain mRNA (Fig. 8B). Such an effect seems to be tissue-specific, as the level of the α1 transcripts from PYS cells was not modified by DX (not shown). Yet, when Caco2-TC7 cells were treated by DX, we observed only a faint stimulation of the Lama1 promoter transcriptional activity (1.5-fold; not shown).
Fig.8. DX stimulates laminin α1 gene expression in Caco2-TC7 cells.
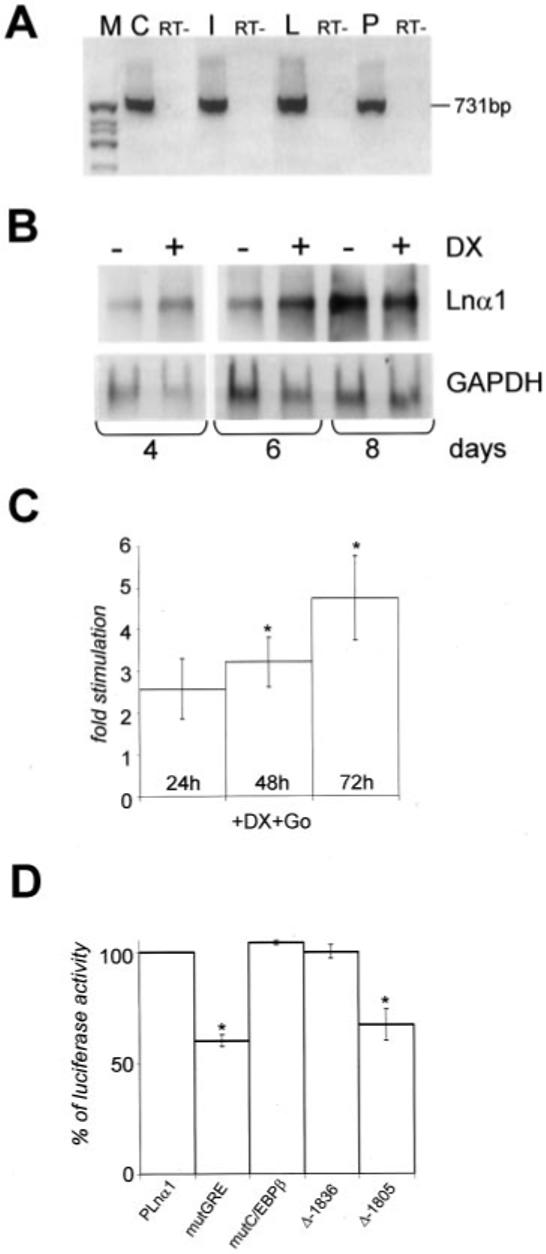
A, RT-PCR analysis of the glucocorticoid receptors in Caco2-TC7 cells (C) compared with fetal intestine (I), liver (L), and PYS cells (P). The primers used recognize both the human and mouse sequences; the PCR product has the expected size (731 bp), and its nature has been confirmed by sequencing. Lanes (RT–) indicate that reverse transcriptase has been omitted. M, size markers. B, representative Northern blot analysis of the laminin α1 (LNα1) chain mRNA in Caco2-TC7 cells cultured without (−) or with (+) DX for 4, 6, and 8 days. Fluorescent quantification of the α1 mRNA relative to GAPDH mRNA shows a 3.5-fold stimulation by DX at 4 and 6 days but no effect at 8 days of culture. C, stimulation of the transcriptional activity of the Lama1 promoter by DX: Caco2-TC7 cells, transfected with the full-length promoter/luciferase (pLnα1) and the glucocorticoid receptor (Go) vectors, have been treated with DX for 24, 48, and 72 h. The columns represent the level of the stimulation induced by DX compared with the corresponding untreated cultures. *, p ≤ 0.005. D, effects of mutations and deletions of the promoter on the stimulation by DX. Caco2-TC7 cells, transfected with various mutated or deleted constructs of the Lama1 promoter, have been cultured for 72 h in the presence of DX and Go. The luciferase activity has been compared with the DX-stimulated value recorded in the cells transfected with the full-length promoter (PLnα1) at 72 h, considered as 100%. *, p ≤ 0.005.
This led us in a second step to transfect the cells with a glucocorticoid receptor expression vector (Go) concomitantly with the PLnα1 promoter construct before DX treatment (42). In this experimental condition, the 2-kb Lama1/luciferase construct was stimulated by DX in a time-dependent manner from 2.5-fold after a 24-h treatment to nearly 5-fold after 3 days (Fig. 8C). To define the involvement of the GRE in the activation of the laminin α1 chain gene by DX, we compared the DX-induced stimulation in the full-length promoter to that occurring after point mutation of the GRE. The GRE mutation led to a partial (40%) inhibition of the DX-stimulated activity (Fig. 8D). We then analyzed the potential involvement of the C/EBPβ site, which has been described to participate to the glucocorticoid response (43). For this purpose, we used the mut C/EBPβ, the Δ-1836 (deleted C/EBPβ site), and the Δ-1805 (deleted GRE and C/EBPβ sites) promoter constructs. The level of the DX-stimulated transcriptional activity was unchanged for the mut C/EBPβ and Δ-1836 constructs, whereas it decreased by 30% for the Δ-1805 construct when compared with the stimulation recorded with the full-length promoter (Fig. 8D). More proximal deletions did not further abolish the DX-induced stimulation of the promoter activity, enabling us to define other promoter regions involved in the stimulation of the laminin α1 gene regulatory sequences (not shown). These results indicate that only part of the effect of DX was due to a direct transcriptional activation of the promoter.
DISCUSSION
The present work represents the first characterization of the proximal region of the murine Lama1 promoter encoding the laminin α1 chain, and determination of transcription factors that could be involved in its regulation. The cloning and sequence analysis of a 2-kb region upstream from the transcription start site revealed a number of potential regulatory elements, some of which were conserved in the human LAMA1 promoter. The basal transcription of the Lama1 gene has been found to be essentially dependent on a proximal Sp1-binding site, which could act in concert with a KLF-binding element. Interestingly, KLF4 and KLF5 (formerly named GKLF and IKLF), both being expressed in the intestinal epithelium, display opposing effects on the Lama1 promoter activity. Finally, we showed that dexamethasone, a synthetic glucocorticoid, stimulates the transcription of the Lama1 gene.
The Lama1 gene, like other laminin genes (9, 44, 45), is a TATA box-less gene. The combined study of progressive deletions and of individual site mutations of the 2-kb promoter pointed to the major role of an Sp1-binding element (located at position −73 bp from the translation start site) in the basal transcriptional activity. Indeed deletion or mutation of this site led to a loss of ∼90% of the 2-kb promoter activity. Based on complementary EMSA, supershift, and expression experiments, we can argue that Sp1 proteins are important for the basal transcription of Lama1. This is in good agreement with the fact that these zinc finger transcription factors are of particular importance in TATA box-less promoters (45, 46). In addition, Sp1 factors have already been reported to be involved in the basal or stimulated transcription of genes encoding extracellular matrix molecules like collagen (47) and laminin genes, in particular Lamc1 encoding the γ1 chain (44).
We also found that a KLF-binding site, located 24 bp upstream of the Sp1 site, also plays an important role in the basal transcription of the Lama1; indeed, the mutation of the KLF4 site decreased the 2-kb promoter activity by two-thirds. Expression of KLF4 or KLF5 proteins in intestinal epithelial cells led to opposing effects on the Lama1 promoter. In addition, we observed some interactions or cooperation between members of the Krüppel-like factor family (Sp1 and KLF 4/5) possibly at both the Sp1 and KLF sites. Concerning the role of the Krüppel-like factors in the regulation of the Lama1 gene, several aspects are of particular interest.
First, another laminin gene, laminin α3A chain gene, is regulated by KLF4 (11). In this case, two binding sites for KLF4 are required for expression of the reporter gene driven by the LAMA3 promoter. Furthermore, the decrease of laminin α3A expression in breast cancer cells compared with normal tissue could be correlated to a decreased KLF4 activity. Recently, it has also been demonstrated that KLF4 factors bind to a bcn-1 element in the laminin γ1 chain gene (Lamc1) promoter and activate the promoter in mesangial and HeLa cells (48).
Second, the two KLF factors, KLF4 and KLF5, have been found to be expressed in the intestinal epithelium with a restricted and complementary pattern. KLF4 is expressed in the post-mitotic cells lining the villi in the small intestine and in the middle to upper gland region in the colon (38, 40, 49, 50). At the opposite, KLF5 is expressed in the proliferative cell compartment of the adult gut epithelium (38, 51). It is worth noting that the differential expression of the two Krüppel factors correlates very well the effects of KLF/Lama1 promoter cotransfection experiments, positive action of KLF5 and negative action of KLF4, with the restriction of the laminin α1 chain expression in the intestinal proliferative cell compartment (20, 21).
Although the major phenotype in KLF4-deficient mice concerns the barrier function of the surface epithelial cells in the skin, the absence of KLF4 in knockout mice results in an altered differentiation of goblet cells in the colon (52, 53). On the other hand, KLF5-deficient mice display abnormally shaped villi and a reduction in the number of mesenchymal cells and in the amount of extracellular matrix in their gastro-intestinal tract (54); these authors showed that KLF5 activates platelet-derived growth factor-A and transforming growth factor-β1, and secondarily type IV collagen. Thus one may speculate that BM molecules and in particular the laminin α1 chain gene could be a physiologically relevant target of the KLF transcription factors.
Third, the opposing transcriptional effects of the KLF factors on different genes or on a given gene have been described in various studies (38, 39, 55) to result from a competition or a cooperation with Sp1 factors. Accordingly, KLF4 suppresses promoter activity of one of the cytochrome P450 genes, CYP1A1, and of cyclin D1 (38) most likely by a competition with Sp1, which activates the same promoters. As KLF4 still displays its inhibitory effect on the shortest Lama1 promoter construct comprising only the Sp1 site, one can postulate that a similar competition could be involved in the down-regulation of the Lama1 gene in the adult differentiated villus intestinal cells that express KLF4. In contrast, KLF4 can also act as an activator of transcription in conjunction with other Krüppel-like factors including Sp1 (38). Precisely, a cooperation of KLF4 with Sp1 has been shown to be essential for keratin 19 (56) and envoplakin (57) transcription. Similarly, Higaki et al. (48) nicely demonstrated a synergistic activation of the rat laminin γ1 chain promoter by KLF4 and Sp1 proteins in Drosophila cells which do not express Sp1. We also show here that these two factors stimulate the Lama1 promoter in Drosophila cells. However, in intestinal epithelial cells, KLF5 instead of KLF4 acts positively on the Lama1 promoter activity. Altogether these observations emphasize the functional interaction of ubiquitous and tissue-restricted transcription factors, which could also explain tissue-specific regulations for ubiquitously expressed genes like laminins.
Linked to the fact that extracellular matrix proteins, and BM molecules in particular, play instrumental roles in tissue homeostasis, the study of the regulation of their gene expression has been of particular interest. As far as laminins are concerned, various isoforms have been shown to be transcriptionally regulated by factors involved in differentiation, proliferation, migration, or inflammation like retinoic acid, transforming growth factor-β1, hepatocyte growth factor, inter-leukin 1β, and by the β-catenin and Akt/protein kinase B signaling pathways. These studies, performed at the promoter level, concern mainly five laminin genes encoding the α3, β1, β2, γ1, and γ2 chains (9–17).
Laminin α1 transcripts or proteins are increased by dexamethasone, all-trans-retinoic acid, and by the activation of Akt/protein kinase B (15, 23, 58). Here we tested the effect of DX on the promoter activity and observed a 2−5-fold stimulation of the basal transcriptional activity depending on the culture time. However, this stimulation was only partially decreased by mutating the GRE in the 2-kb promoter. We hypothesized that a combined involvement of GRE- and C/EBP-binding sites could occur in the DX-stimulated Lama1 promoter activity. Indeed, C/EBPβ as well as C/EBPδ expression and binding have been shown to be rapidly induced by GC and to be involved in the responsiveness to GC in the IEC-6 intestinal epithelial cell line (43). In addition, interactions between C/EBP proteins and glucocorticoid receptors are involved in the transcriptional effect induced by steroids (59). However, mutation or deletion of the C/EBPβ site did not allow us to demonstrate such an interaction for the DX-induced transcriptional activation of Lama1. As the maximal DX-stimulation effect is observed at 72 h, one can postulate that DX acts indirectly on other genes whose action in turn may activate the laminin α1 chain gene. Alternatively, GC could act through a DNA-binding independent mechanism as it has been described for cell survival (60, 61).
In conclusion, this study provides the first data concerning the transcriptional regulation of the murine Lama1 gene. The main findings arising from this work are as follows: (i) ubiquitous Sp1 factors that bind an Sp1 site and tissue-specific KLF factors that bind a KLF site act in concert on the transcriptional regulation of Lama1; (ii) the two Krüppel-like factors expressed in the gut display inverse effects on the Lama1 promoter activity, in accordance with their respective complementary expression pattern and with the expression of laminin α1 chain in the adult gut. Together with the results obtained formerly in stably transfected cell lines (overexpression or antisense experiments) and in co-culture systems, one can postulate that, in the gut, laminin-1 plays an important physiological role in the transition from the proliferative to differentiation status. Precise indications on the function of laminin α1 chain in this organ in vivo will require analysis of conditionally targeted Lama1 knockout mice.
Acknowledgments
We thank Natacha Turck, Jeanne Stutzmann, Claire Domon-Dell, and Patrick Gendry (U. 381 INSERM) for helpful technical advice and discussions, and Léonor Mathern for help in the preparation of the manuscript and illustrations. We also greatly acknowledge Dr. Chi-Chuan Tseng (Boston Veterans Affairs Medical Center and Boston University School of Medicine, Boston) for anti-KLF4 antibody; Dr. Robert Tjian (Howard Hughes Medical Institute and Department of Molecular and Cell Biology, University of California, Berkeley) for pPAC SP1 and pPAC SP3 plasmids; Dr. Karol Bomsztyk (Department of Medicine, University of Washington, Seattle) for the pPAC GKLF plasmid and Dr. Monique Rousset (INSERM U505, Centre de Recherche des Cordeliers, Paris, France) for providing us the Caco2-TC7 cell line.
Footnotes
This work was supported in part by grants from INSERM, the Research Ministry (ACI Developmental Biology and Physiopathology 172), and the Ligue Contre le Cancer, Comité Départemental du Haut-Rhin.
The nucleotide sequence(s) reported in this paper has been submitted to the GenBank™/EBI Data Bank with accession number(s) AJ519495.
The abbreviations used are: BMs, basement membranes; DIG, digoxigenin; DTT, dithiothreitol; DX, dexamethasone; EMSA, electrophoretic mobility shift assay; FITC, fluorescein isothiocyanate; FCS, fetal calf serum; GAPDH, glyceraldehyde-3-phosphate dehydrogenase; GC, glucocorticoids; GRE, glucocorticoid-response element; KLF, Krüppel-like factor; LN, laminin; PYS, parietal yolk sac; RT, reverse transcriptase; TDA, target detection assay; CMV, cytomegalovirus.
REFERENCES
- 1.Colognato H, Yurchenco PD. Dev. Dyn. 2000;218:213–234. doi: 10.1002/(SICI)1097-0177(200006)218:2<213::AID-DVDY1>3.0.CO;2-R. [DOI] [PubMed] [Google Scholar]
- 2.Tunggal P, Smyth N, Paulsson M, Ott MC. Microsc. Res. Tech. 2000;51:214–227. doi: 10.1002/1097-0029(20001101)51:3<214::AID-JEMT2>3.0.CO;2-J. [DOI] [PubMed] [Google Scholar]
- 3.Simon-Assmann P, Bolcato-Bellemin AL, Turck N, Piccinni S, Olsen J, Launay JF, Lefebvre O, Kedinger M. In: Disease Progression and Carcinogenesis in the Gastrointestinal Tract. Galle PR, Gerken G, Schmidt WE, Wiedenmann B, editors. Kluwer Academic Publishers; London, UK: 2003. pp. 223–239. [Google Scholar]
- 4.Timpl R, Rohde H, Robey PG, Rennard SI, Foidart JM, Martin GR. J. Biol. Chem. 1979;254:9933–9937. [PubMed] [Google Scholar]
- 5.Shim C, Kwon HB, Kim K. Mol. Reprod. Dev. 1996;44:44–55. doi: 10.1002/(SICI)1098-2795(199605)44:1<44::AID-MRD5>3.0.CO;2-T. [DOI] [PubMed] [Google Scholar]
- 6.Yurchenco PD, Quan Y, Colognato H, Mathus T, Harrison D, Yamada Y, O'Rear JJ. Proc. Natl. Acad. Sci. U. S. A. 1997;94:10189–10194. doi: 10.1073/pnas.94.19.10189. [DOI] [PMC free article] [PubMed] [Google Scholar]
- 7.Li S, Harrison D, Carbonetto S, Fassler R, Smyth N, Edgar D, Yurchenco PD. J. Cell Biol. 2002;157:1279–1290. doi: 10.1083/jcb.200203073. [DOI] [PMC free article] [PubMed] [Google Scholar]
- 8.Gustafsson E, Fassler R. Exp. Cell Res. 2000;261:52–68. doi: 10.1006/excr.2000.5042. [DOI] [PubMed] [Google Scholar]
- 9.Aberdam D, Virolle T, Simon-Assmann P. Microsc. Res. Tech. 2000;51:228–237. doi: 10.1002/1097-0029(20001101)51:3<228::AID-JEMT3>3.0.CO;2-9. [DOI] [PubMed] [Google Scholar]
- 10.Hlubek F, Jung A, Kotzor N, Kirchner T, Brabletz T. Cancer Res. 2001;61:8089–8093. [PubMed] [Google Scholar]
- 11.Miller KA, Eklund EA, Peddinghaus ML, Cao Z, Fernandes N, Turk PW, Thimmapaya B, Weitzman SA. J. Biol. Chem. 2001;276:42863–42868. doi: 10.1074/jbc.M108130200. [DOI] [PubMed] [Google Scholar]
- 12.Sharif KA, Li C, Gudas LJ. Mech. Dev. 2001;103:13–25. doi: 10.1016/s0925-4773(01)00326-4. [DOI] [PubMed] [Google Scholar]
- 13.Kawata Y, Suzuki H, Higaki Y, Denisenko O, Schullery D, Abrass C, Bomsztyk K. J. Biol. Chem. 2002;277:11375–11384. doi: 10.1074/jbc.M111284200. [DOI] [PubMed] [Google Scholar]
- 14.Virolle T, Coraux C, Ferrigno O, Cailleteau L, Ortonne JP, Pognonec P, Aberdam D. Nucleic Acids Res. 2002;30:1789–1798. doi: 10.1093/nar/30.8.1789. [DOI] [PMC free article] [PubMed] [Google Scholar]
- 15.Ekblom P, Lonai P, Talts JF. Matrix Biol. 2003;22:35–47. doi: 10.1016/s0945-053x(03)00015-5. [DOI] [PubMed] [Google Scholar]
- 16.Nieto N, Cederbaum AI. J. Biol. Chem. 2003;278:15360–15372. doi: 10.1074/jbc.M206790200. [DOI] [PubMed] [Google Scholar]
- 17.Olsen J, Kirkeby LT, Brorsson MM, Dabelsteen S, Troelsen JT, Bordoy R, Fenger K, Larsson LI, Simon-Assmann P. Biochem. J. 2003;371:211–221. doi: 10.1042/BJ20021454. [DOI] [PMC free article] [PubMed] [Google Scholar]
- 18.Beaulieu JF. Prog. Histochem. Cytochem. 1997;31:1–78. doi: 10.1016/s0079-6336(97)80001-0. [DOI] [PubMed] [Google Scholar]
- 19.Kedinger M, Freund J-N, Launay JF, Simon-Assmann P. In: Development of the Gastrointestinal Tract. Sanderson IR, Walker WA, editors. B. C. Decker Inc.; Hamilton, Canada: 2000. pp. 83–102. [Google Scholar]
- 20.Simo P, Simon-Assmann P, Bouziges F, Leberquier C, Kedinger M, Ekblom P, Sorokin L. Development. 1991;112:477–487. doi: 10.1242/dev.112.2.477. [DOI] [PubMed] [Google Scholar]
- 21.Sasaki T, Giltay R, Talts U, Timpl R, Talts JF. Exp. Cell Res. 2002;275:185–199. doi: 10.1006/excr.2002.5499. [DOI] [PubMed] [Google Scholar]
- 22.Simo P, Bouziges F, Lissitzky JC, Sorokin L, Kedinger M, Simon-Assmann P. Gastroenterology. 1992;102:1835–1845. doi: 10.1016/0016-5085(92)90303-g. [DOI] [PubMed] [Google Scholar]
- 23.Simo P, Simon-Assmann P, Arnold C, Kedinger M. J. Cell Sci. 1992;101:161–171. doi: 10.1242/jcs.101.1.161. [DOI] [PubMed] [Google Scholar]
- 24.Henning SJ, Rubin DC, Shulman RJ. In: Physiology of the Gastrointestinal Tract. Johnson LR, editor. Raven Press, Ltd.; New York: 1994. pp. 571–610. [Google Scholar]
- 25.Basson MD, Modlin IM, Madri JA. J. Clin. Investig. 1992;90:15–23. doi: 10.1172/JCI115828. [DOI] [PMC free article] [PubMed] [Google Scholar]
- 26.De Arcangelis A, Neuville P, Boukamel R, Lefebvre O, Kedinger M, Simon-Assmann P. J. Cell Biol. 1996;133:417–430. doi: 10.1083/jcb.133.2.417. [DOI] [PMC free article] [PubMed] [Google Scholar]
- 27.Lorentz O, Duluc I, De Arcangelis A, Simon-Assmann P, Kedinger M, Freund J-N. J. Cell Biol. 1997;139:1553–1565. doi: 10.1083/jcb.139.6.1553. [DOI] [PMC free article] [PubMed] [Google Scholar]
- 28.Topley P, Jenkins DC, Jessup EA, Stables JN. Br. J. Cancer. 1993;67:953–958. doi: 10.1038/bjc.1993.176. [DOI] [PMC free article] [PubMed] [Google Scholar]
- 29.Kuratomi Y, Nomizu M, Nielsen PK, Tanaka K, Song SY, Kleinman HK, Yamada Y. Exp. Cell Res. 1999;249:386–395. doi: 10.1006/excr.1999.4497. [DOI] [PubMed] [Google Scholar]
- 30.De Arcangelis A, Lefebvre O, Méchine-Neuville A, Arnold C, Klein A, Rémy L, Kedinger M, Simon-Assmann P. Int. J. Cancer. 2001;94:44–53. doi: 10.1002/ijc.1444. [DOI] [PubMed] [Google Scholar]
- 31.Chantret I, Rodolosse A, Barbat A, Dussaulx E, Brot-Laroche E, Zweibaum A, Rousset M. J. Cell Sci. 1994;107:213–225. doi: 10.1242/jcs.107.1.213. [DOI] [PubMed] [Google Scholar]
- 32.Wewer UM, Tichy D, Damjanov A, Paulsson M, Damjanov I. Dev. Biol. 1987;121:397–407. doi: 10.1016/0012-1606(87)90176-x. [DOI] [PubMed] [Google Scholar]
- 33.Fritsch C, Orian-Rousseau V, Lefebvre O, Simon-Assmann P, Reimund JM, Duclos B, Kedinger M. Exp. Cell Res. 1999;248:391–406. doi: 10.1006/excr.1999.4414. [DOI] [PubMed] [Google Scholar]
- 34.Chao KM, Pearson WR, Miller W. Comput. Appl. Biosci. 1992;8:481–487. doi: 10.1093/bioinformatics/8.5.481. [DOI] [PubMed] [Google Scholar]
- 35.Cadoret A, Bertrand F, Baron-Delage S, Levy P, Courtois G, Gespach C, Capeau J, Cherqui G. Oncogene. 1997;14:1589–1600. doi: 10.1038/sj.onc.1200992. [DOI] [PubMed] [Google Scholar]
- 36.Hartl L, Oberbaumer I, Deutzmann R. Eur. J. Biochem. 1988;173:629–635. doi: 10.1111/j.1432-1033.1988.tb14045.x. [DOI] [PubMed] [Google Scholar]
- 37.Shields JM, Yang VW. Nucleic Acids Res. 1998;26:796–802. doi: 10.1093/nar/26.3.796. [DOI] [PMC free article] [PubMed] [Google Scholar]
- 38.Dang DT, Pevsner J, Yang VW. Int. J. Biochem. Cell Biol. 2000;32:1103–1121. doi: 10.1016/s1357-2725(00)00059-5. [DOI] [PMC free article] [PubMed] [Google Scholar]
- 39.Dang DT, Zhao W, Mahatan CS, Geiman DE, Yang VW. Nucleic Acids Res. 2002;30:2736–2741. doi: 10.1093/nar/gkf400. [DOI] [PMC free article] [PubMed] [Google Scholar]
- 40.Shie JL, Chen ZY, O'Brien MJ, Pestell RG, Lee ME, Tseng CC. Am. J. Physiol. 2000;5:G806–G814. doi: 10.1152/ajpgi.2000.279.4.G806. [DOI] [PubMed] [Google Scholar]
- 41.Du Q, Melnikova IN, Gardner PD. J. Biol. Chem. 1998;273:19877–19883. doi: 10.1074/jbc.273.31.19877. [DOI] [PubMed] [Google Scholar]
- 42.Li TWH, Wang J, Lam JT, Gutierrez EM, Solorzano-Vargus RS, Tsai HV, Martin MG. Am. J. Physiol. 1999;276:G1425–G1434. doi: 10.1152/ajpgi.1999.276.6.G1425. [DOI] [PubMed] [Google Scholar]
- 43.Gheorghiu I, Deschenes C, Blais M, Boudreau F, Rivard N, Asselin C. J. Biol. Chem. 2001;276:44331–44337. doi: 10.1074/jbc.M107591200. [DOI] [PubMed] [Google Scholar]
- 44.Liétard J, Musso O, Theret N, L'Helgoualc'h A, Campion JP, Yamada Y, Clement B. Am. J. Pathol. 1997;151:1663–1672. [PMC free article] [PubMed] [Google Scholar]
- 45.O'Neill BC, Suzuki H, Loomis WP, Denisenko O, Bomsztyk K. Am. J. Physiol. 1997;273:F411–F420. doi: 10.1152/ajprenal.1997.273.3.F411. [DOI] [PubMed] [Google Scholar]
- 46.Briggs MR, Kadonaga JT, Bell SP, Tjian R. Science. 1986;234:47–52. doi: 10.1126/science.3529394. [DOI] [PubMed] [Google Scholar]
- 47.Verrecchia F, Rossert J, Mauviel A. J. Investig. Dermatol. 2001;116:755–763. doi: 10.1046/j.1523-1747.2001.01326.x. [DOI] [PubMed] [Google Scholar]
- 48.Higaki Y, Schullery D, Kawata Y, Shnyreva M, Abrass C, Bomsztyk K. Nucleic Acids Res. 2002;30:2270–2279. doi: 10.1093/nar/30.11.2270. [DOI] [PMC free article] [PubMed] [Google Scholar]
- 49.Shields JM, Christy RJ, Yang VW. J. Biol. Chem. 1996;271:20009–20017. doi: 10.1074/jbc.271.33.20009. [DOI] [PMC free article] [PubMed] [Google Scholar]
- 50.Brembeck FH, Moffett J, Wang TC, Rustgi AK. Gastroenterology. 2001;120:1720–1728. doi: 10.1053/gast.2001.24846. [DOI] [PubMed] [Google Scholar]
- 51.Conkright MD, Wani MA, Anderson KP, Lingrel JB. Nucleic Acids Res. 1999;27:1263–1270. doi: 10.1093/nar/27.5.1263. [DOI] [PMC free article] [PubMed] [Google Scholar]
- 52.Segre JA, Bauer C, Fuchs E. Nat. Genet. 1999;22:356–360. doi: 10.1038/11926. [DOI] [PubMed] [Google Scholar]
- 53.Katz JP, Perreault N, Goldstein BG, Lee CS, Labosky PA, Yang VW, Kaestner KH. Development. 2002;129:2619–2628. doi: 10.1242/dev.129.11.2619. [DOI] [PMC free article] [PubMed] [Google Scholar]
- 54.Shindo T, Manabe I, Fukushima Y, Tobe K, Aizawa K, Miyamoto S, Kawai-Kowase K, Moriyama N, Imai Y, Kawakami H, Nishimatsu H, Ishikawa T, Suzuki T, Morita H, Maemura K, Sata M, Hirata Y, Komukai M, Kagechika H, Kadowaki T, Kurabayashi M, Nagai R. Nat. Med. 2002;8:856–863. doi: 10.1038/nm738. [DOI] [PubMed] [Google Scholar]
- 55.Philipsen S, Suske G. Nucleic Acids Res. 1999;27:2991–3000. doi: 10.1093/nar/27.15.2991. [DOI] [PMC free article] [PubMed] [Google Scholar]
- 56.Brembeck FH, Rustgi AK. J. Biol. Chem. 2000;275:28230–28239. doi: 10.1074/jbc.M004013200. [DOI] [PubMed] [Google Scholar]
- 57.Maatta A, Ruhrberg C, Watt FM. J. Biol. Chem. 2000;275:19857–19865. doi: 10.1074/jbc.M001028200. [DOI] [PubMed] [Google Scholar]
- 58.Plateroti M, Freund J-N, Leberquier C, Kedinger M. J. Cell Sci. 1997;110:1227–1238. doi: 10.1242/jcs.110.10.1227. [DOI] [PubMed] [Google Scholar]
- 59.Ramos RA, Meilandt WJ, Wang EC, Firestone GL. FASEB J. 1999;13:169–180. doi: 10.1096/fasebj.13.1.169. [DOI] [PubMed] [Google Scholar]
- 60.Reichardt HM, Kaestner KH, Tuckermann J, Kretz O, Wessely O, Bock R, Gass P, Schmid W, Herrlich P, Angel P, Schutz G. Cell. 1998;93:531–541. doi: 10.1016/s0092-8674(00)81183-6. [DOI] [PubMed] [Google Scholar]
- 61.Gottlicher M, Heck S, Herrlich P. J. Mol. Med. 1998;76:480–489. doi: 10.1007/s001090050242. [DOI] [PubMed] [Google Scholar]