Abstract
Study Objectives:
The respiratory related evoked potential (RREP) has been previously recorded in children and adults during wakefulness and in adults during sleep. However, there have been no data on RREP during sleep in children. We thus examined children during sleep to determine whether early RREP components would be maintained during all sleep
Design and Participants:
Twelve healthy, nonsnoring children, aged 5–12 years, screened by polysomnography and found to have no sleep disorders were assessed during stage 2 sleep, slow wave sleep, and REM sleep. Brief occlusions were presented via an occlusion valve at the inspiratory port of a non-rebreathing valve as interruptions of inspiration. EEG responses were averaged and assessed for the presence of early and late RREP components.
Results:
Robust early components were seen in the majority of subjects in all sleep stages. Late components were also present, although with some apparent differences compared to those previously reported in adults (using the same recording protocol and an almost identical method of stimulus presentation). Specifically, N350 and N550 were less readily differentiated as separate components, and the N550 did not display the clear anterior-posterior amplitude gradient that is ubiquitous in adults.
Conclusion:
Cortical processing of respiratory-related information persists throughout sleep in children. The pattern of activation in the late components appear to reflect differences in the structure of the developing brain prior to the process of dendritic pruning associated with adolescence.
Citation:
Melendres MC; Marcus CL; Abi-Raad RF; Trescher WH; Lutz JM; Colrain IM. Respiratory-related evoked potentials during sleep in children. SLEEP 2008;31(1):55-61.
Keywords: RREP, N350, N550, REM
INTRODUCTION
THE APPLICATION OF BRIEF RESISTIVE LOADS OR OCCLUSIONS TO INSPIRATION STIMULATES PRESSURE RECEPTORS AND MECHANORECEPTORS THROUGHOUT the airways. These then produce an afferent volley within the peripheral nervous system that leads to a series of identifiable cortical responses subserving conscious sensation and perception of the events. The cortical activation can be measured with surface EEG response as the respiratory-related evoked potential (RREP).1 The RREP has a series of obligatory peaks. During wakefulness, the earliest peaks are a positive component occurring approximately 50–80 ms post-stimulus (P1),1 and a negative peak in the same latency range, seen most prominently over frontal scalp (Nf).2 The two components are thought to reflect the initial processing load-related information by the sensory cortex and supplementary motor cortex3 respectively.
The RREP persists into sleep in adults. In NREM sleep, it contains the P1 and Nf components,4 and a series of large sleep-specific but stimulus modality independent later components. These are the P2 (a positive peak at around 200 ms), the N350 and N550 (negative peaks at around 350 and 550 ms respectively), and the P900 (a positive peak at around 900 ms).4–10 Data from REM sleep have only been reported in abstract form11: they are consistent with the few studies of auditory evoked potentials (AEP) during sleep in showing a response similar to that of NREM sleep but without a prominent N550.12,13 While RREP data collected during wakefulness have been reported from children,2,14 there have been no RREP or AEP studies conducted during sleep in children.
The early P1 and Nf components have proved difficult to reliably measure during NREM sleep in adults due to the small signal to noise ratio (SNR) associated with measuring small components in the context of background EEG, which can be an order of magnitude larger. Both EEG and breathing during sleep are remarkably different in children compared to adults.15 The amplitude of sleep EEG is larger in children, but they also have augmented neuromotor activation of the upper airway during sleep.16 We thus examined children during sleep to determine whether early RREP components would be maintained during all sleep stages.
Prior to adolescence, children display more delta frequency activity of higher amplitude, and with a broader scalp distribution, than that seen in adults. The decrease in incidence and amplitude of delta waves, together with the development of a frontal scalp distribution associated with adolescence,17–19 have been hypothesized to reflect the caudal to rostral process of dendritic pruning seen in the developing brain over this timeframe.20 This process has been described as “frontalization.” We thus hypothesized that the N550 RREP component (which falls within the delta frequency band21) would show a less “frontalized” scalp distribution pattern than that seen in adults.
METHODS
Subjects
Twelve healthy, nonsnoring children (4 girls), aged 5–12 (mean 9.7 + 1.2) years, were recruited from the general population. The lower age limit was chosen to exclude children too young to cooperate with the testing apparatus. The upper age limit was chosen to exclude children in mid to late puberty.22 A history and physical examination were performed. Children who had significant medical or neurologic conditions or who were on any medications which could affect their level of consciousness were excluded. The subjects underwent baseline polysomnography to rule out sleep disordered breathing. On a separate night, a second polysomnograph was done and RREPs were measured.
EEG Measurement
EEG electrodes were placed at Fz, Cz, Pz, C3, C4, A1, and A2, with a separate ground electrode. Impedance levels were maintained at less than 3 kOhms. The electrodes were connected to a Neuroscan Synamp Amplifier (Compumedics, El Paso, TX) and EEG activity was recorded continuously using Neuroscan Scan 4 software (Compumedics, El Paso, TX). C3/A2 and C4/A1 derivations were recorded in parallel on an Alice 3 (Healthdyne, Marietta, GA) computerized PSG system, together with left and right electrooculogram and submental electromyogram (EMG) for sleep staging, which was conducted off line according to Rechtschaffen and Kales criteria.23
RREP Assessment
The subjects breathed through a full face mask. The mask was attached to an inspiratory occlusion balloon valve (Hans Rudolph, Inc., Kansas City, MO). The valve was then connected to a continuous positive airway pressure machine. A bias flow with a pressure of 2 cm H2O was provided to account for the resistance within the circuit and to wash out CO2 within the mask. The assembly was attached to a suspending cable. A controller for actuating the inspiratory occlusion valve was programmed to deliver a 400 msec occlusion. Flow was measured using a pneumotachometer (Hans Rudolph, Inc., Kansas City, MO) with a differential pressure transducer (ADInstruments, Colorado Springs, CO) connected to the full face mask. Pressure within the mask was measured using a pressure transducer with a demodulator (Validyne Engineering Corp., Northridge, CA).
Multiple inspiratory occlusions were each performed during stage 2 sleep, slow wave sleep (SWS), and REM sleep. Each occlusion was separated by at least 2 unoccluded breaths. EEG data was band pass filtered (0.3-30 Hz) and investigated between 500 ms before and 1500 ms after onset of each occlusion. Artifact free responses were averaged to produce RREPs in each sleep stage with peaks determined as per previous sleep studies in adults.4–10 P1 was measured at C3 and C4 following digital re-referencing to Cz. Nf was measured at Fz referenced to A1+A2. Due to the superimposition of the fast components onto ongoing sleep EEG activity, pre-stimulus baseline values varied substantially, introducing error into estimates of baseline-peak amplitudes. Thus P1 and Nf amplitudes were measured relative to the preceding opposite polarity deflections. P1 was defined as the most positive and Nf as the most negative values between 50 and 100 ms, respectively. The later components were all measured from Fz, Cz, and Pz referenced to A1+A2, with amplitudes assessed relative to the average of the pre-stimulus baseline. P2 was the most positive value between 100 and 300 ms, and N350 and N550 were the most negative values between 200 and 350 ms and 350 and 700 ms, respectively. P900 was the most positive value between 700 and 1100 ms.
Statistical Analysis
P1 and Nf were assessed for sleep stage (REM, stage 2, SWS) using a one-way repeated measures ANOVA. Where available from both C3-Cz and C4-Cz derivations, the average value of P1 was entered into the analysis. P2, N350, N550, and P900 were assessed for sleep stage (REM, stage 2, SWS) and scalp topography (Fz, Cz, Pz) with a two-way repeated measures ANOVA. Differences between sleep stages were further compared with repeated measures planned contrasts comparing stage 2 to SWS and stage 2 to REM. The scalp topography factor was tested for sphericity with Mauchly's test, and where significant, Greenhouse-Geisser corrections were applied to the degrees of freedom used in the analysis, and probabilities reported accordingly.
To ensure that any sleep state difference in RREP components were not the result of difference in the stimulus intensity, peak mask pressure from the averaged occlusions in each state were assessed using a single factor repeated measure ANOVA. This revealed no differences (P = 0.3).
RESULTS
Data were collected from all 12 subjects in stage 2 and SWS and 11 subjects in REM. Between 154 and 242 responses were available for averaging in stage 2 (mean of 186.7 ± 25), between 81 and 272 in SWS (mean of 183.9 ± 49), and between 65 and 351 in REM (mean of 159.5 ± 75). The REM data had a P1 component as clearly identifiable in 10 subjects at both C3 and C4, with the 11th showing the component in C4 only. Nf was seen in all 11 subjects. The stage 2 data had P1 in either C3 or C4 in all 12 subjects, and in both leads in 9 subjects. Nf was seen in 11 of the 12. In SWS, it was seen in both C3 and C4 in 10 subjects, but was absent in the remaining 2. Nf was again seen in 11 of the 12.
Stimulus Intensity
The magnitude of the pressure change elicited by occlusions did not vary as a function of diagnosis or sleep stage. The pressure differences were 2.3 ± 0.94 cm H2O for stage 2; 2.3 ± 1.04 cm H2O for SWS; and 2.1 ± 0.62 cm H2O for REM sleep. The rise times of the stimuli were also not affected by sleep stage, and were 38.4 ± 10.8 ms for SWS; 38.3 ± 12.5 ms for stage 2; and 39.1 ±12.8 ms for REM.
Early Components: P1 and Nf
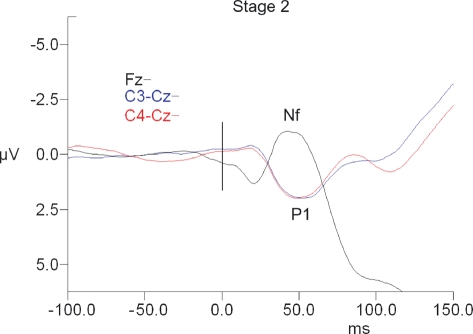
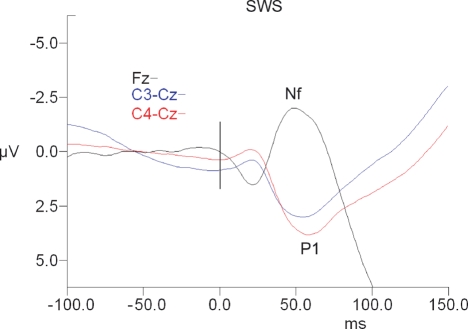
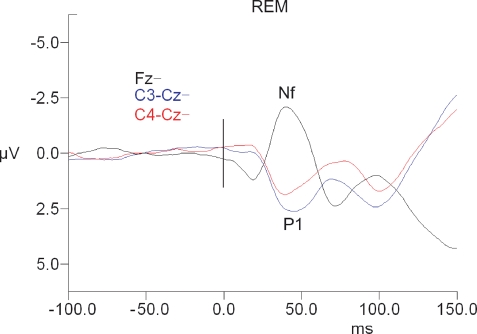
There was no significant main effect of sleep state for P1 or Nf amplitude or latency (see Table 1 and Figures 1–3).
Table 1.
Amplitude (μV) and Latency (ms) Values for the Early RREP Components in Slow Wave, Stage 2, and REM Sleep Stages
| SWS |
Stage 2 |
REM |
|||||
|---|---|---|---|---|---|---|---|
| Mean | SD | Mean | SD | Mean | SD | ||
| P1 amplitude | C3-Cz | 4.0 | 2.5 | 3.5 | 1.3 | 3.4 | 2.0 |
| C4-Cz | 4.6 | 2.5 | 2.5 | 1.8 | 3.2 | 1.5 | |
| P1 latency | C3-Cz | 55.1 | 9.0 | 55.6 | 9.9 | 62.7 | 20.5 |
| C4-Cz | 57.4 | 9.2 | 52.0 | 5.6 | 62.6 | 23.1 | |
| Nf amplitude | Fz | −4.6 | 3.0 | −3.9 | 2.1 | −4.3 | 2.3 |
| Nf latency | Cz | 50.1 | 7.5 | 45.6 | 8.4 | 45.7 | 13.9 |
Figure 1.
Short-latency RREP waveforms for Stage 2 sleep. Fz waveforms are referenced to linked ear leads. The vertical black bar indicates time of the commencement of mask pressure change in response to the occlusion.
Figure 2.
Short-latency RREP waveforms for slow wave sleep. Fz waveforms are referenced to linked ears. The vertical black bar indicates time of the commencement of mask pressure change in response to the occlusion.
Figure 3.
Short-latency RREP waveforms for REM sleep. Fz waveforms are referenced to linked ears. The vertical black bar indicates time of the commencement of mask pressure change in response to the occlusion.
Late Components:
P2
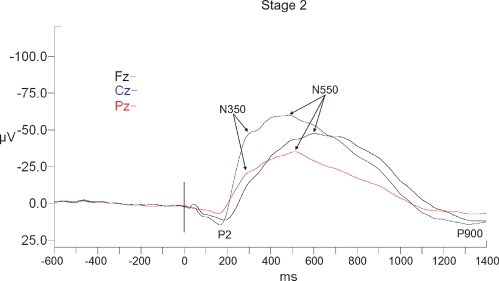
P2 was observed in all subjects in all 3 sleep stages. P2 amplitude displayed significant effects of sleep stage (F2,18 = 4.2, P < 0.05), of electrode site (F2,18 = 9.0, P < 0.01), and a stage x site interaction (F4,36 = 6.2, P < 0.05) (see Table 2 and Figures 4–6). Planned contrasts revealed that stage 2 values were similar to SWS values but significantly larger than REM values (F1,9 = 11.4, P < 0.01). Cz values were similar to those at Fz but significantly larger than those at Pz (F1,9 = 14.2, P < 0.01). The interaction effect reflected that the magnitude of the electrode site effect was smaller in REM than in stage 2 or SWS. P2 latency displayed significant effects of sleep stage (F2,18 = 3.9, P < 0.05) (see Table 3). Planned contrasts revealed that stage 2 values were similar to REM values but that SWS latencies were significantly longer (F1,9 = 22.3, P = 0.001).
Table 2.
Amplitude Values (μV) for the Late RREP Components in Slow Wave, Stage 2, and REM Sleep Stages
| SWS |
Stage 2 |
REM |
|||||
|---|---|---|---|---|---|---|---|
| Mean | SD | Mean | SD | Mean | SD | ||
| Fz | 12.7 | 10.6 | 13.1 | 8.6 | 4.5 | 1.67 | |
| P2 | Cz | 13.6 | 12.9 | 16.8 | 10.4 | 6.6 | 3.8 |
| α β γ | Pz | 5.0 | 11.9 | 8.6 | 6.3 | 5.3 | 2.5 |
| Fz | −36.6 | 27.9 | −42.4 | 33.4 | −18.4 | 10.3 | |
| N350 | Cz | −99.7 | 35.8 | −61.9 | 21.2 | −26.9 | 9.0 |
| δ ϵ θ | Pz | −64.0 | 28.6 | −32.5 | 24.2 | −9.1 | 8.3 |
| Fz | −61.7 | 34.0 | −56.8 | 35.3 | −15.1 | 9.8 | |
| N550 | Cz | −98.1 | 18.6 | −71.4 | 32.1 | −20.5 | 10.3 |
| σ τ | Pz | −67.2 | 22.4 | −41.7 | 21.9 | −13.4 | 11.0 |
| Fz | 26.6 | 24.9 | 7.3 | 23.0 | 3.1 | 5.2 | |
| P900 | Cz | 33.4 | 50.4 | 6.1 | 32.9 | −3.1 | 8.6 |
| ϕ | Pz | 24.5 | 35.1 | 3.9 | 18.7 | −2.9 | 10.1 |
α sleep stage effect at P < 0.05;
δ sleep stage effect at P < 0.001
β electrode site effect at P < 0.01;
ϵ electrode site effect at P < 0.001;
γ sleep stage x electrode site interaction at P < 0.05
θ sleep stage x electrode site interaction at P < 0.001
σ electrode site effect within stage 2 sleep at P < 0.001
ϕ sleep stage effect at Cz at P < 0.05
τ sleep stage effect at Cz at P < 0.001
Figure 4.
Long-latency RREP waveforms for Stage 2 sleep. All waveforms are referenced to linked ears. The vertical black bar indicates time of the commencement of ask pressure change in response to the occlusion.
Figure 5.
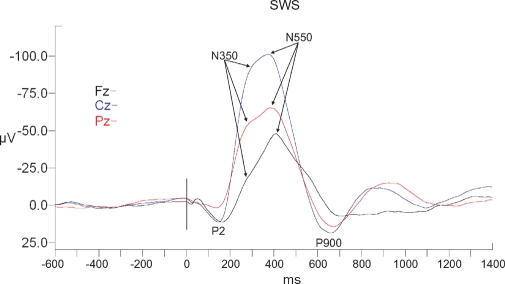
Long-latency RREP waveforms for slow wave sleep. All waveforms are referenced to linked ears. The vertical black bar indicates time of the commencement of mask pressure change in response to the occlusion.
Figure 6.
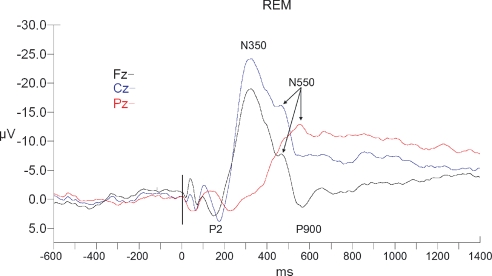
Long-latency RREP waveforms for REM sleep. All waveforms are referenced to linked ears. The vertical black bar indicates time of the commencement of mask pressure change in response to the occlusion.
Table 3.
Latency Values (ms) for the late RREP Components in Slow Wave, Stage 2, and REM Sleep Stages
| SWS |
Stage 2 |
REM |
|||||
|---|---|---|---|---|---|---|---|
| Mean | SD | Mean | SD | Mean | SD | ||
| Fz | 259.3 | 16.6 | 284.4 | 32.8 | 253.9 | 31.4 | |
| P2 | Cz | 246.9 | 18.0 | 260.6 | 31.0 | 274.2 | 35.2 |
| α | Pz | 234.0 | 34.1 | 248.3 | 31.6 | 270.7 | 941 |
| Fz | 424.2 | 61.2 | 493.2 | 98.9 | 389.6 | 47.6 | |
| N350 | Cz | 408.8 | 54.1 | 443.6 | 51.6 | 411.8 | 50.0 |
| γ | Pz | 405.4 | 59.2 | 431.1 | 101.7 | 421.2 | 113.6 |
| Fz | 542.8 | 72.1 | 650.8 | 128.7 | 522.0 | 68.4 | |
| N550 | Cz | 513.4 | 68.2 | 575.0 | 74.5 | 542.0 | 53.6 |
| Ψ | Pz | 517.4 | 68.0 | 586.0 | 98.5 | 594.1 | 106.4 |
| Fz | 868.6 | 185.0 | 1046.6 | 365.4 | 691.1 | 65.7 | |
| P900 | Cz | 798.3 | 178.5 | 1032.8 | 330.7 | 754.4 | 108.4 |
| ϕ | Pz | 818.3 | 176.0 | 941.8 | 295.0 | 828.1 | 220.4 |
α sleep stage effect at P < 0.05;
ϕ sleep stage effect at Cz at P < 0.05
Ψ electrode site effect within stage 2 sleep at P < 0.05
γ sleep stage x electrode site interaction at P < 0.05
N350
N350 was observed in all subjects in all 3 sleep stages. N350 amplitude displayed significant effects of sleep stage (F2,18 = 23.5, P < 0.001), of electrode site (F2,18 = 28.3, P < 0.001), and a stage x site interaction (F4,36 = 15.9, P < 0.001) (see Table 2 and Figures 4–6). Planned contrasts revealed that stage 2 values were significantly smaller than SWS values (F1,9 = 10.8, P < 0.01) and significantly larger than REM values (F1,9 = 21.7, P = 0.001). Cz values were significantly larger than those at Fz (F1,9 = 54.3, P < 0.01) and Pz (F1,9 = 50.5, P < 0.01). The interaction effect reflected that the magnitude of the electrode site effect was greater in SWS than stage 2, with the REM difference being even smaller. N350 latency displayed no effects of sleep state or electrode site; however, there was again a significant interaction effect, indicating that Fz had longer latencies than the other sites in SWS and stage 2, but shorter latencies in REM (see Table 3).
N550
N550 was present as a separate peak in all subjects in stage 2 sleep, but was only seen at all sites in 8 subjects in SWS and a different combination of 8 subjects in REM. Two separate analyses were thus conducted. Single factor ANOVA (Fz, Cz, Pz) was conducted within stage 2 to assess the effect of electrode site. A second single factor ANOVA (stage 2, SWS, REM) was conducted using only Cz data to assess for sleep state effects. This analysis was able to include seven subjects.
In stage 2 sleep, there was a significant effect of electrode site for amplitude (F2,22 = 11.9, P < 0.001) with planned contrasts indicating that Cz values were significantly larger than those at Fz (F1,11 = 6.2, P < 0.05) or Pz (F1,11 = 26.8, P < 0.05) (see Table 2 and Figures 4–6). There was also a significant effect of latency (F2,22 = 5.6, P < 0.05). N550 at Cz was similar to that of Pz but was earlier at Fz (F1,11 = 7.0, P < 0.05) (see table 3). At electrode site Cz, there was significant sleep state effect for amplitude (F2,10 = 28.2, P < 0.001), with planned contrasts indicating no significant difference between SWS and Stage 2; but N550 in SWS was significantly larger than when measured in REM (F1,11= 19.9, P < 0.01). There was no effect for latency.
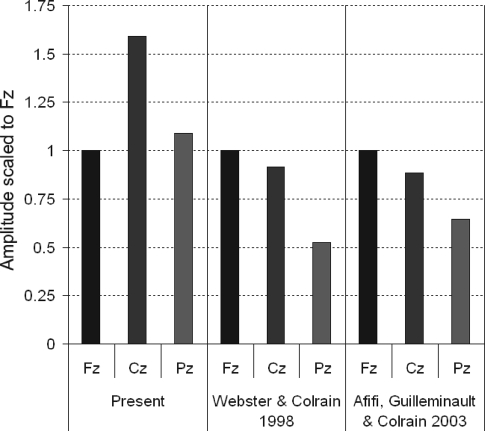
The pattern of amplitude change from Fz to Cz and Pz observed in the children was very different from that previously reported in previous studies of adults. To illustrate this phenomenon more clearly, Figure 7 displays N550 amplitude data scaled to Fz values from the present dataset, as well as comparable data from 2 previous studies of adults in their 20s.4,5 Previously reported data on RREP and AEP during NREM sleep from young adults have shown an anterior to posterior decrease in N550 amplitude; the values from Pz were approximately 60% of those seen at Fz.24,25 The present data display a remarkably different pattern, with a Cz maximum and Pz values approximately equal to Fz.
Figure 7.
N550 amplitude presented as a proportion of the amplitude at Fz. Data are presented from the present study, from the seven 19 to 28-year-old male subjects reported in Webster and Colrain4 and five 23 to 29-year-old female control subjects drawn from Afifi et al.5 The data from the children in the present study demonstrate the lack of the typical adult pattern of an anterior-posterior gradient in N550 amplitude.
P900
P900 was present as a separate peak in all subjects in stage 2 sleep and 11 subjects in SWS, but was only seen at all sites in 8 subjects in REM. As with N550, two separate analyses were thus conducted. Both analyses were able to include all 12 subjects.
In stage 2 sleep, there was no significant effect of electrode site for amplitude (see Table 2 and Figures 4–6). At electrode site Cz, there was significant sleep state effect for amplitude (F2,22 = 5.5, P <.05), with planned contrasts indicating that P900 in SWS was significantly larger than that seen in stage 2 (F1,11 = 5.2, P <.05) and in REM (F1,11 = 8.1, P <.05). Similarly there was a main effect of state for P900 latency (F2,22 = 5.6, P <.05), with stage 2 values being later than SWS (F1,11 = 6.8, P <.05) and REM (F1,11 = 7.0, P <.05) (see Table 3 and Figures 4–6).
DISCUSSION
The data reported represent the first ever study of evoked potentials during sleep in children. Furthermore, these data provide the first full report of RREP during REM sleep. Robust, early RREP responses were seen in all sleep stages, despite the very low signal to noise ratio inherent in measuring very small evoked potential components in the context of very large amplitude background EEG. The typical late components previously reported in adults were seen in stage 2 sleep and slow wave sleep, with some important modifications. In particular, the N550 did not display the clear anterior-posterior amplitude gradient that is prominent in adults.
P1 and Nf
The early RREP components P1 and Nf act as a reflection of the central processing of load application. P1 probably reflects bilateral activation of the primary somatosensory cortex, with Nf probably reflecting a parallel motor activation.3 During wakefulness, P1 and Nf only occur in response to stimuli that are of sufficient magnitude to exceed detection threshold26; the amplitude of both components has been shown to correlate with load magnitude,27,28 and P1 amplitude is correlated with subjective load magnitude estimation.28–30 The fact that it is these components are likely generated by multiple afferent sources from throughout the respiratory system is highlighted in studies that show the persistence of the responses following vagal transaction in double lung transplant patients31 and also in tracheostomized patients in whom the upper airway is isolated.26
The small magnitude of the P1 and Nf components relative to the background EEG has made them difficult to record during sleep in adults, with only one study being able to do so successfully in stage 2 sleep. In that study, the components were not observable in SWS.4 Despite children having an even higher amplitude background EEG, P1 and Nf were well represented in all sleep states in the majority of subjects in the current study. While not directly tested in this study, this implies a stronger afferent response to inspiratory loads during sleep in children and is consistent with their increased levels of neuromotor activation of the upper airway during sleep.16
Late RREP Components
P2, N350, N550, and P900 peaks were able to be measured during sleep in the children studied. None of these components are specific to the RREP and thus, unlike the P1 and Nf, none selectively index the processing of respiratory afferent information. What they provide is a measure of central nervous system responsiveness during sleep to whichever type of stimulus is being presented.
P2 is a ubiquitous component and appears in NREM sleep, REM sleep, and wakefulness; however remarkably little is known about its neural generation or functional significance. It increases in amplitude across the adult life span and is thought to be generated by the mesencephalic reticular activating system which responds to input from all sensory modalities.32 P2 was one of the components reported in the first paper showing the existence of the RREP.1 Most subsequent studies of the RREP during wakefulness in adults have shown a P2 component, although it has not been seen during wakefulness in children.2,14 The presence of a P2 component in all children in all sleep stages, would appear to add support to the hypothesis that the P2 in sleep is a component functionally distinct from that seen in wakefulness.32
In adults, N350 appears during the transition from a drowsy state to that of sleep.8 It is thought to be related to the presence of vertex sharp waves in the averaged responses7 that are able to be elicited by inspiratory occlusion stimuli.9 As would be expected, N350 has a vertex prominent distribution and is always larger at Cz than Fz or Pz.7 In the present study, N350 also appeared as a vertex maximal component during all sleep stages, arguing that the same generator mechanism is stimulated in children.
Following Bastien and Campbell's initial work,33 it is now clear that N550 is produced when evoked K-complexes are present in an averaged response.21 There is now a substantial literature indicating that the RREP and AEP N550 components, measured as either the average of all responses or as averages of exclusively K-complex responses, have a topographic distribution indicating frontal or frontocentral maxima, bilateral symmetry, and a gradual fall off in voltage from the midline frontal/fronto-central area to the posterior and lateral scalp.21 The most parsimonious explanation of the altered topography observed in children (see Figure 7) would be that dendritic pruning has not yet occurred, leaving open the possibility of spreading activation of the component through a network of synapses that is reduced in extent with further brain development.20
In the present study, N350 and N550 often appeared as two points in a broadly negative waveform in stage 2 and SWS (see Figures 5 and 6) rather than as distinct peaks with an intervening positivity (P450), as is often reported in adults (see Figure 1 in Gora et al.8, or Figure 5 in Webster and Colrain4 for examples of the adult pattern in waveforms analogous to those of the present study). The diminished N550 in REM (see Figure 6) is understandable given the known role of K-complexes in the generation of this component and their absence in REM sleep.21 The absence of N550 as a distinct component in SWS is more surprising, as previous RREP4 and AEP34 studies in adults have shown N550 as a prominent component. It is possible that in children the N350 and N550 tend to merge into a single delta frequency response. Certainly, the present data indicate that the N350 appeared to occur later, and the N550 earlier, than typical adult values (see4 for example). Another possibility is that the first (N350) generator is more readily able to trigger the second (N550), due to the availability of synaptic interconnections prior to pruning as discussed above.20 This speculation will require more extensive evaluation.
Brain development in childhood and adolescence, in particular the pruning of dendritic synaptic connections, commences in the occipital regions and progresses in a caudorostral direction, with the dorsolateral prefrontal cortex being among the last to take on an adult form.35 The lack of a frontally prominent N550 in children raises the possibility that this component may have some utility as a marker of brain development. Testing of this hypothesis will require the use of high-density electrode arrays in children of different ages to accurately map developmental changes.
When all responses to stimuli are averaged, a P900 is seen following the negative deflection of N550. As with the N550, this P900 component is more prominent in averages of K-complexes, and it is debatable whether it should be viewed as an independent component. The one study to investigate P900 topography34 indicated that within stage 2 it is maximal frontocentrally, bilaterally symmetrical, and showed no evidence of polarity inversion over the Sylvian plane. During SWS, it showed frontocentral maxima and had amplitudes that declined more rapidly over inferior regions of the scalp than was the case in stage 2.
The similarity in topographic distribution between the P900 and N550 described above is consistent with an argument that they reflect activity of the same generator mechanism. In further support of this hypothesis is the fact that P900, like N550, was not affected by manipulations of stimulus parameters.33 Furthermore, both N550 and P900 were affected by the rate of presentation, being larger with the 30-s interstimulus interval (ISI) than with the 5-s and 10-s ISI.36 The above evidence would thus tend to indicate that the P900 is the averaged representation of the positive voltage change that terminates the K-complex. The present data from children are thus particularly interesting in that they show no significant electrode site effects in any sleep stage; they show much less of a Cz prominence than the N550 data. Again this raises the possibility that children have a different pattern of generator activity for N550 and P900 than adults.
As this is the first study of RREPs during sleep in children, it has some limitations and leaves several interesting questions unanswered. To maximize the number of responses within each sleep stage, it was necessary to average responses from across all sleep cycles. The data cannot therefore address the question of whether there are sleep-cycle or time-of-night effects on the RREP response. Two other limitations relate to the comparison of the sleep data in children to historical wake data in children and sleep data in adults. Although beyond the scope of this study, it would clearly have been preferable to record evoked potentials during wakefulness in the same children, and to have an adult comparison group using identical recording parameters.
The main difference in methods used in the present study compared to previous studies in adults was the use of a bias flow to prevent rebreathing of CO2. This was required in children because the respiratory circuit produced a relatively large dead space (410 mL, with a resistance of 0.0032 cm H2O/mL/sec) relative to their size. This is typically not required in adults, as the adult tidal volume is sufficiently larger than the circuit dead space to ensure adequate CO2 clearance. While the use of low-pressure CPAP to provide this flow might acutely alter pressure mechanoreception in the upper airway, it is unlikely that it would lead to different scalp EEG topography. The impact of bias flow on RREPs in adults should nonetheless be assessed.
In conclusion, the data are clear in indicating that RREP responses are able to be elicited in children in all sleep states. The presence of the early components, in at least the majority of children, indicates that central processing of load-related information is maintained for children throughout sleep. The different topography of later components, together with altered latencies, relative to those in adults, highlight the potential utility of sleep evoked potentials as indicators of brain development and pathology in children.
ACKNOWLEDGMENTS
Dr. Marcus was supported by NIH grants #HL58585 and U54 RR023567. Additional research support from Respironics, Inc. funded a research technician.
Footnotes
Disclosure Statement
This was not an industry supported study. Dr. Marcus has received research support and the use of equipment from Respironics. The other authors have indicated no conflicts of interest.
REFERENCES
- 1.Davenport PW, Friedman WA, Thompson FJ, Franzen O. Respiratory-related cortical potentials evoked by inspiratory occlusion in humans. J Appl Physiol. 1986;60:1843–8. doi: 10.1152/jappl.1986.60.6.1843. [DOI] [PubMed] [Google Scholar]
- 2.Davenport PW, Colrain IM, Hill PM. Scalp topography of the short-latency components of the respiratory-related evoked potential in children. J Appl Physiol. 1996;80:1785–91. doi: 10.1152/jappl.1996.80.5.1785. [DOI] [PubMed] [Google Scholar]
- 3.Logie ST, Colrain IM, Webster KE. Source dipole analysis of the early components of the RREP. Brain Topogr. 1998;11:153–64. doi: 10.1023/a:1022210723257. [DOI] [PubMed] [Google Scholar]
- 4.Webster KE, Colrain IM. Multichannel EEG analysis of respiratory evoked-potential components during wakefulness and NREM sleep. J Appl Physiol. 1998;85:1727–35. doi: 10.1152/jappl.1998.85.5.1727. [DOI] [PubMed] [Google Scholar]
- 5.Afifi L, Guilleminault C, Colrain IM. Sleep and respiratory stimulus specific dampening of cortical responsiveness in OSAS. Respir Physiol Neurobiol. 2003;136:221–34. doi: 10.1016/s1569-9048(03)00084-3. [DOI] [PubMed] [Google Scholar]
- 6.Colrain IM, Webster KE, Hirst G. The N550 component of the evoked K-complex: a modality non-specific response? J. Sleep Res. 1999;8:273–80. doi: 10.1046/j.1365-2869.1999.00163.x. [DOI] [PubMed] [Google Scholar]
- 7.Colrain IM, Webster KE, Hirst G, Campbell KB. The roles of vertex sharp waves and K-complexes in the generation of N300 in auditory and respiratory-related evoked potentials during early stage 2 NREM sleep. Sleep. 2000;23:97–106. [PubMed] [Google Scholar]
- 8.Gora J, Colrain IM, Trinder J. Respiratory-related evoked potentials during the transition from alpha to theta EEG activity in stage 1 NREM sleep. J Sleep Res. 1999;8:123–34. doi: 10.1046/j.1365-2869.1999.00144.x. [DOI] [PubMed] [Google Scholar]
- 9.Gora J, Colrain IM, Trinder J. The investigation of K-complex and vertex sharp wave activity in response to mid-inspiratory occlusions and complete obstructions to breathing during NREM sleep. Sleep. 2001;24:81–9. doi: 10.1093/sleep/24.1.81. [DOI] [PubMed] [Google Scholar]
- 10.Gora J, Trinder J, Pierce R, Colrain IM. Evidence of a sleep-specific blunted cortical response to inspiratory occlusions in mild obstructive sleep apnea syndrome. Am J Respir Crit Care Med. 2002;166:1225–34. doi: 10.1164/rccm.2106005. [DOI] [PubMed] [Google Scholar]
- 11.Colrain IM, Afifi L, Guilleminault C. Respiratory-related evoked potentials in REM sleep in OSAS patients – Controls. J Sleep Res. 2002;11:40. [Google Scholar]
- 12.Kallai I, Harsh J, Voss U. Attention to external stimuli during wakefulness and sleep: evoked 40-Hz response and N350. Psychophysiology. 2003;40:955–66. doi: 10.1111/1469-8986.00114. [DOI] [PubMed] [Google Scholar]
- 13.Cote KA, Etienne L, Campbell KB. Neurophysiological evidence for the detection of external stimuli during sleep. Sleep. 2001;24:791–803. [PubMed] [Google Scholar]
- 14.Davenport PW, Cruz M, Stecenko AA, Kifle Y. Respiratory-related evoked potentials in children with life-threatening asthma. Am J Respir Crit Care Med. 2000;161:1830–5. doi: 10.1164/ajrccm.161.6.9903077. [DOI] [PubMed] [Google Scholar]
- 15.Marcus CL, Omlin KJ, Basinki DJ, et al. Normal polysomnographic values for children and adolescents. Am Rev Respir Dis. 1992;146:1235–9. doi: 10.1164/ajrccm/146.5_Pt_1.1235. [DOI] [PubMed] [Google Scholar]
- 16.Marcus CL, Fernandes Do Prado LB, Lutz J, et al. Developmental changes in upper airway dynamics. J Appl Physiol. 2004;97:98–108. doi: 10.1152/japplphysiol.00462.2003. [DOI] [PubMed] [Google Scholar]
- 17.Gasser T, Jennen-Steinmetz C, Sroka L, Verleger R, Mocks J. Development of the EEG of school-age children and adolescents. II. Topography. Electroencephalogr Clin Neurophysiol. 1988;69:100–9. doi: 10.1016/0013-4694(88)90205-2. [DOI] [PubMed] [Google Scholar]
- 18.Jenni OG, Carskadon MA. Spectral analysis of the sleep electroencephalogram during adolescence. Sleep. 2004;27:774–83. [PubMed] [Google Scholar]
- 19.Feinberg I, Higgins LM, Khaw WY, Campbell IG. The adolescent decline of NREM delta, an indicator of brain maturation, is linked to age and sex but not to pubertal stage. Am J Physiol Regul Integr Comp Physiol. 2006;291:R1724–9. doi: 10.1152/ajpregu.00293.2006. [DOI] [PMC free article] [PubMed] [Google Scholar]
- 20.Toga AW, Thompson PM, Sowell ER. Mapping brain maturation. Trends Neurosci. 2006;29:148–59. doi: 10.1016/j.tins.2006.01.007. [DOI] [PMC free article] [PubMed] [Google Scholar]
- 21.Colrain IM. The K-complex: A seven-decade history. Sleep. 2005;28:255–73. doi: 10.1093/sleep/28.2.255. [DOI] [PubMed] [Google Scholar]
- 22.Lee PA, Guo SS, Kulin HE. Age of puberty: data from the United States of America. APMIS. 2001;109:81–8. doi: 10.1034/j.1600-0463.2001.d01-107.x. [DOI] [PubMed] [Google Scholar]
- 23.Rechtschaffen A, Kales A. A manual of standardised terminology, techniques and scoring systems for sleep stages of human subjects. Washington, DC: U.S. Government Printing Office; 1968. [Google Scholar]
- 24.Colrain IM, Campbell KB. The use of evoked potentials in sleep research. Sleep Med Rev. 2007 doi: 10.1016/j.smrv.2007.05.001. In Press. [DOI] [PMC free article] [PubMed] [Google Scholar]
- 25.Campbell KB, Colrain IM. Event-related potential measures of the inhibition of information processing: II. The sleep onset period. Int J Psychophysiol. 2002;46:197–214. doi: 10.1016/s0167-8760(02)00112-5. [DOI] [PubMed] [Google Scholar]
- 26.Davenport PW, Martin AD, Chou YL, Alexander-Miller S. Respiratory-related evoked potential elicited in tracheostomised lung transplant patients. Eur Respir J. 2006;28:391–6. doi: 10.1183/09031936.06.00095005. [DOI] [PubMed] [Google Scholar]
- 27.Davenport PW, Chan PY, Zhang W, Chou YL. Detection threshold for inspiratory resistive loads and respiratory-related evoked potentials. J Appl Physiol. 2007;102:276–285. doi: 10.1152/japplphysiol.01436.2005. [DOI] [PubMed] [Google Scholar]
- 28.Webster KE, Colrain IM. The relationship between respiratory-related evoked potentials and the perception of inspiratory resistive loads. Psychophysiology. 2000;37:831–41. [PubMed] [Google Scholar]
- 29.Eckert DJ, Catcheside PG, McDonald R, et al. Sustained hypoxia depresses sensory processing of respiratory resistive loads. Am J Respir Crit Care Med. 2005;172:1047–54. doi: 10.1164/rccm.200505-699OC. [DOI] [PubMed] [Google Scholar]
- 30.Knafelc M, Davenport PW. Relationship between magnitude estimation of resistive loads, inspiratory pressures, and the RREP P(1) peak. J Appl Physiol. 1999;87:516–22. doi: 10.1152/jappl.1999.87.2.516. [DOI] [PubMed] [Google Scholar]
- 31.Zhao W, Martin AD, Davenport PW. Respiratory-related evoked potentials elicited by inspiratory occlusions in double-lung transplant recipients. J Appl Physiol. 2002;93:894–902. doi: 10.1152/japplphysiol.01218.2001. [DOI] [PubMed] [Google Scholar]
- 32.Crowley KE, Colrain IM. A review of the evidence for P2 being an independent component process: age, sleep and modality. Clin Neurophysiol. 2004;115:732–44. doi: 10.1016/j.clinph.2003.11.021. [DOI] [PubMed] [Google Scholar]
- 33.Bastien C, Campbell K. The evoked K-complex: all-or-none phenomenon? Sleep. 1992;15:236–45. doi: 10.1093/sleep/15.3.236. [DOI] [PubMed] [Google Scholar]
- 34.Cote KA, de Lugt DR, Langley SD, Campbell KB. Scalp topography of the auditory evoked K-complex in stage 2 and slow wave sleep. J Sleep Res. 1999;8:263–72. doi: 10.1046/j.1365-2869.1999.00164.x. [DOI] [PubMed] [Google Scholar]
- 35.Gogtay N, Giedd JN, Lusk L, et al. Dynamic mapping of human cortical development during childhood through early adulthood. Proc Natl Acad Sci U S A. 2004;101:8174–9. doi: 10.1073/pnas.0402680101. [DOI] [PMC free article] [PubMed] [Google Scholar]
- 36.Bastien C, Campbell K. Effects of rate of tone-pip stimulation on the evoked K-Complex. J Sleep Res. 1994;3:65–72. doi: 10.1111/j.1365-2869.1994.tb00109.x. [DOI] [PubMed] [Google Scholar]


