

Abstract
Study Objectives:
To quantitatively assess autonomic cardiovascular control in normal young adults following exposure to repetitive acoustically-induced arousals from sleep.
Design:
Respiration, R-R interval (RRI) and noninvasive measurements of continuous arterial blood pressure were monitored in subjects during the transition from relaxed wakefulness to stable Stage 2 sleep. These measurements were made under undisturbed conditions or conditions in which transient arousals were induced repetitively by acoustic stimulation. A mathematical model was used to partition the fluctuations in RRI into a component (“RSA”) correlated with respiration and a component (“ABR”) representing baroreflex control of heart rate. The magnitudes and forms of each component before and after exposure to repetitive arousals were compared
Setting:
Sleep disorders laboratory in a university setting.
Patients or Participants:
Ten healthy young adults (5 male, 5 female) with an average age of 20.4 ± 2.0 y and mean body-mass index of 23.8 ± 2.9 kg/m2.
Interventions:
Each subject participated in multiple sleep studies consisting of 4 conditions with 2 nights in each condition. The first condition consisted of undisturbed sleep (control), while in the other 3 conditions, the subjects were aroused from sleep by repetitive auditory stimuli applied continuously over a duration of 50 minutes, with periodicities of 30 seconds, 1 minute, and 2 minutes of sleep.
Measurements and Results:
Exposure to repetitive arousal (RA) did not alter mean heart rate or blood pressure. However, ABR and RSA gains estimated using the model, increased from the onset of Stage 1 sleep to the start of stable Stage 2 sleep under the control condition, but remained unchanged in all RA conditions. There were also significant increases in low-frequency oscillations of systolic blood pressure in the RA conditions versus no change in the control condition.
Conclusions:
Exposure to RA over durations approximating an hour produces cumulative effects on autonomic control that are subtle and can only be detected when advanced signal processing methods are employed. More specifically, the increases in ABR and RSA gains that accompany increasing sleep depth in normal sleep are prevented from occurring.
Citation:
Chaicharn J; Carrington M; Trinder J; Khoo MCK. The Effects on Cardiovascular Autonomic Control of Repetitive Arousal from Sleep. SLEEP 2008;31(1):93-103.
Keywords: Autonomic nervous system, cardiovascular control, mathematical model, respiratory sinus arrhythmia, baroreflexes
INTRODUCTION
IT IS NOW REASONABLY WELL ESTABLISHED THAT OBSTRUCTIVE SLEEP APNEA (OSA) CONSTITUTES AN INDEPENDENT RISK FACTOR FOR DAYTIME HYPERTENSION.1,2 The potential mechanisms that could link OSA to hypertension include chronic exposure to intermittent hypoxia, large intrathoracic pressure swings, and repetitive arousals from sleep occurring at the termination of each obstruction.3 However, the extent to which each of these mechanisms contributes to the development of hypertension remains relatively unexplored, particularly in humans.
Previous studies have suggested a strong relationship between arousal from sleep and an increase in sympathetic nervous system activity and blood pressure (BP).4–6 In healthy subjects, the cardiovascular activation response at arousal from sleep is different from the response that occurs during normal wakefulness.7 In OSA, transient auditory arousal from sleep has been found to be associated with BP elevation even in the absence of apnea and hypoxia.8 Indeed, during NREM sleep in subjects with OSA, transient arousal alone causes much of the blood pressure rise at the end of each apnea.9 Thus, the question arises as to whether exposure to repeated transient arousals from sleep, in the absence of hypercapnia or hypoxia, produces cumulative effects on autonomic control.
Previous studies have shown that in normal individuals and in hypertensive subjects without sleep disordered breathing, NREM sleep is associated with a lowering of heart rate, arterial blood pressure, cardiac output, and systemic vascular resistance.10–12 These changes are consistent with the general notion that the parasympathetic branch of the autonomic nervous system assumes dominance during normal sleep. On the other hand, some studies indicate that this increase in parasympathetic activity and the corresponding decrease in sympathetic activity are not achieved monotonically. For instance, in one report, the magnitude of respiratory sinus arrhythmia (RSA) and total heart rate variability (HRV) were found to be increased in light sleep relative to wakefulness, but became lower in the deeper stages of NREM sleep.13 In a recent study in young healthy adults, Carrington et al.14 found that sleep was associated with an abrupt fall in BP, a small increase in the sensitivity of the baroreflex and, on the basis of indirect evidence, a downward resetting of the baroreflex. However, these effects were delayed by spontaneous arousals during the sleep onset period and were not manifest until stable sleep was achieved.14 In a study of normal, hypertensive, apneic, and apneic hypertensive individuals, increased daytime sympathetic tone was associated with movement arousals.15 These observations suggest that the autonomic effects of arousals may be cumulative and relatively long lasting. Such a hypothesis suggests the possibility that the arousals that accompany the termination of upper airway obstruction in OSA contribute in a significant way to daytime hypertension in these patients. This is compatible with recent data from Blasi et al.,6 who found that acoustically-induced arousals can produce measurable changes in cardiovascular variability that last over 1 minute.
In this study, we exposed healthy young subjects to contiguous periods (~1 hour duration) of acoustically-induced, repetitive arousals during Stage 2 sleep in order to determine whether this intervention would produce cumulative effects on autonomic control, using the measures of cardiovascular variability. We employed a mathematical model to increase the sensitivity with which potential effects could be detected. We also explored the issue of whether the cumulative effects of repetitive arousals might depend on the periodicity of these arousals.
METHODS
Subjects and Measurements
Ten healthy volunteers (5 male, 5 female) were recruited; average age was 20.4 ± 2.0 y (range 18-25 y) and mean BMI of 23.8 ± 2.9 kg/m2 (range 18.2-29.1 kg/m2). Participants were screened via questionnaire at an intake interview for personal or familial history of a sleep, cardiovascular or respiratory disorder, smoking, intense regular physical exercise (>10 h/wk), excessive intake of alcohol (>5 standard drinks/wk) or caffeine (>350 mg/d), daytime napping, and abnormal sleep/wake schedules including shift-work or trans-meridian travel in the 3 months prior to participation in the study. Volunteers were free of physical illness and were not, or had not been taking any medication other than birth control pills, although menstrual phase was not controlled for. Volunteers did not participate during times of major life stress, such as during examination periods. The project was approved by the Human Research Ethics Committee of The University of Melbourne. Lastly, participants gave informed consent to participate in the study and were reimbursed for their time commitment to the study.
In each subject, the electromyogram, electrooculogram, electroencephalogram, BP, electrocardiogram (ECG), and respiratory inductance plethysmograph (abdominal and thoracic) were recorded. BP was measured continuously and noninvasively using a Portapres Model 2 BP Monitor (TNO-TPD Biomedical Instrumentation, Amsterdam, The Netherlands).
Experimental Design
Each subject participated in multiple sleep studies consisting of 4 conditions with 2 nights in each condition. The first condition was normal sleep in which participants were left to sleep undisturbed. In the other 3 conditions, the subjects were aroused by repetitive auditory stimuli with periodicities of 30 s, 1 min, and 2 min of sleep. For each subject, the order in which the control and each of the repetitive arousal conditions were applied was randomized.
For each condition the data were classified into 5 phases corresponding to sleep status. Phase 1, 30 min prior to lights out (LO), corresponded to the initial period of relaxed wakefulness prior to the lights being turned out. Phase 2, LO to the onset of stage 1 sleep, was marked by relaxed wakefulness after LO and before the first occurrence of 10 s of continuous theta activity. Phase 3, onset of stage 1 sleep to the onset of stage 2 sleep, corresponded to the time between the first 10 s of continuous theta activity and the first sleep spindle or K-complex. Phase 4, onset of stage 2 sleep to the onset of stable stage 2 sleep, corresponded to the time between the first occurrence of a sleep spindle or K-complex and the beginning of stable stage 2 sleep, as defined by the beginning of the first 5 min of undisturbed NREM sleep. Phase 5, 30 min after onset of stage 2 sleep, was marked by undisturbed sleep as characterized by continuous stage 2 sleep or slow wave sleep (SWS) without arousal. In conditions 2, 3, and 4, in which repetitive auditory stimuli were presented, stable NREM sleep did not occur. Thus, phase 4 was defined as having the same duration as Phase 4 in condition 1, and Phase 5 was defined as the next 30 minutes. A schematic summary of the experimental protocol is displayed in Figure 1.
Figure 1.

Schematic summary of the experimental protocol showing the duration over which repetitive arousals were elicited acoustically (box marked “50 min”), as well as the approximate time-locations of the data segments extracted for analysis (boxes with vertical bars).
Data Analysis
R-R intervals (RRI) were extracted from the ECG. Systolic blood pressure (SBP) and diastolic blood pressure (DBP) were extracted on a beat-by-beat basis. Instantaneous lung volume (V) was calculated from the abdominal and thoracic respiration bands signals. All signals were detrended and uniformly sampled to 2 samples/s. To eliminate high-frequency noise, the data were preprocessed by low-pass filtering using a Kaiser finite impulse response filter (pass- band = 0–0.5 Hz, stop band = 0.7–1 Hz, order 21, and ripple < 0.01).
Because of the incompleteness of some of the studies, and in order to maintain the same repetitive arousal periods for each subject, data from only 7 participants were processed. In order to eliminate first-night effects, only the data from the second night for each condition were analyzed. For each signal, 5 consecutive 30-s segments towards the end of phase 3 and 5 corresponding 30-s segments after 50 min of repetitive arousal (in phase 5) were selected for further analysis (see Figure 1).
From each segment of data, the following parameters were calculated: mean RRI, mean BP, low-frequency RRI power (RRILFP), ratio of low-frequency to high-frequency RRI power (RRILHR) and low-frequency SBP power. Subsequently, two-way repeated measures analysis of variance was applied to each of the above parameter estimates. The first factor was phase (pre-arousal in phase 3 vs post-arousal in phase 5). The second factor was repetitive arousal (RA) type, the levels being control (no arousal), 30 s RA, 1 min RA, and 2 min RA.
Model
To determine how changes in instantaneous lung volume (ΔV) and fluctuations in SBP (ΔSBP) dynamically produce fluctuations in RRI (ΔRRI), we employed a mathematical model of heart rate variability based on that of Belozeroff et al.,16 but modified to allow the model parameters to be time-varying. In this model (displayed schematically in Figure 2), fluctuations of RRI are autonomically mediated by the arterial baroreflexes (ABR) and direct respiratory-cardiac coupling (RSA), as represented by the equation below:
Figure 2.

Schematic illustration of the components contributing to heart rate variability (changes in RRI), as assumed in the model (modified from Ref. 16). hABR(t) = impulse response function representing baroreflex dynamics, hRSA(t) = impulse response function representing respiratory-cardiac coupling. See text for details.
In the above equation, hRSA(•) and hABR(•) represent the impulse responses that characterize the dynamics of the respiratory-cardiac coupling mechanism and the baroreflexes, respectively. hABR(•), quantifies the time-course of the change in RRI resulting from an abrupt increase in SBP of 1 mm Hg. hRSA(•) reflects the time-course of the fluctuation in RRI following a very rapid inspiration and expiration of 1 liter of air. Note that the dependence on two time indices (t and i) implies that we are allowing hRSA(•) and hABR(•) to represent dynamic characteristics that can vary with time. These impulse responses were assumed to persist for a maximum duration of M sampling intervals, each sampling interval being 0.5 s. Based on the lengths of our datasets and preliminary analyses, we found 50 to be a suitable value for M.16,17 τRSA and τABR represent the time-delays associated with these mechanisms. ϵRRI(t) represents the discrepancy (error) between the model predictions and the corresponding RRI measurements, reflecting those aspects of the data that are not explained by the model.
For purposes of parameter estimation, the impulse responses hRSA(•) and hABR(•) were each formulated as the weighted sum of a set of Meixner basis functions.17 The practical advantage of this approach is that the use of basis functions produces a substantial reduction in the number of unknown parameters by an order of magnitude, thereby allowing greater statistical reliability to be achieved in the parameter estimates. Although we have previously employed Laguerre basis functions,16 Asyali has shown that the Meixner set provides better estimates of dynamic responses that contain pure delays.17 The first 2 minutes of data were used to obtain initial estimates of the Meixner coefficients. The “optimal” values of τRSA, τABR, model order (number of Meixner functions) (4 to 8), and the order of the generalization (which controls when the family of Meixner functions begins to fluctuate), were obtained by selecting the combination of parameters that produced the smallest global values of the minimum description length (MDL) and the cross correlation between the residual error and input as criterion. Subsequently, the model was made time-varying by allowing the coefficients of the Meixner basis functions to change with time. The recursive least squares algorithm18 was used to estimate the time-varing coefficients of the model. Further details of the model calculations are given in the Appendix.
The estimation of the above impulse responses was improved by increasing the orthogonality between the 2 inputs. This was achieved by using an autoregressive model with exogenous input (ARX model) to “filter” out the respiration-correlated component from ΔSBP. Respiration and the respiration-uncorrelated ΔSBP were then used as dual inputs to the model, as represented in Equation (1). Subsequently, the calculated hABR(•) was kept unchanged while estimation of hRSA(•) was repeated using the respiration and original (unorthogonalized) blood pressure inputs.
From each impulse response function estimated at any time t, the Fast Fourier Transform was computed to derive the transfer function at that time. Thus, the time-varying model allowed us to estimate the sequential estimates of the RSA and ABR transfer functions as time evolved from Phase 3 through Phase 5. For purposes of statistical analysis, the following descriptors were derived from each impulse response or transfer function estimate: 1) the peak to peak magnitude, which was the difference between the maximum and minimum value of the impulse response; 2) the “dynamic gain,” or the average transfer function magnitude between 0.04 and 0.4 Hz, which was obtained by computing the Fast Fourier Transform of the impulse response; 3) the high-frequency gain, the average transfer function magnitude between 0.15 and 0.4 Hz; and 4) the low-frequency gain, the average transfer function magnitude between 0.04 and 0.15 Hz. This procedure enabled us to generate the estimated time-courses of all model descriptors. To determine whether there were significant changes in the model descriptors before vs after the duration (50 min) of repetitive arousal, we selected for comparison the average of each model descriptor during the last 1-min segment of Phase 3 and the average of the same model descriptor during the first 1-min segment of Phase 5.
Two-way repeated measures analysis of variance was applied to each of the above estimated model descriptors. The first factor was Phase (pre-arousal in Phase 3 vs post-arousal in Phase 5). The second factor was repetitive arousal (RA) type, the levels being Control (no arousal), 30 s RA, 1 min RA, and 2 min RA. If differences occurred, post hoc pairwise comparisons were performed.
RESULTS
Effect of Repetitive Arousal on RRI, BP, and Cardiovascular Variability
Figure 3 displays examples of the changes in SBP elicited as a result of repeated arousals (indicated by dashed vertical bars) induced by acoustic stimulation at intervals of 30 s (top panel), 1 minute (middle panel), and 2 minutes (bottom panel). As shown in Table 1, none of the repetitive arousal regimens produced detectable cumulative effects on mean RRI, mean SBP and mean DBP. There was also no systematic effect of repetitive arousal on the spectral indices of heart rate variability, except for an increase in HFPRRI following 30-s RA and a decrease in LHR following 1-min RA. The potential reasons for these isolated changes are addressed in the Discussion.
Figure 3.

Sample time-courses of the beat-to-beat fluctuations in systolic blood pressure (SBP) elicited as a result of repeated arousals (indicated by dashed vertical bars) induced by acoustic stimulation at intervals of 30 s (top panel), 1 min (middle panel), and 2 min (bottom panel).
Table 1.
Summary Cardiovascular Measures and Spectral Indices of Heart Rate and Blood Pressure Variability
| Cardiovascular Measure | Sleep/Sleep-onset Phase | CONDITION |
|||
|---|---|---|---|---|---|
| Control (Mean ± SE) | 30-s RA (Mean ± SE) | 1-min RA (Mean ± SE) | 2-min RA (Mean ± SE) | ||
| Mean RRI (ms) | 3 | 939.3 ± 74.7 | 917.9 ± 71.7 | 854.6 ± 52.6 | 904.4 ± 80.1 |
| 5 | 960.1 ± 68.7 | 990.8 ± 63.8 | 874.7 ± 45.8 | 934.3 ± 82.9 | |
| Mean SBP (mmHg) | 3 | 102.95 ± 13.16 | 102.3 ± 4.6 | 109.7 ± 8.1 | 103.0 ± 6.8 |
| 5 | 96.95 ± 12.56 | 102.7 ± 5.5 | 100.7 ± 5.3 | 99.8 ± 3.9 | |
| Mean DBP (mmHg) | 3 | 59.30 ± 4.96 | 49.5 ± 2.9 | 51.2 ± 4.0 | 51.2 ± 3.6 |
| 5 | 55.70 ± 3.68 | 49.2 ± 2.7 | 48.9 ± 2.9 | 47.1 ± 2.7 | |
| HFPRRI (ms2) | 3 | 659.8 ± 157.9 | 683.0 ± 298.7 | 932.2 ± 405.2 | 884.0 ± 427.6 |
| 5 | 1140.8 ± 238 | 3147.1 ± 1217.8* | 730.4 ± 204.6 | 1431.6 ± 551.1 | |
| LHR | 3 | 1.16 ± 0.27 | 0.41 ± 0.15 | 1.65 ± 0.61 | 0.85 ± 0.28 |
| 5 | 0.88 ± 0.22 | 0.54 ± 0.07 | 0.82 ± 0.24* | 0.90 ± 0.33 | |
| LFPSBP (mmHg2) | 3 | 10.07 ± 1.56 | 3.34 ± 1.59 | 5.80 ± 0.90 | 9.62 ± 3.52 |
| 5 | 10.92 ± 1.12 | 9.16 ± 1.28* | 12.02 ± 2.28* | 15.74 ± 3.59* | |
| LFPDBP (mmHg2) | 3 | 3.01 ± 0.66 | 1.09 ± 0.14 | 2.91 ± 0.50 | 3.25 ± 0.92 |
| 5 | 3.60 ± 0.83 | 4.57 ± 2.06* | 2.84 ± 0.90 | 3.46 ± 0.85 | |
RA = Repetitive arousal; *P<0.05 from Phase 3 of same condition.
However, there was a consistent increase in the low-frequency power of SBP variability (LFPSBP) in all the arousal conditions between Phase 3 and Phase 5, whereas under control conditions LFPSBP did not change. The low-frequency power of DBP variability (LFPDBP) did not display the same tendency, except in the 30-s RA condition.
Effects of Repetitive Arousal on Model Parameters
The left panel of Figure 4 shows the estimated subject-averaged transfer functions (magnitude plots) for the RSA component of the model in Phase 3 (filled circles) and Phase 5 (open triangles) in the control condition (i.e., natural sleep without interventions). The averaged Phase 1 plot is displayed for reference. The shapes of the estimated transfer functions suggest that the RSA mechanism behaves as a low-pass filter, i.e., as breathing frequency is decreased, the amplitude of the associated heart rate oscillation increases. This is consistent with the findings from previous studies that have investigated how RSA magnitude changes when breathing frequency is controlled voluntarily.19
On average, the RSA transfer function magnitude showed a tendency to be higher in Phase 5 relative to Phase 3. However, because of the high degree of variability in the data, this difference was only significant in the low-frequency range (see Table 2 and Figure 4). When the natural progression of sleep was interrupted through the repeated application of acoustic stimulation for 50 min, there was no increase in RSA transfer function magnitude between Phases 3 and 5 (Table 2). The left panel for Figure 4 displays the results for one of the repetitive arousal conditions (30-s RA).
Table 2.
Estimates of Model Parameters
| Parameter | Phase | CONDITION |
|||
|---|---|---|---|---|---|
| Control (Mean ±SE) | 30-s RA (Mean ±SE) | 1-min RA (Mean ±SE) | 2-min RA (Mean ±SE) | ||
| ABR Gain (ms/mmHg) | |||||
| Impulse Response | 3 | 1.88 ± 0.18 | 2.23 ± 0.44 | 1.81 ± 0.81 | 2.30 ± 0.71 |
| Magnitude | 5 | 4.32 ± 2.05 | 3.11 ± 1.17 | 3.49 ± 0.95 | 2.50 ± 0.68 |
| LF Gain | 3 | 0.054 ± 0.005 | 0.068 ± 0.013 | 0.042 ± 0.011 | 0.048 ± 0.011 |
| 5 | 0.089 ± 0.019* | 0.054 ± 0.010 | 0.046 ± 0.008 | 0.046 ± 0.009 | |
| HF Gain | 3 | 0.020 ± 0.002 | 0.028 ± 0.006 | 0.027 ± 0.015 | 0.022 ± 0.010 |
| 5 | 0.046 ± 0.017 | 0.031 ± 0.009 | 0.036 ± 0.007 | 0.027 ± 0.006 | |
| OverallGain | 3 | 0.030 ± 0.003 | 0.040 ± 0.006 | 0.031 ± 0.013 | 0.030 ± 0.010 |
| 5 | 0.056 ± 0.018 | 0.038 ± 0.009 | 0.039 ± 0.007 | 0.033 ± 0.007 | |
| RSA Gain (ms/L) | |||||
| Impulse Response | 3 | 140.16 ± 29.53 | 161.6 ± 47.7 | 127.8 ± 23.2 | 193.0 ± 52.1 |
| Magnitude | 5 | 142.55 ± 20.96 | 254.8 ± 58.0 | 212.0 ± 47.4 | 254.4 ± 129.6 |
| LF Gain | 3 | 7.14 ± 1.28 | 8.97 ± 2.87 | 6.48 ± 1.80 | 8.25 ± 1.79 |
| 5 | 11.35 ± 2.52* | 8.13 ± 2.17 | 7.93 ± 1.78 | 9.62 ± 2.17 | |
| HF Gain | 3 | 1.28 ± 0.26 | 1.44 ± 0.15 | 1.46 ± 0.46 | 2.09 ± 0.43 |
| 5 | 1.71 ± 0.33 | 1.90 ± 0.34 | 1.77 ± 0.29 | 2.46 ± 0.79 | |
| Overall Gain | 3 | 3.02 ± 0.48 | 3.68 ± 0.93 | 2.95 ± 0.84 | 3.92 ± 0.80 |
| 5 | 4.58 ± 0.94 | 3.75 ± 0.82 | 3.61 ± 0.68 | 4.59 ± 1.17 | |
P<0.05 from phase 3 of same condition.
Figure 4.

Estimated subject-averaged transfer functions (magnitude plots) for the RSA component of the model in Phase 3 (filled circles) and Phase 5 (open triangles) in the control condition (left panel) compared to the corresponding cases for the 30-s RA condition. The subject-averaged Phase 1 plots are displayed for reference. Note that the tendency for RSA gain to increase from Phase 3 to Phase 5 in uninterrupted sleep does not occur following exposure to repetitive arousals.
The transfer function magnitude plots for the ABR component of the model for the control condition are shown in the left panel of Figure 5. Here, it is quite clear that the baroreflex transfer function increased in magnitude during the progression from Phase 3 to Phase 5, when there was uninterrupted sleep. In contrast, following 50 min of acoustically-induced arousals produced repeatedly every 30 s, the increase in ABR transfer function magnitude did not occur. This is reflected in the ABR gain values displayed in Table 2.
Figure 5.

Estimated subject-averaged transfer functions (magnitude plots) for the ABR component of the model in Phase 3 (filled circles) and Phase 5 (open triangles) in the control condition (left panel) compared to the corresponding cases for the 30-s RA condition. The subject-averaged Phase 1 plots are displayed for reference. Note that the tendency for ABR gain to increase from Phase 3 to Phase 5 in uninterrupted sleep does not occur following exposure to repetitive arousals.
DISCUSSION
Autonomic Effects of Obstructive Sleep Apnea: Intermittent Hypoxia Vs Repetitive Arousal
Three major factors accompany each cycle of obstructive apnea: hypoxia, large changes in intrathoracic pressure, and transient arousal from sleep. Several recent studies involving animal models have provided useful insight into the relative importance of these individual factors in producing the chronic abnormalities of autonomic cardiovascular control associated with OSA.20 Using an elegant canine model of obstructive apnea, Brooks et al.21 were able to produce nocturnal and daytime hypertension by exposing the animals to artificially-induced periodic airway obstructions for several weeks. On the other hand, sustained exposure to periodic acoustically-induced arousals without prior upper airway obstruction led only to nocturnal hypertension with no carryover effect in the daytime. In a rat model, Fletcher et al.22,23 have shown that sustained hypertension develops after a few weeks of exposure to intermittent hypoxia without any accompanying upper airway obstruction. In a porcine model, Chen and Scharf found the cardiovascular effects of simulated central apneas to be greater than those resulting from obstructive apneas of similar durations.24 These studies, taken together, suggest that although OSA is characterized by large intrathoracic pressure changes, episodic hypoxemia, and arousal-induced sleep fragmentation; hypoxic stimulation appears to be the dominant factor that produces the chronic alterations in autonomic cardiovascular control. On the other hand, the aforementioned studies were conducted on animal preparations. In humans, a retrospective study relating daytime plasma and urine norepinephrine levels to respiratory disturbance index, nocturnal arterial O2 saturation and arousal index found an independent association between the measures of daytime sympathetic activity and movement arousals.15 In a recent study, 24-hour ambulatory blood pressure was monitored in 46 subjects with moderate-to-severe OSA before and after 2 weeks of either continuous positive airway pressure (CPAP) therapy or sham-CPAP with supplemental nocturnal oxygen.25 Following the treatment period, subjects treated with CPAP showed a significant reduction in daytime and nighttime blood pressures, whereas no changes were found in those subjects treated with sham-CPAP and supplemental nocturnal oxygen. This result suggests that elimination of intermittent hypoxia during the night per se did not have a major effect on cardiovascular autonomic control, and that the effectiveness of CPAP therapy was presumably due to the reduction in arousals and/or intrathoracic pressure changes. Thus, the relative contribution of repetitive arousal towards long-term impairment of cardiovascular control appears to differ between animals and humans.
Quantifying the Cumulative Effects of Arousal on Autonomic Control in Humans
The major finding of this study is that, although continuous exposure to repetitive arousals for a duration of approximately 1 hour does not produce any overt changes in mean heart rate or systolic or diastolic blood pressures, subtle changes in autonomic control can be detected through the application of a model-based approach to carefully examine the relationships linking respiration and SBP to heart rate variability. These cumulative effects are summarized in Figure 6. During unperturbed sleep onset, we found that baroreflex (ABR) gain increased with increasing depth of sleep. This was also the case with the RSA component, although the effect was substantially greater in the low-frequency region of the associated transfer function. However, ABR and RSA gains did not change significantly when sleep was interrupted by repetitive arousal. These findings suggest that the transition from Phase 3 to Phase 5 is accompanied by a reduction in sympathetic activity and/or increase in vagal tone, consistent with what has been reported in previous studies.10–15 Exposure to repetitive arousal appears to hinder this natural shift during sleep onset in sympathovagal balance towards greater vagal predominance and lower sympathetic tone. The periodicity with which the arousals are elicited appears to have no differential impact on their cumulative effect on autonomic control.
Figure 6.

Comparison of the estimated average values for baroreflex gain (top panel) and low-frequency power of systolic blood pressure oscillations (LFPSBP) in Phase 3 vs Phase 5 under control, 30 s RA, 1 min RA, and 2 min RA conditions.
Another important observation from our study is that all 3 RA conditions led to an increase in the power of low-frequency oscillations in SBP in Phase 5. Increases in LFPSBP have been found to occur in association with conditions that increase sympathetic activation, such as head-up tilt, mental stress, and heart failure.26–28 Thus, our findings suggest that there was a gradual accumulation of the effects of sympathetic activation following each arousal, and that the progressive buildup of sympathetic tone offsets the tendency for sympathetic withdrawal that accompanies natural sleep onset.
Modeling Considerations
We have successfully employed the multivariate model displayed in Figure 2 to detect abnormalities in autonomic cardiovascular control in OSA under a variety of conditions.16,29,30 The key strength of this approach is that it enables the partitioning of fluctuations in RRI (or equivalently, heart rate) into contributions that are associated directly with respiration and contributions that result from baroreflex buffering of fluctuations in BP. By relating these RRI components to their corresponding “inputs” (i.e., respiration and BP), the model allows the estimation of the underlying transfer functions (“RSA” and “ABR”). In doing so, we are able to circumvent some of the limitations inherent in other approaches (e.g., spectral analysis) that focus only on heart rate variability or blood pressure variability.27 Illustrative of the potential problems with employing spectral analysis of heart rate variability to quantify autonomic function are the isolated changes in HFPRRI and LHR following 30-s RA and 1-min RA, respectively, as reported in Table 1. Both of these conventional measures of heart rate variability do not take into account differences in respiration between Phase 3 and Phase 5. For instance, an increase in ventilation in Phase 5 relative to Phase 3 in some of the subjects would contribute to an increase in RRI spectral power in the high-frequency range, and thus lead to an increase in HFPRRI and decrease in LHR.
An important feature of our model-based approach is that our estimates of baroreflex gain are computed only after the component of the RRI fluctuations linearly correlated to respiration has been removed from RRI. In other methods that employ spontaneous blood pressure fluctuations for estimating baroreflex sensitivity, such as the “spectral” or “sequence”31 methods, the contribution of respiration to the fluctuations in RRI are not taken into consideration. A recent study has shown that excluding the effect of respiration on RRI can lead to the introduction of a significant amount of bias into the computation of baroreflex sensitivity.32
Previous implementations of this model assumed stationarity in the data, thus requiring that our analyses be applied to data segments in which there were no obvious trends or apparent changes in dynamic behavior. We have recently extended the model to incorporate time-varying transfer functions.33 This allows us to bypass the stationarity assumption, and thus apply the model to situations in which ABR and/or RSA dynamics are suspected to be evolving with time, e.g., during and immediately following arousals. We have applied the time-varying model to this study, since our measurements were collected during a period in which a complex series of transitions were occurring: from quiet wakefulness immediately prior to the start of sleep onset to the time during which stable Stage 2 sleep was first identified. There are, however, differences in the details of the methodology between this version of the model and the model published by Blasi et al.33 These relate primarily to the use of Meixner basis functions in this study instead of the Laguerre set that we had previously employed. Meixner basis functions have been shown to produce improved parameter estimation results when the system under study contains significant time delays.17
Limitations of the Study
To determine the cumulative effects of repetitive arousal on autonomic control, we induced transient arousals in normal subjects using acoustic stimulation. This differs from the usual mechanism for arousal in OSA, which is believed to involve the buildup of chemical drive and respiratory effort beyond specific thresholds prior to eliciting a response from the reticular activating system.34 Thus, in our study, some portion of the cardiorespiratory response to arousal could have originated from direct stimulation generated by the cochlear receptors. Moreover, by excluding the concurrent increases in chemical drive that accompany arousals in obstructive apneas, we have also ignored the possibility that arousal and hypoxia could have synergistic effects on autonomic function.
Another important limitation of this study is that the sequential arousals were carried out over a period of 50 minutes only. The effects on autonomic control were thus very small, as evidenced by the lack of any measurable changes in mean blood pressure or mean heart rate. Nevertheless, it is important to note that even this very minimalist intervention affected autonomic control. Future work should address the question of whether repetitive arousals applied over a longer total duration will amplify the small cumulative effects found in the present study. For instance, would cumulative exposure to repetitive arousal elicited over the entire sleep duration lead to measurable changes in morning cardiovascular autonomic function, as reflected in heart rate variability and blood pressure variability or even mean blood pressure? Furthermore, the current study was carried out on healthy young subjects. It would be important to determine the direction and magnitude of the cumulative autonomic effects produced by repetitive arousal in subjects with OSA or hypertensive subjects without OSA.
CONCLUSIONS
In summary, using spectral and model-based analyses of cardiovascular variability, we have found that exposure to repetitive acoustically-induced arousals over durations approximating an hour produces cumulative effects on autonomic control that are subtle and can only be detected when advanced signal processing methods are employed. More specifically, the increases in baroreflex and RSA gains that normally accompany increasing sleep depth are prevented from occurring.
APPENDIX 1: ESTIMATION OF THE MODEL IMPULSE RESPONSES
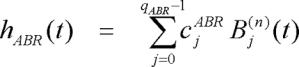
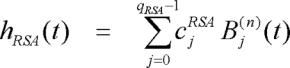
To reduce the number of parameters to be estimated, each of the unknown impulse responses in Equation (1) was expanded as the sum of several weighted Meixner basis functions (MBF).17
 |
(A1) |
 |
(A2) |
where the Bj(n)(t) represents the j-th order discrete-time orthonormal Meixner function with n-th order of generalization which determines how late the MBF will start to fluctuate, and cjABR and cjRSA are the corresponding unknown weights that are assigned to Bj(n)(t) in the ABR and RSA impulse responses, respectively. Meixner basis functions (MBF) are a generalization of the discrete Laguerre basis functions (LBF). First, the LBF were generated. Then, the LBF were transformed to MBF. The j-th order LBF is defined as follows over the interval 0 ≤ t ≤ M-1:
| (A3a) |
and
| (A3b) |
qABR and qRSA represent the total number of Laguerre functions used in the expansion of the ABR and RSA impulse responses, respectively. In Equations (A3a) and (A3b), the parameter α (0 < α < 1) determines the rate of exponential decline of the Laguerre functions, and is selected such that, for given M, qABR and qRSA, the values of the constructed impulse response become insignificant as t approaches M. The orthogonal matrix that transforms the LBF to the MBF can be expressed as
| (A4) |
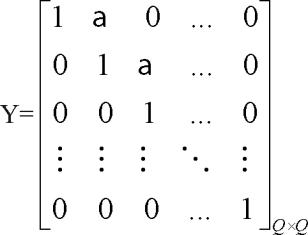
where n=0,1,2,…, and Y is an upper band matrix given as follows:
 |
(A5) |
and X(n) is an inversion of the Cholesky factorization of Y(n){Y(n)}T.
Substituting Equations (A1) and (A2) into Equation (2), we obtain, after some algebraic manipulation:
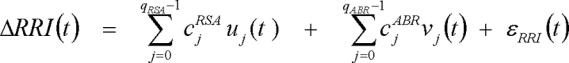 |
(A6) |
where uj(t) and vj(t) are new derived variables, defined as follows:
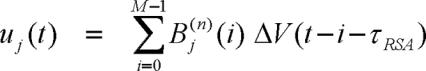 |
(A7) |
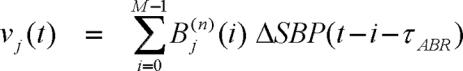 |
(A8) |
Equation(A6) becomes the new linear relation with unknown parameters cjRSA (0 ≤ j ≤ qRSA) and cjABR (0 ≤ j ≤ qABR) that can be estimated using least-squares minimization. However, note that Equation (A6) contains far fewer unknown parameters (qRSA + qABR ≪ 2M) than Equation (1).
First, the least-squares minimization procedure described above was repeated for a range of values for the delays (τABR and τRSA), the order of generalization (n from 0 to 5), and Meixner function orders (qABR and qRSA from 4 to 8). For each combination of delays, the order of generalization, and Meixner function orders, a metric of the quality of fit, known as the “minimum description length” (MDL), was computed.35 MDL was computed as follows:
| (A9) |
where JR is the variance of the residual errors between the measured data and the predicted output. Note that MDL decreases as JR decreases but increases with increasing model order. Selection of the “optimal” candidate model was based on a global search for the minimum MDL; in addition, this “optimal” solution had to satisfy the condition that the cross-correlations between the residual errors and past values of the two inputs (ΔV(t) and ΔSBP(t)) were statistically indistinguishable from zero. Once the optimal parameter values were determined, the ABR and RSA impulse responses were computed using Equations (A1) and (A2).
Finally, the recursive least squares (RLS) algorithm was used to estimate the autoregressive model coefficients at each time step. Basically, by using the RLS algorithm, the model coefficients were estimated by minimizing the residual, sum of squared error between the model prediction and the data. To make the results less sensitive to the remote past, the squared error between the model prediction and the data (e) was weighted as follows
 |
(A10) |
where λ is a forgetting factor and 0<λ<1. The optimum λ allows an RLS algorithm that has the fastest convergence and the most robustness.
The RLS algorithm was applied to each data set multiples time for λ from 0.88 to 0.98. The λ that minimized the mean square error between the model prediction and the data was selected.
APPENDIX 2: TABLE OF ABBREVIATIONS
| Symbol/Abbreviation | Explanation |
|---|---|
| ABR | Baroreflex component of the model |
| BP | Blood pressure (arterial) |
| ΔRRI(t) | Fluctuation in RRI about the mean level at time t |
| ΔSBP(t) | Fluctuation in SBP about the mean level at time t |
| ΔV(t) | Change in incremental lung volume about the mean at time t |
| DBP | Diastolic blood pressure |
| hABR(t) | Impulse response function of the ABR component |
| hRSA(t) | Impulse response function of the RSA component |
| HRV | Heart rate variability |
| LFPDBP | Low-frequency power of diastolic blood pressure variability |
| LFPSBP | Low-frequency power of systolic blood pressure variability |
| LHR | Ratio of low-frequency power to high-frequency power of RRI variability |
| RRI | R-R interval |
| RSA | Respiratory sinus arrhythmia component of model |
| SBP | Systolic blood pressure |
| τABR | Latency associated with the baroreflex (ABR) component of the model |
| τRSA | Latency associated with the RSA component of the model |
Footnotes
Disclosure Statement
This was not an industry supported study. The authors have indicated no financial conflicts of interest.
REFERENCES
- 1.Peppard PE, Young T, Palta M, Skatrud J. Prospective study of the association between sleep-disordered breathing and hypertension. N Engl J Med. 2000;342:1378–84. doi: 10.1056/NEJM200005113421901. [DOI] [PubMed] [Google Scholar]
- 2.Shahar E, Whitney CW, Redline S, et al. Sleep-disordered breathing and cardiovascular disease. Cross-sectional results of the Sleep Heart Health Study. Am J Respir Crit Care Med. 2001;163:19–25. doi: 10.1164/ajrccm.163.1.2001008. [DOI] [PubMed] [Google Scholar]
- 3.Leung R, Bradley D. Sleep apnea and cardiovascular disease. Am J Respir Crit Care Med. 2001;164:2147–65. doi: 10.1164/ajrccm.164.12.2107045. [DOI] [PubMed] [Google Scholar]
- 4.Morgan BJ, Crabtree DC, Puleo DS, Badr MS, Toiber F, Skatrud JB. Neurocirculatory consequences of abrupt change in sleep state in humans. J Appl Physiol. 1996;80:1627–36. doi: 10.1152/jappl.1996.80.5.1627. [DOI] [PubMed] [Google Scholar]
- 5.Catcheside PD, Chiong SC, Orr RS, Mercer J, Saunders NA, McEvoy RD. Acute cardiovascular responses to arousal from non-REM Sleep during normoxia and hypoxia. Sleep. 2001;24:895–902. doi: 10.1093/sleep/24.8.895. [DOI] [PubMed] [Google Scholar]
- 6.Blasi A, Jo H, Valladares E, Morgan BJ, Skatrud JB, Khoo MCK. Cardiovascular variability after arousal from sleep: time-varying spectral analysis. J Appl Physiol. 2003;95:1394–404. doi: 10.1152/japplphysiol.01095.2002. [DOI] [PubMed] [Google Scholar]
- 7.Trinder J, Allen N, Kleiman J, et al. On the nature of cardiovascular activation at an arousal from sleep. Sleep. 2003;26:543–51. [PubMed] [Google Scholar]
- 8.Ringler J, Basner RC, Shannan R, et al. Hypoxia alone dose not explain blood pressure elevations after obstructive apneas. J Appl Physiol. 1990;69:2143–8. doi: 10.1152/jappl.1990.69.6.2143. [DOI] [PubMed] [Google Scholar]
- 9.Davies RJO, Belt PJ, Roberts SJ, Ali NJ, Standling JR. Arterial blood pressure responses to graded transient arousal from sleep in normal humans. J Appl Physiol. 1993;74:1123–30. doi: 10.1152/jappl.1993.74.3.1123. [DOI] [PubMed] [Google Scholar]
- 10.Bristow JD, Honour AJ, Pickering TG, Sleight P. Cardiovascular and respiratory changes during sleep in normals and hypertensive subjects. Cardiovasc Res. 1969;3:476–85. doi: 10.1093/cvr/3.4.476. [DOI] [PubMed] [Google Scholar]
- 11.Mancia G, Zanchetti A. Cardiovascular regulation during sleep. In: Orem J, Barnes CD, editors. Physiology in sleep, New York: Academic Press; 1980. pp. 1–55. [Google Scholar]
- 12.George CF, Kryger MH. Sleep and control of heart rate. Clin Chest Med. 1985;6:595–601. [PubMed] [Google Scholar]
- 13.Zemaityte D, Varoneckas G, Sokolov E. Heart rhythm control during sleep. Psychophysiology. 1984;21:279–89. doi: 10.1111/j.1469-8986.1984.tb02935.x. [DOI] [PubMed] [Google Scholar]
- 14.Carrington MJ, Barbieri R, Colrain IM, Crowley KE, Kim Y, Trinder J. Changes in cardiovascular function during the sleep onset period in young adults. J Appl Physiol. 2005;98:468–76. doi: 10.1152/japplphysiol.00702.2004. [DOI] [PubMed] [Google Scholar]
- 15.Loredo JS, Ziegler MG, Ancoli-Israel S, Clausen JL, Dimsdale JE. Relationship of arousals from sleep to sympathetic nervous system activity and BP in obstructive sleep apnea. Chest. 1999;116:655–9. doi: 10.1378/chest.116.3.655. [DOI] [PubMed] [Google Scholar]
- 16.Belozeroff V, Berry RB, Khoo MCK. Model-based assessment of autonomic control in obstructive sleep apnea syndrome. Sleep. 2003;26:65–73. doi: 10.1093/sleep/26.1.65. [DOI] [PubMed] [Google Scholar]
- 17.Asyali MH, Juusola M. Use of Meixner functions in estimation of Volterra Kernels of nonlinear systems with delay. IEEE Trans Biomed Eng. 2005;52:229–37. doi: 10.1109/TBME.2004.840187. [DOI] [PubMed] [Google Scholar]
- 18.Haykin S. Adaptive Filter Theory, 3rd ed. Upper Saddle River, NJ: Prentice-Hall; 1996. Linear prediction; pp. 562–88. [Google Scholar]
- 19.Hirsch JA, Bishop B. Respiratory sinus arrhythmia in humans: how breathing pattern modulates heart rate. Am J Physiol Heart Circ Physiol. 1981;241:H620–9. doi: 10.1152/ajpheart.1981.241.4.H620. [DOI] [PubMed] [Google Scholar]
- 20.Schaub CG, Schneider H, O'Donnell CP. Mechanisms of acute and chronic blood pressure elevation in animal models of obstructive sleep apnea. In: Bradley TD, Floras JS, editors. Sleep apnea: implications in cardiovascular and cerebrovascular disease. New York: Marcel Dekker; 2000. pp. 159–79. [Google Scholar]
- 21.Brooks D, Horner RL, Kozar LF, Render-Teixera CLB, Phillipson EA. Obstructive sleep apnea as a cause of systemic hypertension: evidence from a canine model. J Clin Invest. 1997;99:106–19. doi: 10.1172/JCI119120. [DOI] [PMC free article] [PubMed] [Google Scholar]
- 22.Fletcher EC, Lesske J, Behm R, Miller CC, Unger T. Carotid chemoreceptors, systemic blood pressure, and chronic episodic hypoxia mimicking sleep apnea. J Appl Physiol. 1992;72:1978–84. doi: 10.1152/jappl.1992.72.5.1978. [DOI] [PubMed] [Google Scholar]
- 23.Fletcher EC, Lesske J, Culman J, Miller CC, Unger T. Sympathetic denervation blocks blood pressure elevation in episodic hypoxia. Hypertension. 1992;20:612–9. doi: 10.1161/01.hyp.20.5.612. [DOI] [PubMed] [Google Scholar]
- 24.Chen L, Scharf SM. Comparative hemodynamic effects of periodic obstructive and simulated central apneas in sedated pigs. J Appl Physiol. 1997;83:485–94. doi: 10.1152/jappl.1997.83.2.485. [DOI] [PubMed] [Google Scholar]
- 25.Norman D, Loredo JS, Nelesen RA, et al. Effects of continuous positive airway pressure versus supplemental oxygen on 24-hour ambulatory blood pressure. Hypertension. 2006;47:840–5. doi: 10.1161/01.HYP.0000217128.41284.78. [DOI] [PubMed] [Google Scholar]
- 26.Malliani A, Pagani M, Lombardi F, Cerutti S. Cardiovascular neural regulation explored in the frequency domain. Circulation. 1991;84:482–92. doi: 10.1161/01.cir.84.2.482. [DOI] [PubMed] [Google Scholar]
- 27.Parati G, Saul JP, Di Rienzo M, Mancia G. Spectral analysis of blood pressure and heart rate variability in evaluating cardiovascular regulation. A critical appraisal. Hypertension. 1995;25:1276–86. doi: 10.1161/01.hyp.25.6.1276. [DOI] [PubMed] [Google Scholar]
- 28.Radaelli A, Perlangeli S, Cerutti MC, et al. Altered blood pressure variability in patients with congestive heart failure. J Hypertens. 1999;17:1905–10. doi: 10.1097/00004872-199917121-00020. [DOI] [PubMed] [Google Scholar]
- 29.Jo JA, Blasi A, Valladares E, Juarez R, Baydur A, Khoo MCK. Model-based assessment of autonomic control in obstructive sleep apnea syndrome during sleep. Am J Respir Crit Care Med. 2003;167:128–36. doi: 10.1164/rccm.200202-096OC. [DOI] [PubMed] [Google Scholar]
- 30.Belozeroff V, Berry RB, Sassoon CSH, Khoo MCK. Effects of CPAP therapy on cardiovascular variability in obstructive sleep apnea: a closed loop analysis. Am J Physiol Heart Circ Physiol. 2002;282:H110–21. doi: 10.1152/ajpheart.2002.282.1.H110. [DOI] [PubMed] [Google Scholar]
- 31.Parati G, Di Rienzo M, Mancia G. How to measure baroreflex sensitivity: from the cardiovascular laboratory to daily life. J Hypertens. 2000;18:7–19. [PubMed] [Google Scholar]
- 32.Lucini D, Porta A, Milani O, Baselli G, Pagani M. Assessment of arterial and cardiopulmonary baroreflex gains from simultaneous recordings of spontaneous cardiovascular and respiratory variability. J Hypertens. 2000;18:281–6. doi: 10.1097/00004872-200018030-00007. [DOI] [PubMed] [Google Scholar]
- 33.Blasi A, Jo J, Valladares E, Juarez R, Baydur A, Khoo MCK. Autonomic cardiovascular control following transient arousal from sleep: A time-varying closed-loop model. IEEE Trans Biomed Eng. 2006;53:74–82. doi: 10.1109/TBME.2005.859789. [DOI] [PubMed] [Google Scholar]
- 34.Berry RB, Gleeson K. Respiratory arousal from sleep: mechanisms and significance. Sleep. 1997;20:654–75. doi: 10.1093/sleep/20.8.654. [DOI] [PubMed] [Google Scholar]
- 35.Rissanen J. Estimation of structure by minimum description length. Circ Sys Sig Proc. 1982;1:395–406. [Google Scholar]