

Abstract
Study Objectives:
Rapid-eye-movement sleep (REM sleep) physiologically entails arterial pressure surges. Pressure surges may lead to acute cardiovascular events in risk conditions such as arterial hypertension. We investigated whether arterial hypertension alters the rate of occurrence and the characteristics of the pressure surges during REM sleep.
Design:
Spontaneously hypertensive rats (SHR) were compared with Wistar-Kyoto normotensive controls (WKY) and a group of SHR, in which hypertension was prevented by long-term enalapril treatment (ena-SHR).
Setting:
N/A.
Subjects:
Seven male rats per group.
Interventions:
Instrumentation with electrodes for polygraphic recordings, a nasal thermistor for measuring ventilatory period, and an arterial catheter for measuring arterial pressure and heart period.
Measurements and Results:
SHR showed a significant increase in the rate of occurrence but a similar magnitude of the pressure surges during REM sleep, with respect to WKY and ena-SHR. The pressure surges were associated with a decrease of heart period and an increase of electroencephalographic theta frequency, which were significantly less pronounced in SHR than in either WKY or ena-SHR. The ventilatory period showed only a modest increase before the surges without significant differences among the groups.
Conclusions:
Pressure surges independent of sleep apnea occur during REM sleep at a rate increased in SHR with respect to their controls, supporting a potential role of REM sleep in triggering acute cardiovascular events in arterial hypertension. The characteristics of the pressure surges suggest that, in SHR, the underlying central autonomic commands are increased in frequency, but not in magnitude, by arterial hypertension.
Citation:
Berteotti C; Franzini C; Lenzi P; Zoccoli G; Silvani A. Surges of arterial pressure during REM sleep in spontaneously hypertensive rats. SLEEP 2008;31(1):111-117.
Keywords: Sleep, REM, autonomic nervous system, hypertension, rats, inbred SHR, blood pressure, heart rate, respiration, theta rhythm, enalapril
RAPID-EYE-MOVEMENT (REM) SLEEP IS A STATE OF HEIGHTENED VEGETATIVE VARIABILITY,1 THE MANIFESTATIONS OF WHICH, IN HEALTHY HUMAN subjects, include phasic increases (surges) of arterial pressure.2,3 In physiologic conditions, pressure surges have also been described during REM sleep in animal models,4–9 thus being a remarkably robust feature of this sleep state.
Although pressure surges may result from an enhancement of cardiovascular variability in different behavioral conditions, their characteristics appear of substantial interest during REM sleep. The pressure surges in REM sleep critically depend on central neural mechanisms,10 which may be intrinsic to the brain processes of this state. Moreover, it has been hypothesized that the pressure surges during REM sleep in the last part of the night contribute to the increased incidence of acute cardiovascular events,11 which is observed in the early morning hours after awakening.12 In fact, pressure surges may induce atherosclerotic plaque rupture and thrombosis, representing an acute risk factor for myocardial infarction, sudden cardiac death, and stroke.13 A major risk factor for atherosclerosis and coronary heart disease is arterial hypertension, which has a very high prevalence in the general population.14
We investigated the effect of arterial hypertension on the arterial pressure surges during REM sleep in spontaneously hypertensive rats (SHR). SHR are a model widely studied to accelerate the understanding of human essential hypertension15,16 due to the opportunity to control environmental and genetic confounders. To exploit this opportunity, we contrasted SHR with their progenitor strain of normotensive Wistar-Kyoto rats (WKY) as well as with a group of SHR (ena-SHR), in which we prevented the development of hypertension by means of a long-term enalapril treatment.17
In SHR, WKY, and ena-SHR, we analyzed the frequency of occurrence and the magnitude of the pressure surges during REM sleep as well as the associated changes in heart period (HP) and ventilatory period (VP). Episodes of tachycardia may be associated with the pressure surges during REM sleep,7,9 further increasing cardiac oxygen consumption. On the other hand, the measurement of the VP during the pressure surges indicates whether the surges are associated with sleep apneas, which occur during REM sleep in SHR18 and may also increase arterial pressure.19
METHODS
Experiments were performed on 14 male rats of the SHR strain and 7 male rats of the WKY strain (Charles River, Calco, Italy), which were kept on a light-dark cycle of 12-hour periods (light on at 0900), were in an ambient temperature of 23°C, and had free access to food and water. The study protocol was approved by the Bologna University ethics committee on animal experimentation.
Pharmacologic Treatment
The ena-SHR group consisted of 7 SHR, which were subjected to a long-term pharmacologic inhibition of the angiotensin-converting enzyme to prevent the development of arterial hypertension. The treatment consisted of enalapril maleate (Sigma-Aldrich, Milano, Italy) dissolved in drinking water from the fourth week of age to the end of the recordings. The drug concentration in water was adjusted daily for each rat based on measurements of body weight and water consumption in order to achieve a dose of 25 to 30 mg/kg day.17
Surgical Procedures
At the age of 9 weeks, rats underwent surgery under general anesthesia (halothane, Sigma-Aldrich, Milano, Italy, 1%–2%, n2o 70%, and balance o2) using sterile conditions and with the body temperature maintained at 37°C with a heating pad. Rats were implanted as previously described20 with miniature screw electrodes for electroencephalographic recordings, wire electrodes in the nuchal muscles for electromyographic recordings, and a Silastic (Degania Silicone Ltd, Degania Bet, Israel) catheter in the abdominal aorta via the femoral artery to measure arterial pressure and heart period (HP) and to withdraw blood samples. In addition, a miniature custom-built thermistor was inserted in the nasal cavity through the nasal bone to measure the VP. The catheter was tunneled subcutaneously and fixed to the skull together with the electrodes and the thermistor by dental acrylic. Ketoprofen (Sanofi-Aventis, Milano, Italy, 1 mg/100 g body weight), benzilpenicillin benzatinic (Fournier Pharma, Segrate, Italy, 15,000 IU/100 g body weight), and streptomycin sulphate (Bristol-Myers Squibb, Roma, Italy, 20,000 IU/100 g body weight) were administered subcutaneously upon completion of the surgical procedures.
Experimental Protocol
After a 1-week postoperative recovery, the recordings were performed for 4 consecutive days from 1000 to 1800 with the animals undisturbed and freely moving in their own cages. The arterial pressure signal (P23 transducer, Statham, Hato Rey, Puerto Rico) was low-pass filtered (< 100 Hz) and digitized at 1024 Hz. The electroencephalogram, electromyogram, and ventilation signals were filtered (0.3–60 Hz, 100–1000 Hz, and 0.3–15 Hz, respectively) and digitized at 128 Hz. Data acquisition and analysis was performed with custom software developed in C and MATLAB (The MathWorks Inc., Natick, MA, USA) languages. On the fifth recording day, a small-caliber polyethylene tube (20 μL in volume) was connected to the arterial catheter to obtain blood samples (150 μL), which were immediately analyzed (Gem 3000, Instrumentation Laboratory, Milano, Italy).
Discrimination of REM Sleep
REM sleep was visually scored on 2-second epochs following previously described criteria.20 In particular, REM sleep was scored when theta waves were predominant in the electroencephalogram and the electromyogram displayed atonia with occasional muscle twitches. Epochs of intermediate sleep, when the electroencephalogram displayed prominent sleep spindles on a background of theta wave activity, were identified and excluded from the analysis.
Signal Processing
The arterial pressure, electroencephalogram, and ventilation signals were analyzed on all recorded REM sleep episodes with duration of 30 seconds or longer, which resulted in 1768 episodes for the whole study group. The beat-to-beat time series of mean arterial pressure (MAP) and HP were determined from the arterial pressure signal. MAP was computed as the average arterial pressure in each cardiac cycle, and HP was determined as the time interval between the onsets of successive systolic upstrokes. On consecutive epochs of 1-second duration and 0.75-second overlap, the time intervals between successive points (zero-crossings) in which the band-pass filtered (4–12 Hz, 2-pole Butterworth filter) electroencephalographic signal switched from negative to positive were determined, and the reciprocal of their average value was taken as the frequency of the theta rhythm (THF) in each epoch.9 The VP was determined automatically from the ventilation signal in each REM sleep episode, and the accuracy of the determination was visually checked in all the recordings. The time series of all the signals were resampled at 16 Hz by piecewise cubic Hermite interpolation. The time series of MAP and HP were then low-pass filtered (< 0.8 Hz, 3-pole Butterworth filter) to focus the analysis on spontaneous fluctuations at frequencies lower than the breathing rate.
Analysis of the Pressure Surges in REM Sleep
The pressure surges during REM sleep were automatically detected when MAP increased more than 15 mm Hg for longer than 1 second above its mean value in the REM sleep episode. The rate of occurrence of these surges was computed as the number of pressure surges per 10-minute time spent in REM sleep. The time series of MAP, HP, THF, and VP during each pressure surge were normalized by subtracting their baseline values, which were computed as the respective mean values in the REM sleep episode, in which the surge occurred. For each rat, the normalized time series during the pressure surges were subjected to a coherent averaging by synchronizing them at the MAP peak and computing their respective median values at each time point in the interval from 10 seconds before the MAP peak to 8 seconds after it. Such time interval was chosen in preliminary experiments to include the changes in HP, THF, and VP that were temporally related to the pressure surges. The positive peak values of MAP, THF, and VP and the negative peak value of HP in this interval were finally determined for each rat.
To check whether differences among the groups critically depended on the MAP detection threshold of the pressure surges, ancillary analyses were also performed utilizing detection thresholds of 10 mm Hg and 20 mm Hg.
Statistical Analysis
Data were reported as mean ± SEM within group and analyzed by 1-way analysis of variance with 3 levels (SHR, WKY, and ena-SHR). When a significant difference among the groups was detected by analysis of variance, 2 preplanned comparisons (SHR vs WKY and SHR vs ena-SHR) were performed with independent-sample t-tests. Statistical analyses were performed with the SPSS software (SPSS Inc., Chicago, IL, USA) with P < 0.05 considered to be statistically significant.
RESULTS
The percentage of the recording time spent in REM sleep was 7.4 ± 0.3, 10.2 ± 0.8, and 6.8 ± 0.3 in SHR, WKY, and ena-SHR, respectively. This percentage differed significantly among groups (P < 0.001). In SHR, the percentage of the recording time spent in REM sleep was significantly lower than in WKY (P = 0.014) and did not differ significantly from that in ena-SHR (P = 0.150).
In all rats under study, surges of arterial pressure were readily evident in the raw recordings during REM sleep, an example of which is shown in Figure 1. The results of the coherent averaging of the pressure surges are shown in Figure 2. This analysis evidenced that, in all groups, HP decreased during the surges, reaching its minimum value before the MAP peak. THF and VP increased in all groups during the surges, peaking before the MAP peak.
Figure 1.

Representative example of raw recordings during a surge of arterial pressure (AP) in rapid-eye-movement sleep. Ventilation (VEN) showed a prominent variability throughout the pressure surge. The electroencephalogram (EEG) displayed a prevalent theta rhythm, which accelerated before the surge peak. The electromyogram (EMG) indicated muscle atonia, which was interrupted by a muscle twitch. The recordings were obtained in a spontaneously hypertensive rat, in which hypertension was prevented by means of long-term enalapril treatment.
Figure 2.
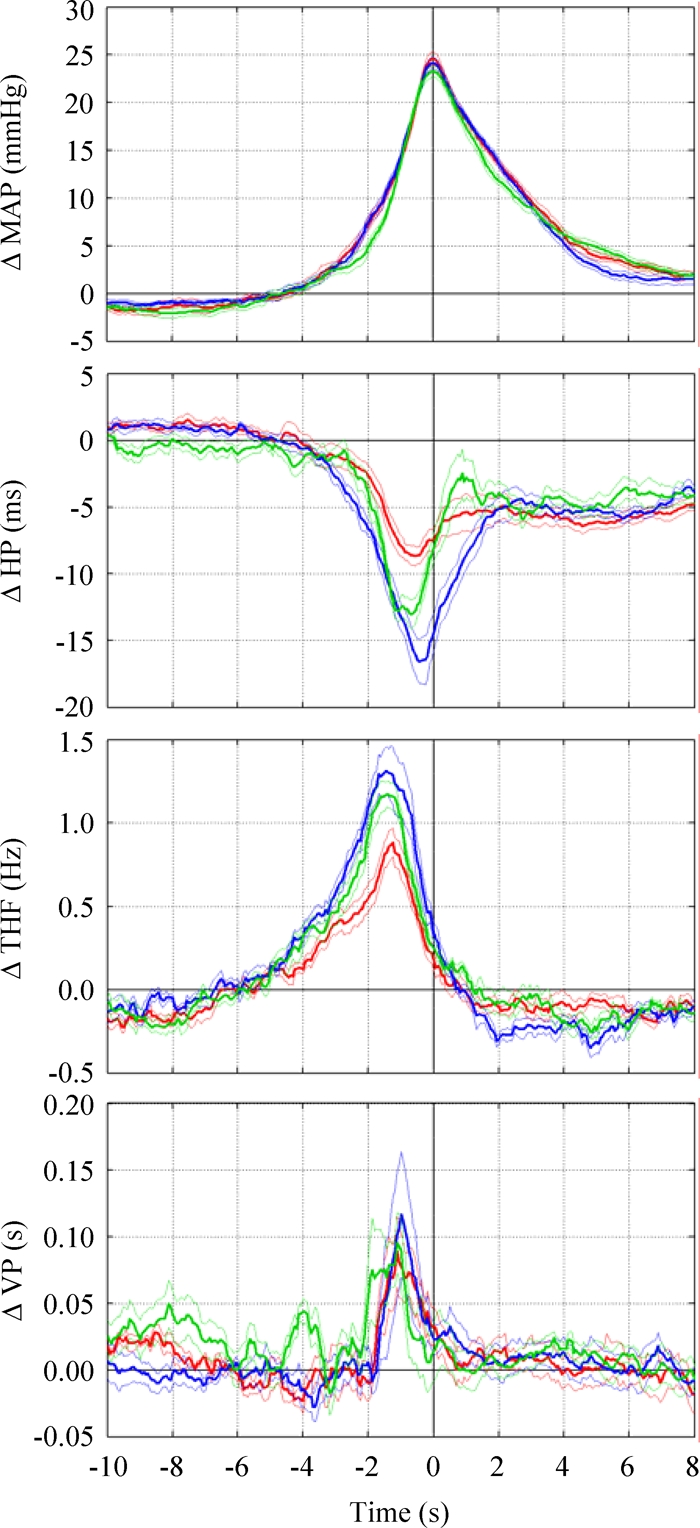
Results of the coherent averaging of the arterial pressure surges during rapid-eye-movement sleep. Data are mean ± SEM in spontaneously hypertensive rats (SHR, red lines), normotensive Wistar-Kyoto rats (blue lines), and enalapril-treated SHR (green lines) synchronized at the peak increase of mean arterial pressure (time 0). From top to bottom, the panels show the normalized changes in mean arterial pressure (Δ MAP), heart period (Δ HP), electroencephalographic theta frequency (Δ THF), and ventilatory period (Δ VP).
In each daily recording session, the number of pressure surges that were detected during REM sleep was 17 ± 1, 15 ± 2, and 10 ± 1 in SHR, WKY, and ena-SHR, respectively. The total number of surges that were detected and analyzed during REM sleep was 471, 433, and 287 in SHR, WKY, and ena-SHR, respectively. The number of pressure surges per 10 minutes of REM sleep differed among the groups (P < 0.001), being higher in SHR (4.9 ± 0.2) than in either WKY (3.2 ± 0.3, P = 0.001) or ena-SHR (3.1 ± 0.2, P < 0.001).
During the surges, the experimental groups differed in terms of the baseline MAP value (P < 0.001) but not in terms of the peak MAP increase (P = 0.310, Figure 3). The baseline MAP value was higher (P < 0.001) in SHR than in either WKY or ena-SHR.
Figure 3.

Baseline value (mean arterial pressure; MAP) and peak increase (Δ MAP) of MAP during the pressure surges in rapid-eye-movement sleep. Data are mean values in spontaneously hypertensive rats (SHR), Wistar-Kyoto rats (WKY), and enalapril-treated SHR (ena-SHR), with error bars indicating SEM and n = 7 per group. Analysis of variance: MAP, P < 0.001; Δ MAP, P = 0.310. *P < 0.05 vs SHR (t-test).
Both the baseline HP value and the peak HP reduction during the pressure surges differed among the experimental groups (P < 0.001, Figure 4). In SHR, the baseline HP value was lower than in ena-SHR (P = 0.007) and did not differ significantly from that in WKY (P = 0.091). The peak HP reduction was lower in magnitude in SHR than either in WKY (P = 0.004) or ena-SHR (P = 0.001).
Figure 4.

Baseline value of heart period (HP) and peak decrease of HP (Δ HP) during the pressure surges in rapid-eye-movement sleep. Data are mean values in spontaneously hypertensive rats (SHR), Wistar-Kyoto rats (WKY), and enalapril-treated SHR (ena-SHR), with error bars indicating SEM and n = 7 per group. Analysis of variance: HP, P < 0.001; Δ HP, P < 0.001. *P < 0.05 vs SHR (t-test).
The baseline THF value and the peak THF increase during the pressure surges differed among the experimental groups (P < 0.001 and P = 0.010, respectively; Figure 5). In SHR, the baseline THF value was higher than in WKY (P = 0.003) and did not differ significantly from that in ena-SHR (P = 0.307). The peak THF increase was lower in SHR than either in WKY (P = 0.009) or ena-SHR (P = 0.006).
Figure 5.

Baseline values of electroencephalographic theta frequency (THF) and peak increases in THF (Δ THF) during the pressure surges in rapid-eye-movement sleep. Data are mean values in spontaneously hypertensive rats (SHR), Wistar-Kyoto rats (WKY), and enalapril-treated SHR (ena-SHR), with error bars indicating SEM and n = 7 per group. Analysis of variance: THF, P < 0.001; Δ THF, P = 0.010. *P < 0.05 vs SHR (t-test).
VP could not be measured in 2 SHR and 2 WKY due to thermistor failure. The experimental groups differed in terms of the baseline VP value (P < 0.001) but not in terms of the peak VP increase during the surges (P = 0.648, Figure 6). In SHR, the baseline VP value was higher than in WKY (P = 0.010) and did not differ significantly from that in ena-SHR (P = 0.251).
Figure 6.

Baseline values of ventilatory period (VP) and peak increases in VP (Δ VP) during the pressure surges in rapid-eye-movement sleep. Data are mean values in spontaneously hypertensive rats (SHR, n = 5), Wistar-Kyoto rats (WKY, n = 5), and enalapril-treated SHR (ena-SHR, n = 7), with error bars indicating SEM. Analysis of variance: VP, P < 0.001; Δ VP, P = 0.648. *P < 0.05 vs SHR (t-test).
Table 1 reports the body weight during the recordings and the results of the analysis of the arterial blood samples in the groups under study. Because of technical (instrumentation) problems, we could not perform the arterial blood analysis in 1 WKY rat. The groups differed only for pH (P = 0.014), which was lower in SHR than in WKY (P < 0.001).
Table 1.
Body Weight and Arterial Blood Parameters
| SHR | WKY | ena-SHR | |
|---|---|---|---|
| Body weight, g | 244 ± 5 | 243 ± 9 | 241 ± 5 |
| pH | 7.44 ± 0.01 | 7.47 ± 0.01* | 7.44 ± 0.01 |
| pO2, mm Hg | 92 ± 3 | 90 ± 2 | 85 ± 2 |
| pCO2, mm Hg | 39 ± 1 | 37 ± 2 | 39 ± 1 |
| [Na+], mmol/L | 142 ± 1 | 142 ± 1 | 143 ± 1 |
| [K+], mmol/L | 3.6 ± 0.1 | 3.4 ± 0.1 | 3.7 ± 0.2 |
Data are mean ± SEM in spontaneously hypertensive rats (SHR, n = 7), Wistar-Kyoto rats (WKY, n = 7 for body weight, n = 6 otherwise), and enalapril-treated SHR (ena-SHR, n = 7). Analysis of variance: body weight, P = 0.949; pH, P = 0.014; pO2, P = 0.099; pCO2, P = 0.726; [Na+], P = 0.762; [K+], P = 0.232. *, P < 0.05 vs SHR (t-test). pO2 and pCO2 refer to arterial partial pressures of oxygen and carbon dioxide, respectively; [Na+] and [K+], arterial concentrations of sodium and potassium ions, respectively.
With a detection threshold of 10 mm Hg for the MAP rise during the pressure surges, the number of surges detected per 10 minutes of REM sleep was 7.9 ± 0.3, 5.9 ± 0.4, and 5.8 ± 0.2 in SHR, WKY, and ena-SHR, respectively. With a threshold of 20 mm Hg, the corresponding values were 2.9 ± 0.2, 1.9 ± 0.2, and 1.8 ± 0.2. Either of these ancillary analyses yielded results that were identical to those of the main analysis (threshold, 15 mm Hg) in terms of the statistical significance (or the lack thereof) of the differences among and between groups.
DISCUSSION
We investigated whether arterial hypertension in SHR alters the rate of occurrence and the characteristics of the pressure surges during REM sleep. We found that the rate of occurrence of these surges was higher in SHR than either in WKY or ena-SHR controls. The pressure surges were associated with a decrease of HP and an increase of THF, the magnitude of such changes being lower in SHR than in either control group. Finally, VP showed only a modest increase before the surges, without significant differences among the groups.
We showed that the rate of occurrence of the pressure surges during REM sleep was increased in the SHR model of arterial hypertension with respect to either WKY or ena-SHR controls. The comparison of SHR with each control group yielded different information, which may be combined to provide insight on the determinants (i.e., genetic, hypertensive, or pharmacologic) of our findings. Despite their common origin, SHR and WKY have substantial genetic differences,21 which may not be associated with hypertension and yet lead to phenotypic differences.18 In ena-SHR, on the other hand, the long-term inhibition of the angiotensin-converting enzyme17 effectively dissociated the SHR genome from arterial hypertension (Figure 3). Since the increased rate of occurrence of the pressure surges during REM sleep was observed in SHR with respect to either control group, it did not reflect an inherited irreversible trait of SHR but was, rather, suggestive of an effect of arterial hypertension in this model. In human patients, essential hypertension is a heterogeneous disorder, which may result from the interaction between gene variants and environmental factors.22 SHR are a widely studied model of spontaneous hypertension,15 which has been proved of value for the identification of gene variants involved in the regulation of arterial pressure.16 Further studies are needed to investigate whether our results are specific to the genetic hypertension that affects SHR or are shared by other forms of hypertension in animal models and human patients.
The differences in arterial pH (Table 1), baseline THF (Figure 5), baseline VP (Figure 6), and REM sleep time between SHR and WKY appeared to be due to genetic determinants independent of hypertension because they were not apparent between SHR and ena-SHR. Accordingly, the THF during REM sleep shows a substantial genotype-specific variation in mice.23 Moreover, previous reports indicated that REM sleep time in SHR is lower than in WKY24 and does not increase following long-term captopril treatment.18 On the other hand, the higher baseline value of HP observed in ena-SHR with respect to SHR appeared pharmacologically determined, because HP tended to be lower in WKY than in SHR (Figure 4).
We analyzed the characteristics of the pressure surges in REM sleep to gain insight on the mechanisms of their increased rate of occurrence in SHR. Since we selected the pressure surges based on their peak MAP increase, which appears to be the parameter most apt to reflect their clinical significance, they may have been heterogeneous in term of the underlying physiologic mechanisms. Nonetheless, the available evidence indicates a key role of sympathetic commands to the resistance vessels of the skeletal muscles4 in generating the pressure surges during REM sleep. These commands are centrally driven4 and require the integrity of the mesolimbic dopaminergic system.10 It may thus be hypothesized that, in SHR, hypertension increases the rate of occurrence of the pressure surges by enhancing the central sympathetic commands to the cardiovascular system. Accordingly, in response to acute behavioral stress, SHR show an enhanced increase of renal sympathetic nerve activity with respect to WKY.25 However, it must be noted that, in SHR as compared with WKY, arterial pressure is more responsive to central vasomotor control.26 Thus, if the central autonomic activity responsible for the pressure surges had greater magnitude in SHR with respect to WKY, SHR would display a greater MAP increase during the surges than would WKY. Contrary to this expectation, however, the MAP increase during the surges did not differ significantly among the groups (Figure 3).
We performed a coherent averaging of the fluctuations in HP, THF, and VP to determine whether and to what extent they were temporally linked to the peak of the pressure surges. This approach thus focused on the average characteristics of the pressure surges rather than on the variability among these events. With a coherent averaging procedure, we showed that HP decreased during the pressure surges and reached its minimum value before the MAP peak (Figure 2). An association between the pressure surges in REM sleep and tachycardia has been previously reported,7,9 although with different time courses. The tachycardia during the pressure surges had a lower magnitude in SHR than either in WKY and ena-SHR (Figure 4). This finding cannot be attributed to an impaired cardiac function in SHR because SHR are able to mount a tachycardic response to acute behavioral stress similar to that in WKY.25 The pattern of hypertension and tachycardia during the surges was opposite to that expected based on the arterial baroreflex and, instead, resembled that produced by the central autonomic drives, which support exercise and affective behavior.27 In SHR, therefore, the reduced tachycardia during the pressure surges in REM sleep suggests that arterial hypertension reduces the contribution of central autonomic commands to cardiac control, in agreement with previous results obtained studying the entire REM sleep episodes.28
The coherent averaging procedure also revealed that the pressure surges in REM sleep were preceded by a substantial increase of the cortical THF in all groups under study (Figure 2), as has been originally shown by Sei and Morita in Wistar rats.9 This observation indicates that distinct changes in brain activity are temporally linked to central autonomic commands, which initiate the pressure surges during REM sleep. In this respect, the finding that the acceleration of THF during the pressure surges was lower in SHR than in either WKY or ena-SHR (Figure 5) might suggest a reduced central autonomic drive in SHR. In SHR, therefore, the results of the coherent averaging of MAP, HP, and THF were consistent with a reduced magnitude of the central autonomic commands associated with the pressure surges in REM sleep.
Finally, it must be recognized that REM sleep entails a prominent variability of ventilation,1 which was readily evident in the raw recordings (Figure 1). In the coherent averaging of the pressure surges, the episodes of bradypnea and tachypnea canceled each other except for an increase of VP, which was linked to the following MAP peak (Figure 2) and did not differ in magnitude among the groups (Figure 6). Episodes of sleep apnea are associated with pressure surges, with the peak increase of arterial pressure being reached upon the resumption of breathing.19 The threshold duration of a significant sleep apnea is scaled from the value of 10 seconds in human subjects to a value of 2.5 seconds in rats because of their lower baseline VP.18 Compared with such threshold, the amplitude of the VP increase that we found was so modest (< 0.2 seconds, Figure 6) that it demonstrated that apneas were not a prerequisite of the pressure surges during REM sleep in the groups we studied. The observed VP increase may rather reflect the fractionations of diaphragmatic muscle activity described in REM sleep.29
In conclusion, we showed that, in SHR, pressure surges independent of sleep apnea occurred during REM sleep at a rate increased not only with respect to normotensive WKY controls, but also with respect to ena-SHR, in which the SHR genome was dissociated from hypertension by means of long-term enalapril treatment. Thus, this result does not reflect an inherited irreversible trait of SHR but, rather, is suggestive of an effect of arterial hypertension per se in this model. In SHR, the MAP increase during the surges was similar to that in their control groups, whereas the magnitudes of the tachycardia and the acceleration of theta rhythm during the surges were significantly reduced with respect to either control group. These results thus suggest that, in SHR, the central autonomic commands that underlie the pressure surges in REM sleep are increased in frequency, but not in magnitude, by arterial hypertension.
ACKNOWLEDGMENTS
The study was supported by the Italian Ministry of Education, University and Research (PRIN grant 2004050080) and by the University of Bologna (RFO A.A5.A52004238; A.A5.A52005263). The authors thank the technicians Giuseppe Mancinelli and Leonida Sabattini for the construction of the nasal thermistors and skilful assistance.
Footnotes
Disclosure Statement
This was not an industry supported study. The authors have indicated no financial conflicts of interest.
REFERENCES
- 1.Parmeggiani PL. Behavioral phenomenology of sleep (somatic and vegetative) Experientia. 1980;36:6–11. doi: 10.1007/BF02003941. [DOI] [PubMed] [Google Scholar]
- 2.Coccagna G, Mantovani M, Brignani F, Manzini A, Lugaresi E. Arterial pressure changes during spontaneous sleep in man. Electroencephalogr Clin Neurophysiol. 1971;31:277–281. doi: 10.1016/0013-4694(71)90098-8. [DOI] [PubMed] [Google Scholar]
- 3.Somers VK, Dyken ME, Mark AL, Abboud FM. Sympathetic nerve activity during sleep in normal subjects. New Engl J Med. 1993;328:303–307. doi: 10.1056/NEJM199302043280502. [DOI] [PubMed] [Google Scholar]
- 4.Baccelli G, Albertini R, Mancia G, Zanchetti A. Central and reflex regulation of sympathetic vasoconstrictor activity to limb muscles during desynchronized sleep in the cat. Circ Res. 1974;35:625–635. doi: 10.1161/01.res.35.4.625. [DOI] [PubMed] [Google Scholar]
- 5.Dickerson LW, Huang AH, Thurnher MM, Nearing BD, Verrier RL. Relationship between coronary hemodynamic changes and the phasic events of rapid eye movement sleep. Sleep. 1993;16:550–557. doi: 10.1093/sleep/16.6.550. [DOI] [PubMed] [Google Scholar]
- 6.Fewell JE. Influence of sleep on systemic and coronary hemodynamics in lambs. J Dev Physiol. 1993;19:71–76. [PubMed] [Google Scholar]
- 7.Silvani A, Asti V, Bojic T, et al. Sleep-dependent changes in the coupling between heart period and arterial pressure in newborn lambs. Pediatr Res. 2005;57:108–114. doi: 10.1203/01.PDR.0000148065.32413.B0. [DOI] [PubMed] [Google Scholar]
- 8.Campen MJ, Tagaito Y, Jenkins TP, Smith PL, Schwartz AR, O'Donnel CP. Phenotypic differences in the hemodynamic response during REM sleep in six strains of inbred mice. Physiol Genomics. 2002;11:227–234. doi: 10.1152/physiolgenomics.00031.2002. [DOI] [PubMed] [Google Scholar]
- 9.Sei H, Morita Y. Acceleration of EEG theta wave precedes the phasic surge of arterial pressure during REM sleep in the rat. NeuroReport. 1996;7:3059–3062. doi: 10.1097/00001756-199611250-00053. [DOI] [PubMed] [Google Scholar]
- 10.Sei H, Ikemoto K, Arai R, Morita Y. Injection of 6-hydroxydopamine into the ventral tegmental area suppresses the increase in arterial pressure during REM sleep in the rat. Sleep Res Online. 1999;2:1–6. [PubMed] [Google Scholar]
- 11.Verrier RL, Muller JE, Hobson JA. Sleep, dreams, and sudden death: the case for sleep as an autonomic stress test for the heart. Cardiovasc Res. 1996;31:181–211. [PubMed] [Google Scholar]
- 12.Muller JE, Tofler GH, Stone PH. Circadian variation and triggers of onset of acute cardiovascular disease. Circulation. 1989;79:733–743. doi: 10.1161/01.cir.79.4.733. [DOI] [PubMed] [Google Scholar]
- 13.Tofler GH, Muller JE. Triggering of acute cardiovascular disease and potential preventive strategies. Circulation. 2006;114:1863–1872. doi: 10.1161/CIRCULATIONAHA.105.596189. [DOI] [PubMed] [Google Scholar]
- 14.Baguet J-P, Barone-Rochette G, Mallion J-M. European Society of Hypertension Scientific Newsletter: hypertension and coronary heart disease. J Hypertens. 2006;24:2323–2325. doi: 10.1097/01.hjh.0000249719.05006.58. [DOI] [PubMed] [Google Scholar]
- 15.Zicha J, Kunes J. Ontogenetic aspects of hypertension development: analysis in the rat. Physiol Rev. 1999;79:1227–1282. doi: 10.1152/physrev.1999.79.4.1227. [DOI] [PubMed] [Google Scholar]
- 16.Pravenec M, Kurtz TW. Molecular genetics of experimental hypertension and the metabolic syndrome. From gene pathways to new therapies. Hypertension. 2007;49:941–952. doi: 10.1161/HYPERTENSIONAHA.107.086900. [DOI] [PubMed] [Google Scholar]
- 17.Adams MA, Bobik A, Komer PI. Enalapril can prevent vascular amplifier development in spontaneously hypertensive rats. Hypertension. 1990;16:252–260. doi: 10.1161/01.hyp.16.3.252. [DOI] [PubMed] [Google Scholar]
- 18.Carley DW, Berecek K, Videnovic A, Radulovacki M. Sleep-disordered respiration in phenotypically normotensive, genetically hypertensive rats. Am J Respir Crit Care Med. 2000;162:1474–1479. doi: 10.1164/ajrccm.162.4.9911033. [DOI] [PubMed] [Google Scholar]
- 19.Somers VK, Dyken ME, Clary MP, Abboud FM. Sympathetic neural mechanisms in obstructive sleep apnea. J Clin Invest. 1995;96:1897–1904. doi: 10.1172/JCI118235. [DOI] [PMC free article] [PubMed] [Google Scholar]
- 20.Silvani A, Bojic T, Cianci T, et al. Effects of acoustic stimulation on cardiovascular regulation during sleep. Sleep. 2003;2:201–205. doi: 10.1093/sleep/26.2.201. [DOI] [PubMed] [Google Scholar]
- 21.Cowley AWJ, Roman RJ, Jacob HJ. Application of chromosomal substitution techniques in gene-function discovery. J Physiol. 2003;554:46–55. doi: 10.1113/jphysiol.2003.052613. [DOI] [PMC free article] [PubMed] [Google Scholar]
- 22.Mancia G, De Backer G, Dominiczak A, et al. 2007 Guidelines for the management of arterial hypertension: the task force for the management of arterial hypertension of the European Society of Hypertension (ESH) and of the European Society of Cardiology (ESC) J Hypertens. 2007;25:1105–1187. doi: 10.1097/HJH.0b013e3281fc975a. [DOI] [PubMed] [Google Scholar]
- 23.Franken P, Malafosse A, Tafti M. Genetic variation in EEG activity during sleep in inbred mice. Am J Physiol. 1998;275:R1127–R1137. doi: 10.1152/ajpregu.1998.275.4.R1127. [DOI] [PubMed] [Google Scholar]
- 24.Kuo TBJ, Shaw FZ, Lai CJ, Lai C-W, Yang CCH. Changes in sleep patterns in spontaneously hypertensive rats. Sleep. 2004;27:406–412. doi: 10.1093/sleep/27.3.406. [DOI] [PubMed] [Google Scholar]
- 25.Li S-G, Lawler JE, Randall DC, Brown DR. Sympathetic nervous activity and arterial pressure responses during rest and acute behavioral stress in SHR versus WKY rats. J Auton Nerv Syst. 1997;62:147–154. doi: 10.1016/s0165-1838(96)00119-1. [DOI] [PubMed] [Google Scholar]
- 26.Kuo TBJ, Yang CCH. Altered frequency characteristic of central vasomotor control in SHR. Am J Physiol. 2000;278:H201–H207. doi: 10.1152/ajpheart.2000.278.1.H201. [DOI] [PubMed] [Google Scholar]
- 27.Spyer KM. Central nervous mechanisms contributing to cardiovascular control. J Physiol. 1994;474:1–19. doi: 10.1113/jphysiol.1994.sp019997. [DOI] [PMC free article] [PubMed] [Google Scholar]
- 28.Berteotti C, Asti V, Ferrari V, et al. Central and baroreflex control of heart period during the wake-sleep cycle in Spontaneously Hypertensive Rats. Am J Physiol. 2007;293:R293–R298. doi: 10.1152/ajpregu.00086.2007. [DOI] [PubMed] [Google Scholar]
- 29.Orem J. Neuronal mechanisms of respiration in REM sleep. Sleep. 1980;3:251–267. doi: 10.1093/sleep/3.3-4.251. [DOI] [PubMed] [Google Scholar]