

Abstract
The properties of inositol 1,4,5-trisphosphate (IP3)-dependent intracellular calcium oscillations in pancreatic acinar cells depend crucially on the agonist used to stimulate them. Acetylcholine or carbachol (CCh) cause high-frequency (10–12-s period) calcium oscillations that are superimposed on a raised baseline, while cholecystokinin (CCK) causes long-period (>100-s period) baseline spiking. We show that physiological concentrations of CCK induce rapid phosphorylation of the IP3 receptor, which is not true of physiological concentrations of CCh. Based on this and other experimental data, we construct a mathematical model of agonist-specific intracellular calcium oscillations in pancreatic acinar cells. Model simulations agree with previous experimental work on the rates of activation and inactivation of the IP3 receptor by calcium (DuFour, J.-F., I.M. Arias, and T.J. Turner. 1997. J. Biol. Chem. 272:2675–2681), and reproduce both short-period, raised baseline oscillations, and long-period baseline spiking. The steady state open probability curve of the model IP3 receptor is an increasing function of calcium concentration, as found for type-III IP3 receptors by Hagar et al. (Hagar, R.E., A.D. Burgstahler, M.H. Nathanson, and B.E. Ehrlich. 1998. Nature. 396:81–84). We use the model to predict the effect of the removal of external calcium, and this prediction is confirmed experimentally. We also predict that, for type-III IP3 receptors, the steady state open probability curve will shift to lower calcium concentrations as the background IP3 concentration increases. We conclude that the differences between CCh- and CCK-induced calcium oscillations in pancreatic acinar cells can be explained by two principal mechanisms: (a) CCK causes more phosphorylation of the IP3 receptor than does CCh, and the phosphorylated receptor cannot pass calcium current; and (b) the rate of calcium ATPase pumping and the rate of calcium influx from the outside the cell are greater in the presence of CCh than in the presence of CCK.
Keywords: inositol 1,4,5-trisphosphate receptor; phosphorylation; protein kinase A; mathematical model; calcium oscillations
introduction
The production of the intracellular signaling factor inositol 1,4,5-trisphosphate (IP3)1 and the subsequent release of Ca2+ stored in intracellular organelles is a fundamental cellular signaling function (Berridge, 1997). The form of the resultant change in the intracellular free Ca2+ concentration ([Ca2+]i) is highly variable. Specific, well-characterized response types include a single, large increase in [Ca2+]i, which may virtually deplete the stores, and smaller, maintained oscillations of [Ca2+]i (Berridge, 1990). Often both patterns may be observed in a single cell type, depending on the agonist concentration.
The release of Ca2+ by IP3 occurs through the activation of a specific receptor for IP3, which is located on the endoplasmic reticulum (ER) surface, and which is also a functional calcium channel (Bezprozvanny and Ehrlich, 1995; Taylor and Traynor, 1995; Joseph, 1996; Yoshida and Imai, 1997; Taylor, 1998). In addition to its IP3 binding site (at the NH2-terminal end) and its pore-forming region (the COOH-terminal end, containing six membrane-spanning regions), the IP3 receptor (IP3R) also contains a large regulatory domain between the NH2- and COOH-terminal regions. A number of cytosolic factors have been suggested to modulate IP3R activity, including, but not restricted to, PKA, PKC, Ca2+-calmodulin kinase II (CaMK-II), adenine, and possibly guanine nucleotides. These additional factors may permit the wide range of response types that are seen for IP3-induced Ca2+ release.
In addition to factors such as kinases modulating IP3R activity, Ca2+ itself plays a fundamental role. A number of studies have shown that the steady state open probability of the type-I IP3R displays a bell-shaped dependence on [Ca2+]i, with a peak at approximately [Ca2+]i = 300 nM (Bezprozvanny and Ehrlich, 1995; Taylor and Traynor, 1995; Joseph, 1996), while for type-III IP3 receptors the open probability curve is a monotonically increasing function of [Ca2+]i (Hagar et al., 1998). However, the steady state behavior of the receptor is much less important than the dynamic response of the receptor to a sudden increase of either [Ca2+]i or [IP3]. When exposed to a sudden change in [Ca2+]i or [IP3], the receptor responds by a transient increase in open probability, followed by adaptation or recovery, to a lower level (Finch et al., 1991; Dufour et al., 1997; Marchant and Taylor, 1998). Direct injection of IP3, or the use of nonhydrolyzable IP3 analogues, has shown that in mouse pancreatic acinar cells oscillations of [Ca2+]i can occur when the IP3 concentration is constant (Wakui et al., 1989; Berridge and Potter, 1990). Thus, dynamic regulation of the receptor by Ca2+ may represent the mechanism by which oscillations of [Ca2+]i arise, with Ca2+ initially promoting its own release, and then secondarily inhibiting further release. In the discussion, we discuss the possible effects on the model of changing IP3 concentrations.
A number of mathematical models have been developed to simulate IP3-induced Ca2+ release (De Young and Keizer, 1992; Atri et al., 1993; Sneyd et al., 1995; Tang et al. 1996), although, to date, all models have been based on the properties of the type-I receptor. In the model of De Young and Keizer (1992), each subunit of the tetrameric IP3R contains one binding site for IP3 and two binding sites for Ca2+, an activating site and an inactivating state. It was assumed that Ca2+ flux occurred only when the IP3 binding site and the activating Ca2+ binding site were occupied, and the Ca2+ inactivating site was unoccupied. This formulation resulted in an eight-state model, only one of which was a conducting state. With rate constants for interconversion between the eight states chosen, where possible, to correspond to experimental values, this model displayed oscillatory behavior over a range of [IP3] (De Young and Keizer, 1992). A fundamental feature of this model, necessary to allow oscillations to occur, is that IP3 and Ca2+ binding to the activation site are fast processes, whereas Ca2+ binding to the inhibitory site is a slow process. Other models of IP3R kinetics (Atri et al., 1993; Sneyd et al., 1995) are based on the same premise of fast activation and slow inhibition by Ca2+, and Tang et al. (1996) showed that these are essentially equivalent formulations. A model of [Ca2+]i dynamics in pituitary gonadotroph cells (Li et al., 1994, 1997) is perhaps the most highly developed of these in terms of the specific cellular mechanisms controlling [Ca2+]i and equivalence of the model behavior to experimental single cell data.
Experimental data on the relative rates of activation and inactivation of the IP3R by Ca2+ is consistent with inactivation being a slower process (Parker and Ivorra, 1990). However, careful analysis of data with higher kinetic resolution (Finch et al., 1991; Dufour et al., 1997; Marchant et al., 1997; Marchant and Taylor, 1998) suggests that the difference between the rates of activation and inactivation is not as great as is typically used in mathematical models. Furthermore, despite the fact that inactivation is apparently too slow in the models, the models are unable to reproduce long-period, baseline oscillations (up to 2 min or longer in period) observed in cells such as hepatocytes (Kawanishi et al., 1989) and pancreatic acinar cells (Yule et al., 1991). Recent models have addressed the issue of long-period oscillations (Dupont and Swillens, 1996; Laurent and Claret, 1997), but their relevance to any particular cell type is, as yet, unclear.
From the point of view of modeling Ca2+ oscillations and waves, pancreatic acinar cells present particular difficulties. Firstly, in response to different agonists, pancreatic cells exhibit markedly different Ca2+ responses (Petersen et al., 1991b; Yule et al., 1991; Lawrie et al., 1993; Thorn et al., 1993b). Application of acetylcholine (ACh) to pancreatic acinar cells results in the generation of [Ca2+]i oscillations that are roughly sinusoidal with a frequency of ∼4–6/min. The [Ca2+]i oscillations are superimposed on a raised baseline such that [Ca2+]i does not fall to basal levels before the generation of the next peak (Yule et al., 1991). In contrast, the [Ca2+]i response to cholecystokinin (CCK) is very different, consisting of baseline spikes of much longer period.
Despite these differences, there is much evidence that both types of oscillations result from agonist- dependent activation of phospholipase C, and the resulting increase in intracellular [IP3] (see discussion). How might these two very different patterns of Ca2+ release occur, with apparently the same basic intracellular processes? In particular, how do the long baseline spikes observed with CCK occur, given that [IP3] is thought to be maintained above basal levels throughout the period of stimulation, whereas [Ca2+]i, which initially provides the negative feedback signal to end Ca2+ flux from the stores, has returned to its basal values long before the next spike occurs? In studying these questions, it is important to keep in mind that pancreatic acinar cells contain a preponderance of type-III IP3 receptors (Wojcikiewicz, 1995), and thus any model to explain the observed oscillations should be based on data from the correct receptor subtype wherever possible. Fortunately, data on the steady state properties of type-III IP3 receptors have recently become available, although their adaptational and time-dependent properties are still unknown in detail.
Our goal is to understand the mechanisms underlying these different oscillatory patterns and provide a single explanation for these seemingly diverse phenomena. Of course, such an explanation can be simplistic at best and cannot take into account all the complexities of the real cell. Nevertheless, it will provide a framework to help us understand how a set of relatively simple cellular interactions can result in diverse and complex behavior. We begin by showing (experimentally) that in mouse and rat pancreatic acinar cells physiological concentrations of CCK cause rapid phosphorylation of the type-III IP3R, but physiological concentrations of ACh do not. Assuming that the phosphorylated receptor does not pass Ca2+ current (see discussion), it follows that the rate at which the IP3R recovers from inactivation depends crucially on the agonist. Secondly, we show that the rate of Ca2+ removal from the cytoplasm is an order to magnitude slower after application of CCK than after application of ACh. These data are then incorporated into a model of the type-III IP3R, and thus into a whole-cell model of the Ca2+ response. The model provides a unified explanation of seemingly disparate results; it agrees with the rates of activation and inactivation of the IP3R by Ca2+, as measured by Finch et al. (1991) and Dufour et al. (1997), but can nevertheless produce oscillations of very long period and generate oscillations of the two observed types. Furthermore, the steady state open probability of the model type-III IP3 receptor is an increasing function of Ca2+, as found experimentally by Hagar et al. (1998), thus showing that such monotonic steady state curves are consistent with oscillatory behavior, a fact that is not always appreciated. Predictions of the model are then tested, and confirmed, experimentally.
methods
Materials
Fura-2/AM was purchased from Molecular Probes, Inc., collagenase (CLSPA grade) from Worthington Biochemicals, bovine serum albumin (fraction V) from ICN Immunobiologicals, and minimal essential amino acid supplement from GIBCO BRL. [32P]orthophosphate (9,000 Ci/mmol) was obtained from Dupont NEN. Monoclonal antisera directed against the type-III inositol 1,4,5-trisphosphate receptor was obtained from Transduction Laboratories. All other materials were obtained from Sigma Chemical Co.
Preparation of Pancreatic Acini
Acini were prepared by methods previously described (Williams et al., 1978; Yule et al., 1996). In brief, pancreata were excised from freely fed adult male Sprague-Dawley rats (200–250 g) or mice. Acini were prepared by enzymatic digestion with purified collagenase, followed by mechanical shearing. Acini were then filtered through 150 μm Nitex mesh, purified by sedimentation through 4% BSA in HEPES ringer, and then suspended in a physiological salt solution containing 10 mg/ml bovine serum albumin, 0.1 mg/ml soybean trypsin inhibitor, and (mM): 137 NaCl, 4.7 KCl, 0.56 MgCl2, 1.28 CaCl2, 1.0 Na2HPO4, 10 HEPES, 2 l-glutamine, 5.5 d-glucose, essential amino acids. The pH was adjusted to 7.4 and equilibrated with 100% O2.
Measurement of [Ca2+]i
Isolated acini were incubated with 2.5 μM fura-2/AM at ambient temperature for 30 min, and then washed and resuspended in fresh physiological salt solution without BSA. For measurement of [Ca2+]i, fura-2–loaded acini were transferred to a chamber, mounted on the stage of an Axiovert 35 microscope (Carl Zeiss, Inc.), and continuously superfused at 1 ml/min with PSS without BSA. Solution changes were rapidly accomplished by means of a valve attached to an eight-chambered superfusion reservoir, which was maintained at 37°C. Determination of [Ca2+]i was performed using digital imaging microscopy with an ATTOFLUOR ratiovision system (ATTO Inc.) as previously described (Yule et al., 1996). Briefly, excitation at 340/380 nm was alternately achieved by a computer controlled filter and shutter system and the resultant emission at 505 nm was recorded at the rates indicated in the figures by an intensified CCD camera, and subsequently digitized. Mean gray values obtained by excitation at 340 and 380 nm, in user-defined areas of interest, were used to compute 340/380 ratios. Calibration of fluorescent ratio signals was accomplished as previously described according to the equation of Grynkiewicz et al. (1985) by comparing the fluorescence of known standard Ca2+ buffers containing fura-2.
Assessement of Phosphorylation of the Type-III IP3 Receptor
Acini were labeled with 0.3 mCi/ml 32PO4 for 2 h in HEPES ringer devoid of added phosphate. Aliquots of labeled acinar cells were then treated as indicated. At the end of the incubations, the acini were rapidly centrifuged in a microcentrifuge and the pellets were resuspended in ice-cold lysis buffer containing 100 mM NaF, 50 mM Tris-HCl, pH 7.4, 150 mM NaCl, 10 mM EDTA, 1 mM benzamidine, 1% Triton X-100, 10 μg/ml leupeptin, and 10 μg/ml pepstatin, at pH 7.4). The homogenates were then sonicated. After 30 min on ice, the samples were precleared by addition of 100 μl of protein A-agarose beads and rotation for 2 h at 4°C. The protein A beads were removed by centrifugation and the protein content of the samples was assayed. Type-III IP3R was immunoprecipitated from the samples of equal protein by incubation with 1 μg antibody/mg of protein (Transduction Laboratories) for 3 h. After incubation, the beads were washed five times with the lysis buffer by centrifugation and resuspension. After the final wash, the beads were boiled in Laemmli buffer and immunoprecipitated proteins separated by electrophoresis on 5% SDS-PAGE gels. The gel was dried and exposed to a Phosphoimager intensifing screen (Bio-Rad Laboratories) for visualization and analyzed by molecular analyst software for quantification (Bio-Rad Laboratories).
results
Secretagogue phosphorylation of the type-III IP3 receptor.
Aliquots of acini (in duplicate), metabolically labeled with 32P, were stimulated with secretagogues for 2 min and the extent of phosphorylation of the receptor was assessed by immunoprecipitating the receptor, separation on SDS-PAGE, and then autoradiography. Acini were initially treated with varying concentrations of CCK. In unstimulated acini, phosphorylation of one major band of ∼300 kD, corresponding to the type-III IP3R, could be detected. An increase in the degree of phosphorylation could be demonstrated at 10 pM CCK (170 ± 15% above basal) and reached a maximum at 100 nM CCK (252 ± 23% of control). Phosphorylation of the receptor was not significantly greater at 1 or 10 nM CCK (n = 4 rat and 2 mouse preparations gave qualitatively similar results). It should be noted that the onset and maximum phosphorylation of the receptor achieved coincides with concentrations of CCK that can be demonstrated to induce calcium oscillations (Yule et al., 1991, 1993). Fig. 1 shows a typical experiment. The extent of receptor phosphorylation was also investigated upon stimulation by the muscarinic agonist, carbachol. In this series of experiments, an increased phosphorylation of the type-III IP3R was also consistently observed 2 min after stimulation with agonist. Phosphorylation could be detected at 1 μM CCh (160 ± 22%) and reached a peak at 10 μM (203 ± 28% of control). In contrast to stimulation by CCK, no significant phosphorylation of the receptor was observed at concentrations of CCh below 1 μM, concentrations that can be demonstrated to induce an oscillatory calcium signal (Yule et al., 1991; n = 3 rat and 2 mouse preparations gave quantitatively similar results). A typical experiment is shown in Fig. 2.
Figure 1.
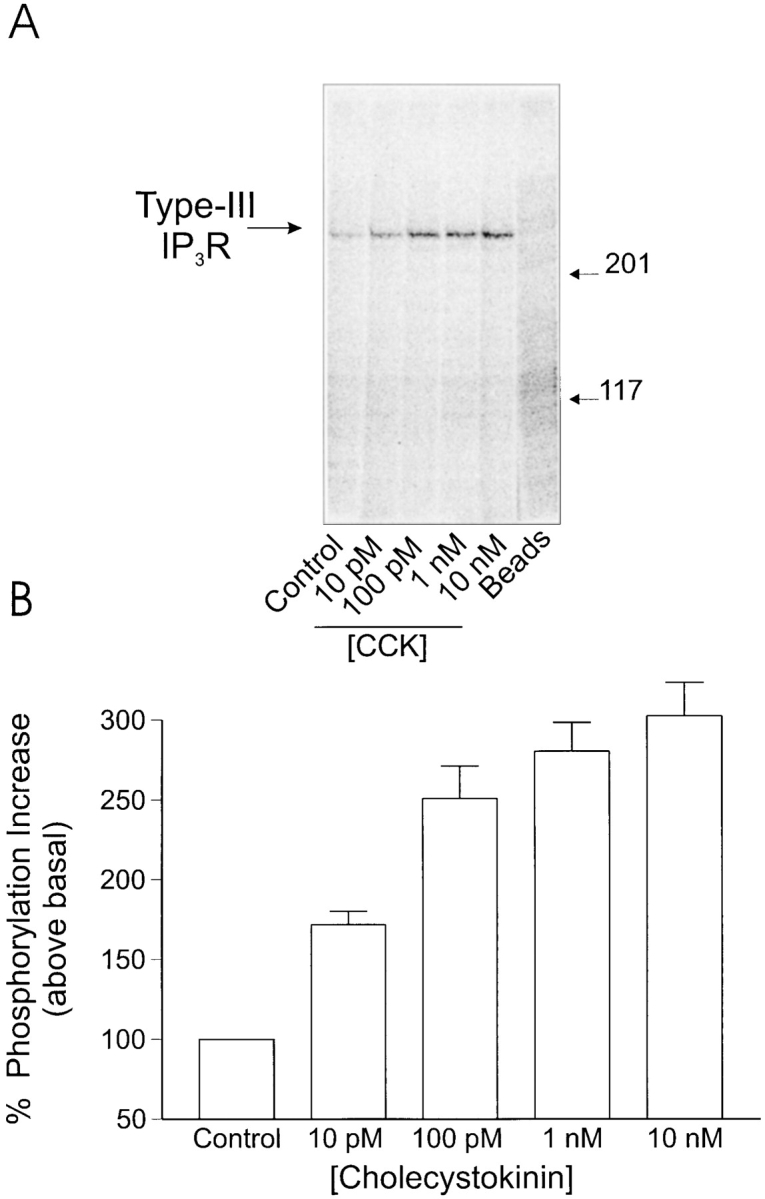
Phosphorylation of type-III IP3 receptor after stimulation by cholecystokinin in rat pancreatic acini: acini were prepared and samples were processed as detailed in the Methods. (A) In acini under control conditions, a single phosphorylated band was observed at ∼300 kD, corresponding to the type-III IP3 receptor. On stimulation by CCK, the intensity of this band increased; the increase was detected at 10 pM CCK and reached a maximum at 100 pM CCK. These concentrations of CCK are physiologically relevant and induce oscillatory [Ca2+]i signals. In the extreme right lane, samples were processed in an identical manner except that the immunoprecipitating antisera were omitted. (B) Pooled data (mean ± SEM) from at least three independent experiments, where samples were run in duplicate.
Figure 2.
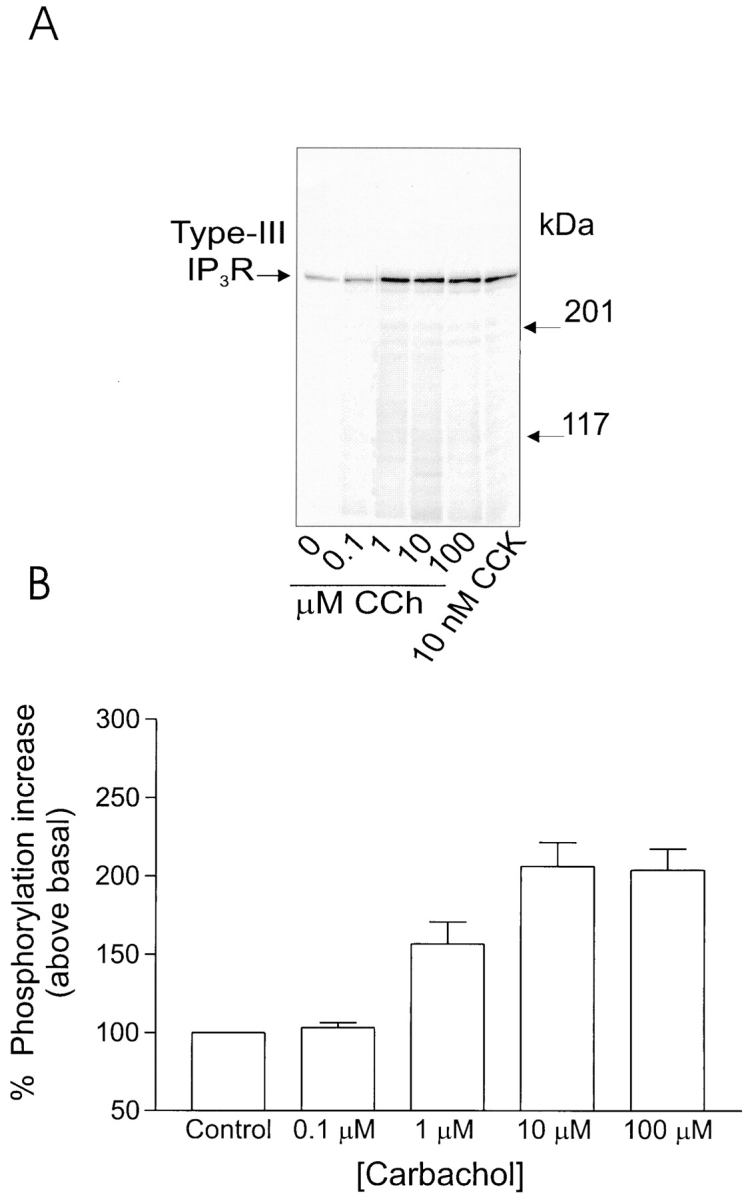
Phosphorylation of type-III IP3 receptor after stimulation by carbachol in rat pancreatic acini. (A) Stimulation with the muscarinic agonist carbachol also results in increased phosphorylation of the type-III IP3 receptor. Increased phosphorylation of the 300-kD protein could be detected at 1 μM, concentrations of carbachol that induce “peak-and-plateau” type Ca2+ responses. No phosphorylation could be detected at concentrations of CCh that induce [Ca2+]i oscillations. (B) Pooled data (mean ± SEM) from at least three independent experiments, where samples were run in duplicate.
It is known that, in pancreatic acinar cells, CCK activates both the adenylate cyclase pathway as well as the phospholipase C pathway, while ACh activates only the latter pathway (Schulz, 1989; Petersen and Wakui, 1990). Thus, a plausible working hypothesis is that the CCK-induced receptor phosphorylation is caused by the activation of PKA, a pathway that is not stimulated by ACh, or at least not to the same extent.
Phosphorylation of the type-III IP3 receptor by second messengers.
To investigate the mediator generated upon agonist stimulation that results in phosphorylation of the type-III IP3R, duplicate aliquots of acini were incubated for 5 min with agents known to activate or be a mediator in discrete second-messenger pathways: acini were incubated in either cyclopiazonic acid (CPA), which leads to an elevation of [Ca2+]i by inhibition of the Ca2+-ATPase present on intracellular calcium stores, TPA, an activator of protein kinase C, or CPT-cAMP, a cell-permeable cAMP analog. In three experiments (n = 2 rat and 1 mouse preparation) no enhanced phosphorylation of the type-III IP3R was ever observed from acini incubated with either TPA or CPA, indicating that a calcium-dependent kinase or protein kinase C is apparently not responsible for phosphorylation of the receptor. A marked increase in phosphorylation was, however, always observed when the acini were incubated with CPT-cAMP. The extent of phosphorylation, >427 ± 52% above basal, was greater than observed with phospholipase C–coupled agonists. These data indicate that a cAMP-dependent pathway is capable of phosphorylating the receptor. A typical experiment is shown in Fig. 3.
Figure 3.
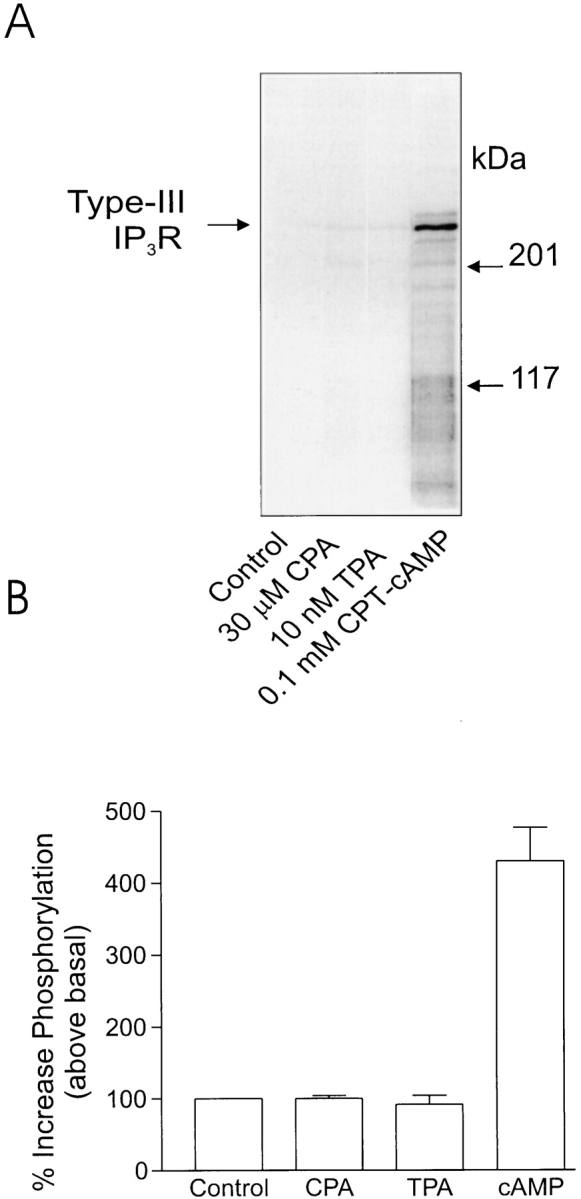
Phosphorylation of type-III IP3 receptor in rat pancreatic acini after stimulation by agents that modulate second-messenger levels. (A) Increased phosphorylation of the IP3 receptor could be detected from acini samples incubated with CPT-cAMP, a cell-permeable cAMP analogue, but not from samples incubated with agents known to increase [Ca2+]i (30 μm CPA) or activate protein kinase C (10 nM TPA). (B) Pooled data (mean ± SEM) from at least three independent experiments, where samples were run in duplicate.
Model Construction
Previous mathematical models of the IP3R have tended to treat IP3 as a permissive factor; its binding is regarded as obligatory for channel activation, but beyond that it has a passive role, with [Ca2+]i providing the dynamics underlying oscillations. However, two lines of experimental evidence suggest that IP3 binding may play a more important, dynamic role. Firstly, binding studies have shown the affinity of IP3 for its receptor is dependent on the [Ca2+]i. For type-I receptors, increasing [Ca2+]i causes either a decrease in IP3-binding affinity (Yoneshima et al., 1997) or a biphasic effect (Sienaert et al., 1997), whereas, for the type-III receptor, increasing [Ca2+]i enhances IP3 binding (Yoneshima et al., 1997). Secondly, there is evidence that IP3 itself may inactivate the IP3R. For example, experiments with high kinetic resolution performed under Ca2+-clamp conditions have shown that during continuous perfusion with a particular medium-Ca2+ concentration, the introduction of IP3 causes a transient release of 45Ca2+ from microsomes derived from rat brain synaptosomes (Finch et al., 1991) or rat hepatocytes (Dufour et al., 1997; Marchant and Taylor, 1998). This suggests either that IP3 can inactivate the receptor or that at least some of the Ca2+-induced inactivation occurs only during permeation of the channel. The Mn2+ quench experiments of Hajnóczky et al. (1993) demonstrate that IP3 can inactivate the receptors without permeation of Ca2+. Furthermore, they found that Ca2+ enhanced IP3-induced channel inactivation.
Reaction scheme.
We assume that the complete IP3R is composed of four, functionally identical, independent subunits. The reaction scheme governing transitions of each subunit is shown in Fig. 4. S denotes the fraction of subunits in the shut state (S), in which the receptor channel is closed and IP3 is not bound. Binding of IP3 causes the receptor to be converted to the open state, O, and we let O (Fig. 5) denote the fraction of receptors in state O. Although several subconductance states of IP3R have been observed, the channels most often open to just one of these (Watras et al., 1991). We therefore assume that IP3 must be bound to all four subunits for the receptor to be in the conducting state. Thus, the fraction of conducting receptors is O 4.
Figure 4.

Diagram of the receptor states of the model of the IP3 receptor. Phosphorylation of the receptor by PKA shunts the receptor through the I2 state, thus shutting off the Ca2+ current, and leading to long-period oscillations.
Figure 5.
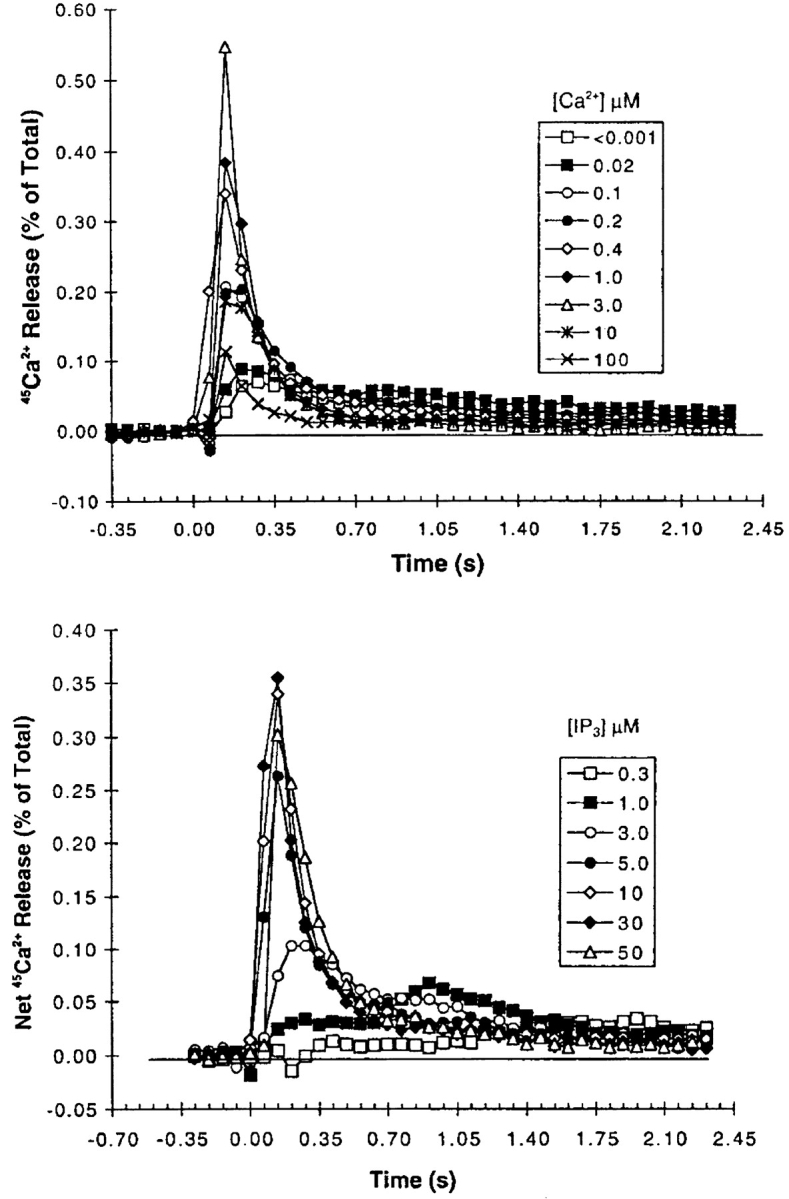
Data, reproduced from Dufour et al. (1997), Figures 1 A and 2 A, showing the effects of Ca2+ and IP3 on Ca2+ efflux through IP3 receptors from the rat liver. For the Ca2+ dose response, the concentration of IP3 was held at 10 μM and [Ca2+] was stepped up and held at the indicated concentration. For the IP3 dose response, [Ca2+] was held fixed at 400 nM and [IP3] was stepped up and held fixed at the indicated concentrations. The efflux through the receptor was then measured every 70 ms. Figure reprinted with permission.
To explain the apparent IP3-induced inactivation (described above), we propose that the O state is relatively unstable, and the subunits will progress through to the more stable I1 (inactivated) state, in which IP3 is still bound but the channels do not conduct. Thus, binding of IP3 to a single binding site accounts for both channel activation and at least one aspect of inactivation. We assume that the reverse transition (I1 → O) has a very slow rate, and so exclude it from our reaction scheme. It is reasonable to consider that a direct transition from S to I1 could occur. However, we suggest that the S → O transition is greatly favored, and will therefore strongly dominate the S → I1 transition, and so we make the simplifying assumption of setting the rate of the latter transition to zero.
In our model, we do not specifically include any binding sites for Ca2+. Although it appears there may be several of these on the IP3R (Sienaert et al., 1997), these have not been well characterized. Because of this, we instead incorporate the effects of Ca2+ by making the rate of the S to O transition a function of [Ca2+]i. By doing this, we are able to correlate model behavior with experimentally observed effects of [Ca2+]i, without having to speculate on the number or nature of Ca2+ binding sites on the receptors. This approach has the added advantage that the reaction scheme is kept simpler. However, a more complex model that assumes that Ca2+ governs the interconversion of the receptor between two different states, one with a high IP3 affinity, the other with a low IP3 affinity (Cardy et al.; 1997; Hajnóczky and Thomas, 1997), behaves in exactly the same manner (Sneyd, LeBeau, and Yule, manuscript submitted for publication). In fact, it can be shown that, if it is assumed that Ca2+ binding is fast, the model presented here can be derived from this more complex model.
We set the transition S → O to be an increasing function of [Ca2+]i. This is based on two separate experimental observations. First, raising [Ca2+] increased the rate of 45Ca2+ flux in superfusion experiments (Dufour et al., 1997, data reproduced here in Fig. 5). Second, in permeabilized hepatocytes, raising the medium [Ca2+] reduced the EC50 for IP3-induced 45Ca2+ release from internal stores (Marshall and Taylor, 1993). Both of these experimental observations are consistent with Ca2+ enhancing the affinity of IP3 for the receptors. More than 80% of hepatocyte IP3R are type II, with the remainder being type I (Wojcikiewicz, 1995), suggesting that IP3 binding to type-II receptors is enhanced by increasing [Ca2+], similar to type-III receptors (Yoneshima et al., 1997). The pancreas (most of which is exocrine acinar cells) contains mostly type-III receptors, with a significant number of type-II receptors, but few type-I receptors (Wojcikiewicz, 1995). Thus, we have assumed that Ca2+ enhances IP3 binding to the receptors in the model.
The transition I1 → S represents the normal pathway by which the IP3R recovers from inactivation, with IP3 dissociating from its binding site. The receptor can then rebind IP3 and repeat the cycle. We refer to this pathway (involving S, O, and I1 only) as the “intrinsic” receptor pathway, on the basis that this reflects the direct effects of IP3 and Ca2+ on receptor activity. However, we also include a transition from I1 to I2, where I2 represents a second inactivated state of the receptor in which IP3 is no longer bound (i.e., IP3 dissociates during this transition). This pathway is agonist specific and involves phosphorylation of the IP3R. As shown above, physiological concentrations of CCK cause rapid phosphorylation of the IP3R, (possibly via the activation of PKA), while physiological concentrations of ACh do not. Hence, to model the application of CCK, k 4 is set to be nonzero, while the application of ACh is modeled by setting k 4 = 0. Phosphatase actions eventually dephosphorylate the receptor, converting it to the S state, whereupon it may rebind IP3. A crucial element of this scheme is that while in the I2 state the receptor is unaffected by either the IP3 or Ca2+ concentrations. We refer to the pathway involving all four states of the channel as the “full” pathway, with the inclusion of the generation of I2 representing a “mediated” effect, as distinct from the intrinsic effects described above. The distinction between intrinsic and mediated effects is largely for descriptive convenience.
Receptor kinetics.
By the law of mass action differential, equations for the various receptor states can be determined. The equation for the fraction of receptor subunits in the open state (O) is
 |
1 |
where p is [IP3]. The variable S can be eliminated using the conservation law S = 1 − (O + I 1 + I 2). Here, I 1 and I 2 are the fraction of receptors in states I1 and I2, respectively. As previously stated, we assume that all four of the subunits must be in this state before the receptor will pass any Ca2+ current. Thus the conducting state is O 4.
The equation for I 1 is given by
 |
2 |
and for I 2 by
 |
3 |
As described above, the rate k 1 is a function of [Ca2+]i, which is denoted by c:
 |
4 |
whereas k −1, k 2, k 3, and k 5 are constants. The constant α1 is the maximum rate of the S to O transition, and β1 is the Ca2+ concentration at which the rate of the S to O transition is half its maximum rate. The function k 1 is an increasing function of c, representing our assumption that [Ca2+]i enhances the affinity of IP3 binding. Little is known regarding the mechanism(s) by which Ca2+ exerts its effects on the IP3R, and therefore, although Ca2+ may act by directly binding to the receptor, our reaction scheme does not explicitly indicate such a mechanism. However, as discussed above, the present model can be derived from a more general model in which Ca2+ regulates the binding affinity of IP3 (Hajnóczky and Thomas, 1997; Cardy et al., 1997; Sneyd, LeBeau, and Yule, manuscript submitted for publication).
Since we have not suggested explicit mechanisms representing the transitions governed by k 1, k 2, and k 3, we use the simplest possible functions. Thus, we chose k 2 and k 3 as constants, and let k 1 be a sigmoidal function of c, with a Hill coefficient of 3. If k 1 is assumed to have a smaller Hill coefficient, it is more difficult to get oscillations in the model. It thus appears that cooperativity in the action of Ca2+ on IP3 binding may be an important physiological mechanism. These choices for the rate constants are easily modified to give bell-shaped steady state open probability curves if one wishes to model other types of IP3 receptors. For instance, with a bell-shaped open probability curve, oscillations occur in the model even when k 1 has a Hill coefficient of 1 (computations not shown).
The rate constant k 4 is given by
 |
5 |
and models the action of a kinase (possibly PKA) on the IP3R, and is assumed to be dependent on the type of agonist used to initiate Ca2+ oscillations. The constant α4 denotes the maximum rate of the reaction attained at high p, while β4 denotes the value of p at which the rate is half maximal. When activated, k 4 shunts the receptors through the I2 pathway. Since it is reasonable to assume that greater levels of agonist stimulation will result in greater kinase activity, we assume that k 4 is a saturating function of the IP3 concentration. As can be seen from Table I, β4 is chosen to be relatively small, so that the rate of phosphorylation saturates quickly, and, in most physiological regimes, is approximately constant.
Table I.
Parameter Values for the IP3R Model
| Parameter | Description | Value | ||
|---|---|---|---|---|
| k flux | Maximum IP3R flux rate | 28 μM · s−1 | ||
| J influx | Ca2+ leak rate | 0.4 (0.025) μM · s−1 | ||
| Vp | Maximum pump rate | 2.6 (0.2) μM · s−1 | ||
| K p | [Ca2+]i for half-maximal pumping | 0.54 μM | ||
| α1 | Maximum rate of k l | 40 μM · s−1 | ||
| β1 | [Ca2+]i for half-maximal k l | 0.8 μM | ||
| k −1 | Rate of O to S transition | 0.88 s−1 | ||
| k 2 | Rate of O to Il transition | 0.5 s−1 | ||
| k 3 | Rate of Il to S transition | 0.5 s−1 | ||
| α4 | Maximum rate of k 4 | 0 (0.06) s−1 | ||
| β4 | [IP3] for half-maximal k 4 | 0.01 μM | ||
| k 5 | Rate of I2 to S transition | 0.02 s−1 |
The values in brackets are those used to model CCK-induced oscillations.
Simulation of IP3- and Ca2+-clamp experiments.
To determine reasonable values for the transition rates, we simulated experiments in which a superfusion system was used to determine the rapid kinetics of IP3R activation and inactivation. This technique has the feature that extravesicular [IP3] and [Ca2+] can be rapidly changed under otherwise clamped conditions (Finch et al., 1991; Dufour et al., 1997; Marchant and Taylor, 1998). Unfortunately, such data are not available from type-III receptors, and so it is unknown whether their time- dependent behavior is similar to that of type-I or -II receptors. In the absence of evidence to the contrary, we shall assume it is, although the model does point out some likely important differences, as we shall see.
The experimental observations we are attempting to reproduce are shown in Fig. 5, A and B. Fig. 5 A depicts 45Ca2+ efflux for various extravesicular [Ca2+], with a constant [IP3] of 10 μM. Initially, increasing the bathing [Ca2+] increased both the initial rate and peak response of 45Ca2+ efflux, but these factors decreased at high [Ca2+]. The cumulative release was also found to increase initially, but then decrease at higher [Ca2+] (Dufour et al., 1997, not shown). Fig. 5 B shows the results of similar experiments in which extravesicular [IP3] was changed, while the [Ca2+] was fixed at 400 nM. Here, again, increasing [IP3] caused an increase in both the initial rate and cumulative 45Ca2+ release, although in this case neither factor was observed to decline at high [IP3] (Dufour et al., 1997).
Simulations of these experiments are shown in Fig. 6. Since only direct effects of IP3 and Ca2+ would be expected to affect IP3R activity, only the intrinsic pathway was used for these simulations (i.e., generation of I2 was excluded by setting k 4 = 0). The simulated experiments used the same concentrations of agonists, although the full range was not used. The qualitative behavior of the simulations was in good agreement with the experimental data, with one significant difference. The rate of inactivation of the receptor is an increasing function of [Ca2+]i in the data but not in the model. In other words, the data from type-II receptors indicates that k 2 is an increasing function of c, but this was not included in the model. The principal reason for this is that we found, in order to obtain a monotonic steady state open probability curve (see below), it was simplest to set k 2 to be a constant, rather than an increasing function of c. Although the dynamic properties of type-III IP3 receptors have not yet been measured, our model predicts that a monotonic steady state curve will likely be associated with receptors whose rate of inactivation is independent of [Ca2+]i. The simulated dose responses of the model also agree qualitatively with the results of Marchant and Taylor (1998).
Figure 6.

Dose responses, calculated from the model. The same Ca2+ and IP3 concentrations as in Fig. 5 were used, except that the whole range of concentrations was not covered.
Monotonic steady state [Ca2+] dependence.
For type-I IP3 receptors, the steady state open probability has been found to have a bell-shaped dependence on [Ca2+] (Bezprozvanny and Ehrlich, 1995; Taylor and Traynor, 1995; Kaftan et al., 1997), and this can easily be reproduced by our model (computations not shown). However, recent results (Hagar et al., 1998) have shown that the type-III IP3R has a steady state open probability curve that is a monotonic increasing function of Ca2+. Since it appears that Ca2+ oscillations in pancreatic acinar cells are governed by Ca2+ release through type-III IP3R, we chose parameter values so as to obtain a monotonically increasing steady state open probability curve as a function of Ca2+ concentration (Fig. 7).
Figure 7.

Steady state open probability of the model IP3 receptor, as a function of [Ca2+], for a range of constant IP3 concentrations.
Fig. 7 shows that as [IP3] is increased, the point of inflexion (i.e., where the slope is greatest) shifts to the left. Since the measurement of the steady state open probability curve has been measured at only a single IP3 concentration, this is a prediction from our model that has not yet been tested.
In the Appendix, we show that, at least in most current models, including those of Tang et al. (1996), De Young and Keizer (1992), Atri et al. (1993), Bezprozvanny (1994), and Li and Rinzel (1994), the position of the steady state open probability curve as a function of IP3 concentration is crucially dependent on the assumed effects of Ca2+ on IP3 binding. When an increased Ca2+ concentration enhances IP3 binding to the receptor, the models predict that the steady state curve will move to the left as the background [IP3] increases. Conversely, when an increased Ca2+ concentration decreases IP3 binding to the receptor, the steady state curve is predicted to move to the right as [IP3] increases.
The rightward shift of the peak of the bell-shaped steady state curve observed by Kaftan et al. (1997) came from studies of the type-I IP3R. Binding of IP3 to the type-I receptor is decreased by raising [Ca2+] (Yoneshima et al., 1997; but see Sienaert et al., 1997 for more complex effects), whereas IP3 binding to type-III receptors was enhanced by raising [Ca2+] (Yoneshima et al., 1997). Thus, from analysis of our model, the rightward shift of the steady state curve observed by Kaftan et al. (1997) is the expected effect for type-I receptors, but the opposite should occur in cases where Ca2+ enhances IP3 binding, which appears to be the appropriate situation for pancreatic acinar cells.
We emphasise another crucial point that is often overlooked. The exact nature of the steady state open probability curve has little effect on the dynamic properties of the receptor, and thus has little influence on whether or not the receptor is able to mediate Ca2+ oscillations. This is because it is the initial fast activation of the IP3R, followed by a slower inactivation, that is the crucial mechanism underlying Ca2+ oscillations. As we shall see, a model with a monotonic steady state curve is quite capable of generating oscillations, and in fact these oscillations are almost the same as those of a similar model in which the steady state open probability curve is bell shaped (computations not shown).
Incorporation into a whole-cell model.
We now incorporate the receptor model into a description of acinar cell [Ca2+]i responses, endeavoring to keep the model as simple as is reasonably possible so as to retain the focus on the kinetics of the IP3R. Hence, we do not include any possible effects of ryanodine receptors (see discussion).
The equation for [Ca2+]i (c) is given by
 |
6 |
where J rel represents the IP3-induced release of Ca2+ from the ER and is given by
 |
7 |
in which k flux is the maximum rate of Ca2+ release from the ER.
J pump represents the combined activity of all Ca2+ pumps that remove Ca2+ from the cytosol and is given by
 |
8 |
where V p represents the maximum rate of pumping and K p is the [Ca2+]i for half-maximal pumping. The Ca2+ ATPase pump is assumed to operate in a cooperative manner, with a Hill coefficient of 2 (Lytton et al., 1992).
J influx is an adjustable parameter that represents a constant rate of Ca2+ influx into the cytosol. This term includes both influx from outside the cell and any leak of Ca2+ from intracellular stores such as the ER and mitochondria.
The standard parameter values are given in Table I. The values in brackets correspond to those values used to model CCK-induced oscillations, as described in more detail below.
To keep the model as simple as possible at this stage, we do not consider effects such as spatial variation in the [Ca2+]i signals, separation of either Ca2+ influx versus leak from internal stores, or the various forms of Ca2+ pumping both into internal stores or out of the cell. We also do not consider the aspect of store filling state and the dependence on this of [Ca2+]i signals, nor do we include capacitative Ca2+ entry. Thus, we are concerned only with the initial phases of the [Ca2+]i signals (i.e., the generation of the responses), when the filling state of the Ca2+ stores will not yet have been compromised, as opposed to the sustained phases of the responses. We leave such aspects for further investigation.
In addition to our need to keep the model as simple as possible at this stage, there is another very good reason to omit consideration of spatial effects at this stage. It is well known that, to understand the behavior of a reaction–diffusion system (such as this would be in the presence of Ca2+ diffusion), it is necessary first to understand the behavior of the model in the absence of diffusion; i.e., the reaction kinetics must be understood in detail before it is possible to understand how diffusion will affect the system. Although diffusion and spatial heterogeneities will modulate the amplitude and period of the oscillations, they are unlikely, by themselves, to explain the gross features of the different oscillation types. Only a study of the reaction mechanisms will do that.
Finally, we assume that Ca2+ buffering is fast and linear, so that all the fluxes in the model are effective fluxes of free Ca2+. In the absence of any specific information on the properties of calcium buffers in pancreatic acinar cells, this is the simplest assumption.
Theoretical Results
Parameter values.
The parameter values used in the model simulations are presented in Table I. The values for the rates of activation and inactivation of the IP3 receptor by Ca2+ (α1, β1, α2, β2, γ2, α3, β3, k −1, and k 2) were determined by ensuring the model agrees with the results of Dufour et al. (1997). This was not done by a detailed fitting procedure, only approximate agreement was required. The parameters governing the rate of phosphorylation of the IP3 receptor by PKA (α4 and β4), and the recovery from the I2 state (k 5), were not determined from experimental data; the values in Table I were chosen so as to give reasonable agreement with the observed CCK-induced oscillations. For ACh-induced oscillations, α4 was set to zero to mimic the much decreased rate of receptor phosphorylation.
Pumping rates.
To measure the approximate rate of Ca2+ ATPase activity, exponential functions were fit to the downward slopes of the oscillations induced by either ACh or CCK (data not shown). Although this assumes that the decline in Ca2+ concentration during the decreasing phase of the oscillation is due to Ca2+ pumping, and although it assumes the pumping has linear kinetics, these assumptions will have little, if any, qualitative effect on the result, and are accurate enough for our purposes; we are not doing a detailed fit of the model to data, merely using the data to determine approximate values for the parameters.
ACh-induced oscillations have a declining phase that approximates an exponential curve, with a decay rate that varies from ∼0.2 to ∼0.4 s−1. On the other hand, the decay rate for the decreasing phase of CCK- induced oscillations ranges from ∼0.03 to ∼0.06 s−1.
Based on these experimentally measured time constants for the removal of Ca2+ from the cytoplasm, we chose two different values for V p, the maximum pumping rate, corresponding to the two different agonists. For ACh, we chose V p = 2.6 μM s−1, while for CCK we chose V p = 0.2 μM s−1 (Table I). Note that, although V p does not correspond directly to the time constants measured by fitting an exponential to the experimental data, these maximum pumping rates will give rates of decline of the correct orders of magnitude for the two different agonists. Based on the data of Lytton et al. (1992), the pump was assumed to operate in a cooperative fashion, with a half-maximal rate occurring at 0.54 μM. The parameter k flux was determined by requiring a physiologically reasonable resting Ca2+ concentration.
Calcium influx.
There remains only one parameter, the rate of Ca2+ influx, to discuss. We hypothesise that this parameter is agonist dependent. In addition to the very different kinetics of [Ca2+]i transients evoked by the two agonists, the transients also differ greatly in their sensitivity to removal of external Ca2+. ACh-induced transients are very sensitive, such that if the medium bathing cells is switched from normal (1.2 mM [Ca2+]) to nominally Ca2+-free during repetitive [Ca2+]i oscillations, the oscillations are abolished within ∼30 s (Yule et al. 1991). This behavior has also been observed by Muallem et al. (1990), and for bombesin-stimulated oscillations in rat pancreatic acinar cells by Xu et al. (1997).
The same treatment has only a slow effect on CCK- induced oscillations (Yule et al. 1991; see also Xu et al., 1997). Here, the oscillations may continue for up to 20 min, with the peak of the transients slowly reducing. The slow decay, and eventual loss, of CCK-induced oscillations probably reflects Ca2+ store depletion, which is normally prevented, when Ca2+ is present in the medium, by capacitative Ca2+ entry (Xu et al., 1995, 1997), which is not included in the model at this stage. It seems unlikely that the same explanation can account for the effects of removal of external Ca2+ on ACh- induced oscillations because of the contrasting rapidity of the loss of oscillations. Instead, the experimental observations suggest that ACh may activate a Ca2+ entry pathway that is necessary for the generation of oscillations. This is consistent with the raised baseline Ca2+ concentrations observed during ACh-induced oscillations. Although it is clear that the mechanisms of Ca2+ entry are much more complicated than our model assumes (Loessberg et al., 1991; Xu et al., 1995, 1997), we ignore these complications for now and just treat Ca2+ influx as a simple leak. It is unclear what qualitative effect this will have on the model conclusions.
Based on the above argument, we assume that ACh increases the rate of Ca2+ influx from outside the cell, while CCK does so to a much lesser extent, and thus, to simulate the two different types of oscillations, we use the two different values shown in Table I.
It is important to note that only three parameters are dependent on the agonist. All other parameters are invariant for all the simulations. Thus, we hypothesise that the differences between oscillations induced by ACh, and those induced by CCK, are due to the following two things. (a) CCK activates PKA, and causes greater phosphorylation of the IP3 receptor, thus shunting it through the closed state I2. ACh-induced phosphorylation is much less significant, and thus the state I2 is bypassed. (b) ACh increases the rate of Ca2+ turnover much more than CCK does. Thus, the rate of Ca2+ influx from outside the cell, and the rate of Ca2+ removal from the cytoplasm, are greater in the presence of ACh than in the presence of CCK.
ACh-induced oscillations.
We investigated the effects of increasing [IP3] on [Ca2+]i responses in the model, with the pathway regulated by k 4 switched off. The rates of Ca2+ influx and pumping were set to 0.4 and 2.6 μM s−1, respectively (see Table I). Raising [IP3] to 0.66 μM caused the generation of [Ca2+]i oscillations with a period of ∼15 s (Fig. 8). During the oscillatory behavior, the nadir of the oscillations occurred at ∼300 nM, well above the resting [Ca2+]i.
Figure 8.

Typical ACh-induced oscillations in the model for [IP3] = 0.66 μM.
For the simulation in Fig. 8, [IP3] was not raised immediately to its final level, but was instead raised gradually, with a time contant of 10 s. Thus, our simulations include the effects of a continually varying IP3 concentration, as would be expected to occur upon agonist stimulation. Although slow variations in [IP3] modulate the exact shape of the oscillations, their overall behavior can still be predicted by considering the behavior in response to a constant [IP3]. Similarly, if [IP3] is allowed to decrease gradually, the oscillations eventually disappear (computations not shown). The crucial point to notice is that, although [IP3] is changing slightly throughout the course of an oscillation (particularly during the first few peaks), such changes are not a crucial part of the oscillatory mechanism. Oscillations can occur in the presence of a fixed [IP3] in the oscillatory range.
The behavior of the system over a full range of [IP3] can be seen in Fig. 9. In this figure, the effect of increasing [IP3] progressively on the behavior of the system is shown. In particular, this analysis examines the effect of [IP3] on [Ca2+]i responses, showing where they are stable and where they are oscillatory. Starting at low [IP3] values, the system is stable, as depicted by the solid line. As [IP3] is progressively increased, [Ca2+]i gradually rises, but it still stable (i.e., it remains at a single value over time). However, at [IP3] = 0.62, a critical point is reached where the steady state solution becomes unstable (Fig. 9, dotted line) and a stable periodic solution (i.e., oscillations) emerges. The maximum and minimum amplitudes of the periodic solution are depicted by the solid lines. This “oscillatory regime” reflects values of [IP3] at which steady oscillations of [Ca2+]i are observed. When [IP3] exceeds 0.67, the periodic solution collapses back to a stable, steady state value that is raised considerably compared with that at [IP3] before the periodic region.
Figure 9.

Bifurcation diagram for ACh-induced model oscillations showing the values of [IP3] for which oscillations occur. A dotted line denotes an unstable steady state, while a solid line denotes a stable steady state or a stable oscillation.
From Fig. 9, two other important features are apparent. The first is that, at [IP3] just before the oscillatory regime, [Ca2+]i is raised relative to the resting level and, for [IP3] values that give oscillations, the minimum value of [Ca2+]i during the oscillations also remains elevated compared with the resting [Ca2+]i. This feature therefore corresponds to the raised baseline [Ca2+]i during oscillations that are observed in both the experimental and simulated oscillations (Yule et al. 1991; and Fig. 8).
The second feature from Fig. 9 is that the range of [IP3] over which oscillations are generated is very narrow (≈50 nM). This feature is consistent with the experimental observation that only a narrow range of ACh concentrations is able to elicit oscillations of [Ca2+]i (Yule and Gallacher, 1988). It seems reasonable to assume that the narrow range of ACh concentrations generates a relatively narrow range of [IP3], although assays for IP3 are not yet sensitive enough to test this prediction.
CCK-induced [Ca2+]i oscillations.
The experimental results indicate that CCK (but not ACh) activates PKA, which phosphorylates the inactivated (I1 state) receptors, converting them to the I2 state. The receptors remain in the I2 state, where they are insensitive to [Ca2+]i, until the action of phosphatases converts them back to the S state. The action of PKA was modeled by increasing k 4 to 0.05 s−1. Furthermore, we reduced the rate of Ca2+ turnover by decreasing Vp, the maximum pump rate, to 0.2 μM s−1, while the rate of Ca2+ influx was reduced to 0.025 μM s−1.
Simulated CCK-induced [Ca2+]i oscillations are shown in Fig. 10. At 0.6 μM [IP3], after a large initial spike, repetitive [Ca2+]i transients occur with a period of ∼150 s. The [Ca2+]i spike kinetics are consistent with the experimental data and the spikes originate from close to the basal [Ca2+]i, in contrast to the ACh- induced oscillations. Again, for this simulation, [IP3] was raised gradually with a time constant of 100 s to mimic more realistically the effects of agonist application.
Figure 10.

Typical CCK-induced oscillations in the model for [IP3] = 0.6 μM.
The bifurcation diagram for the full (CCK-activated) model is shown in Fig. 11. The threshold [IP3] for generating oscillations occurs at ∼0.56 μM, at which large oscillations occur. Before this, raising [IP3] causes little increase in [Ca2+]i. As [IP3] is increased through the oscillatory regime, the nadir of the periodic solution (i.e., the minimum [Ca2+]i value during repetitive oscillations) remains close to the resting value, corresponding to the baseline nature of the oscillations. The minimum [Ca2+]i only starts to increase as the periodic solution collapses to the stable steady state solution at ∼0.77 μM [IP3]. In contrast, the maximum [Ca2+]i during oscillations is large at the threshold [IP3] and falls markedly as [IP3] is further increased. It should be noted though, that the maximum amplitude of the initial [Ca2+]i spike will depend on the rate of IP3 accumulation and will typically overshoot the maximum value of the periodic solution.
Figure 11.

Bifurcation diagram for CCK- induced model oscillations, showing the values of [IP3] for which oscillations occur. A dotted line denotes an unstable steady state, while a solid line denotes a stable steady state, or a stable oscillation.
The bifurcation diagram shows that simulated CCK-induced oscillations occur for a larger range of [IP3] than is the case of ACh (compare Fig. 11 with 9). This is consistent with experimental observations that ACh- induced oscillations occur for only a very narrow concentration range, whereas a wider range of CCK concentration is effective at generating oscillations (Yule, D.I., unpublished data). Finally, Fig. 11 shows that, for [IP3] above ∼0.77 μM, a stable steady state solution corresponding to a maintained plateau [Ca2+]i occurs.
Testing Model Predictions
Experiments with Ca2+-free media.
We used the model to investigate the relationship between the rate of Ca2+ influx and generation of ACh-induced [Ca2+]i oscillations. By reducing J influx, we can simulate the effect of reducing extracellular [Ca2+]. It turns out that, as J influx is decreased, the range of IP3 concentrations for which oscillations are observed shifts to the right; i.e., to higher [IP3]. Thus, a decrease in calcium influx would be expected to abolish oscillations, while an increase in [IP3] would be expected to restore them. This behavior is demonstrated in Fig. 12 A. The values for J influx and [IP3] are indicated at the top of the figure. At the normal J influx value of 0.4 μM s−1, oscillations are induced when the concentration of IP3 is raised to 0.66 μM. Reducing J influx to 0.35 μM s−1 abolishes the oscillations, but these are recovered when [IP3] is increased to 0.75 μM.
Figure 12.

(A) The effect of reducing external Ca2+ in the model. ACh-induced oscillations are abolished by reducing to 0.35 μM s−1 the Ca2+ influx from outside the cell. Oscillations are then restored by increasing the IP3 concentration to 0.75 μM. (B) Experimental test of the prediction in A. Mouse pancreatic acinar cells were first exposed to 70 nM ACh in the presence of 1.2 mM Ca2+, which initiated oscillations. Reduction of external Ca2+ to 100 nM abolished the oscillations, but an increase in ACh concentration to 100 nM restored the oscillations, as predicted by the model.
Experiments were conducted to test these model predictions (Fig. 12 B). Acinar cells were exposed to 70 nM ACh, which evoked repetitive oscillations in the presence of 1.2 mM external Ca2+. At t = 280 s, the external Ca2+ concentration was reduced to 100 mM, which abolished oscillations within one to two oscillation periods. An increase in the ACh concentration (to 100 nM) at 350 s, still in the presence of low external Ca2+, restored the oscillations, this time with an increased frequency. The increased frequency is also sometimes seen in the model (computations not shown).
Comparison of Fig. 12, A and B, shows that the model predictions are confirmed by the experimental data. In the presence of CCK, removal of external Ca2+ has no immediate effect on the Ca2+ oscillations (Yule et al., 1991), and this effect is also reproduced by the model (computations not shown).
Effects of phosphorylation on ACh-induced oscillations.
Using the model, we studied the effects of phosphorylating the IP3 receptors during ACh-induced oscillations (computations not shown). Oscillations are initiated by 0.66 μM IP3, with the other parameters the same as for ACh-induced oscillations (Table I); in particular, α4 = 0 to simulate the absence of phosphorylation. Then, at 100 s, α4 was increased to 0.05 s−1, to simulate the cAMP-induced phosphorylation of the receptor by PKA. Oscillations are quickly abolished. This prediction is confirmed by existing experimental data (Camello et al., 1996) and our own experiments, in which oscillations induced by 100 ACh are quickly abolished by the addition of 0.1 mM CPT-cAMP (Yule, D.I., unpublished data).
Although phosphorylation of the receptor can lead to long-period oscillations in the absence of fast membrane transport of Ca2+ (recall that CCK does not increase the membrane transport of Ca2+ as much as ACh does), it is unable to do so in the presence of large fluxes of Ca2+ across the membrane. Essentially, the Ca2+ ATPase pumps remove Ca2+ so quickly from the cytoplasm that the Ca2+ flux through the IP3R (which, it must be recalled, is now sitting in a closed phosphorylated state much of the time) cannot keep up the oscillatory cycle. It is only when the IP3R is not shunted into the phosphorylated state that the receptor cycle is fast enough to maintain the oscillations.
discussion
Based on old and new experimental data, we have constructed a new model of the type-III IP3R and incorporated it into a whole-cell model for intracellular Ca2+ oscillations in pancreatic acinar cells. This model agrees with recent data on the rates of activation and inactivation of the IP3R by Ca2+ (Dufour et al., 1997), and can reproduce both the short-period, raised baseline oscillations induced by ACh in pancreatic acinar cells, as well as the long-period baseline spiking induced by CCK. The steady state open probability of the model IP3R is a monotonically increasing function of [Ca2+]i, as shown experimentally by Hagar et al. (1998).
The ability of the model to reproduce this wide variety of experimental data is based principally on two things. (a) Physiological concentrations of CCK cause rapid phosphorylation of the IP3R while physiological concentrations of ACh do not. Phosphorylation of the IP3R does not appear to be Ca2+ dependent, and can also result from the addition of CPT-cAMP. Hence, we hypothesize that CCK, via production of cAMP and activation of PKA, shunts the IP3R through a phosphorylation pathway that prevents rapid recovery from receptor inactivation. Inactivation of the IP3R by Ca2+ is rapid, as indicated by the data of Dufour et al. (1997), and then receptor phosphorylation holds the receptor in an inactivated state. The resulting long-period oscillations are then governed by the time taken to recover from the phosphorylated state. In the absence of phosphorylation (i.e., after stimulation by ACh), the oscillation period is governed principally by the rate of recovery from Ca2+-induced inactivation of the receptor. (b) In the presence of ACh, the flux of Ca2+ in both directions across the plasma membrane is greater than in the presence of CCK. Measurement of the rates of Ca2+ removal during the downstroke of the oscillations indicates that the rate of Ca2+ ATPase activity is much greater in the presence of ACh than in the presence of CCK. Furthermore, it appears that ACh increases the rate of Ca2+ entry from outside the cell much more than does CCK. Indirect evidence for this has appeared before; Yule et al. (1991) showed that removal of external Ca2+ abolishes ACh-induced oscillations, but has little effect on CCK-induced oscillations. By making this assumption in the model, we were able to predict the effect of both reducing external Ca2+ and increasing agonist concentration. The fact that the model predictions were confirmed by the experimental data lends support to this hypothesis, although this evidence is still indirect.
It has been known for some years that PKA is able to phosphorylate the IP3R; more recently, Wojcikiewicz and Luo (1998) have shown that type-I, -II, and -III receptors are differentially susceptible to phosphorylation in intact cell lines (AR4-2J rat pancreatoma and RINm5F rat insulinoma cells). Furthermore, it is also known that CCK activates both the adenylate cyclase and phospholipase C pathways in pancreatic acinar cells, while ACh does not appear to activate the adenylate cyclase pathway (Schulz, 1989; Petersen and Wakui, 1990). However, what is far less clear is the exact effect of IP3R phosphorylation. In some cell types, it appears that phosphorylation of the IP3R by PKA inhibits Ca2+ release (Supattapone et al., 1998; Volpe and Alderson-Lang, 1990), while in hepatocytes the opposite effect occurs (Hajnóczky et al., 1993; Joseph and Ryan, 1993). In platelets, PKA phosphorylation of the IP3R causes a 30% inhibition of IP3-induced Ca2+ release (Quinton and Dean, 1992), while more recent data shows that PKA inhibits IP3-induced Ca2+ release in megakaryocytes (Tertyshnikova and Fein, 1998). In a renal epithelial cell line, kinase activators and phosphatase inhibitors decrease the response to carbachol, while kinase inhibitors increase the response to carbachol (Xu et al., 1996a), results that are consistent with the assumptions of our model.
Our experiments on the phosphorylation of the IP3 receptor were performed in both rats and mice, and similar results were obtained. Thus it is reasonable to assume that the model of the IP3 receptor is applicable to both rats and mice. However, there are quantitative differences between the Ca2+ responses of rat and mice pancreatic acinar cells to agonist stimulation. In the study of Tsunoda et al. (1990) in rat pancreatic acinar cells in intact acini, Ca2+ responses to application of CCh took the form of low period baseline spiking, similar to the responses to application of CCK. Since most of the studies showing clear differences between the responses to CCK and ACh have been performed in single isolated mouse pancreatic acinar cells (Osipchuk et al., 1990; Yule et al., 1991; Petersen et al., 1991a; Lawrie et al., 1993; Thorn et al., 1993b), it is not clear whether our conclusions are also applicable to rat pancreatic acinar cells in an acinus. For a start, it is known that gap junctional communication modulates the observed Ca2+ oscillations in rat pancreatic acini (Stauffer et al., 1993), but whether this is sufficient to account quantitatively (or even qualitatively) for the differences in the responses of coupled and isolated cells is not known. Furthermore, it is likely that variations in crucial parameter values, such as pumping and influx rates, will lead to quantitatively different model behavior, and such differences may be one way to explain the differing responses of rat and mice pancreatic acinar cells. However, we have not done exhaustive parameter studies and so cannot say for certain. Note, however, that baseline spiking in response to application of ACh is also seen in mouse pancreatic acinar cells, as long as the concentration of ACh is low enough. Hence, our model is consistent with the data from rat pancreatic acinar cells in this low concentration limit. It is thus plausible that the basic mechanisms are similar in both rat and mice pancreatic acinar cells, differing only in the details of certain parameter values.
In our model, we have assumed that phosphorylation of the IP3R shunts it into a closed state; it is important to note that this is assuming that phosphorylation neither inhibits nor potentiates Ca2+ release. Hence, the assumptions underlying our model are consistent with both effects of PKA. This can easily be seen by the following argument. If k 3 were small, then the intrinsic recovery of the IP3R from the inactivated state would be slow; if the rates of phosphorylation and dephosphorylation (k 4 and k 5) were large enough, it is possible that shunting the receptor through the phosphorylated I2 state could increase the steady state open probability. Conversely, if k 3 were large, and thus the intrinsic recovery from inactivation was fast, then shunting the receptor through the phosphorylated state could decrease the steady state open probability. In fact, we can derive an explicit relationship between k 3, k 4, and k 5 that will determine the exact effects of phosphorylation on the steady state open probability. The steady state proportion of open receptors, O, can be easily calculated as
 |
9 |
where
 |
10 |
Thus, the function φ controls the sensitivity of the IP3R to IP3; as φ increases, the sensitivity of the IP3R decreases, and vice versa. A short calculation now shows that φ is an increasing function of k 4 when 2k 3 > k 5 − k 4, and is a decreasing function of k 4 when 2k 3 < k 5 − k 4. It follows that, depending on the values chosen for k 3, k 4, and k 5, the model can reproduce either an increase or a decrease of sensitivity of the IP3R upon phosphorylation.
Oscillations in the model occur for constant [IP3], and are the result of cycles of activation and inactivation of the IP3R. At present, there is no direct evidence for our assumption that oscillations in [IP3] are not necessary to obtain [Ca2+]i oscillations. From experiments using nonmetabolizable analogs of IP3, there is indirect evidence that the observed [Ca2+]i oscillations are not governed by underlying oscillations in [IP3] (Wakui et al., 1989; Thorn et al., 1993b). However, a complete resolution of this question awaits an experimental determination of the kinetic behavior of [IP3] during the course of a [Ca2+]i oscillation. During application of an agonist, [IP3] will certainly rise and fall as IP3 is produced and degraded. We do not build these features into our model directly, but just assume that IP3 is produced and degraded with given rates. Thus, in the simulations, [IP3] increases and decreases gradually. This has little effect on the oscillatory behavior of the model, which can be well understood by considering the behavior at fixed [IP3].
Although it appears that ryanodine receptors do exist in pancreatic acinar cells, we have not included in the model any possible effects of ryanodine receptors or IP3-independent Ca2+-induced Ca2+ release. Kasai et al. (1993) have shown that the response to ACh is eliminated by heparin, although there is still Ca2+-induced Ca2+ release from the granular area. Thus, although it is likely that IP3-independent factors are important for modulating the shape of the [Ca2+]i oscillations, it appears that they cannot, by themselves, support oscillations. Nathanson et al. (1992) have also shown that Ca2+-induced Ca2+ release has an effect on the speed of ACh and CCK-stimulated intracellular [Ca2+]i waves. However, neither caffeine nor ryanodine eliminates the waves, although they do decrease the wave speed. Furthermore, the intracellular waves are initiated at the apical zone of the cell, which is where the type-III IP3 receptors are mostly found (Nathanson et al., 1994). We interpret these results to mean that the oscillatory period and other fundamental oscillation properties are determined primarily by the properties of the IP3 receptors in the apical zone, with other forms of Ca2+-induced Ca2+ release playing only a modulatory role. Hence, for simplicity, in this model we consider only IP3 receptors.
One major difference between our model and previous ones is in the assumption of how Ca2+ affects the IP3 receptor. Rather than assuming actual Ca2+ binding sites on the receptor (which are not well characterized), we assume that the actions of Ca2+ arise from its effect on IP3 binding. Thus, although [IP3] is constant during an oscillation, IP3 nevertheless plays an active dynamic role, as oscillations in [Ca2+]i are driven by cycles of IP3 binding and unbinding from the receptor. In the case of CCK-induced oscillations, the receptor also undergoes periodic cycles of phosphorylation and dephosphorylation; the oscillation period is then set by the rate of receptor dephosphorylation, rather than by the rate of receptor recovery from inactivation. Calcium-induced calcium release also plays an important role. As [Ca2+]i increases, the rate of IP3 binding to the receptor is increased (S to O transition), leading to an effective calcium activation of the receptor.
Another major difference from previous models is our use of the phosphorylation pathway, through which some agonists will shunt the receptor. It has been recognized for some time that a third mechanism, in addition to Ca2+ activation and inactivation of the IP3R, is required to explain the long interspike intervals that occur in some cells (see, for example, Oancea and Meyer, 1996, for an excellent discussion of this). Indeed, phosphorylation and dephosphorylation of the IP3R has previously been proposed as a possible mechanism for setting the interspike interval (Cameron et al., 1995; Zhu et al., 1996; in these papers, the phosphorylation was assumed to be Ca2+ dependent, which it does not appear to be in our cell type). We have shown that such a hypothesis is quantitatively consistent with the observed oscillations, we have collected experimental data that show agonist-dependent rates of phosphorylation of the IP3 receptor and have shown that a single mechanism can be used as a framework to understand widely differing experimental results in a single cell type. Ours is not the first model to generate long interspike intervals. Laurent and Claret (1997) constructed a model of Monod-Wyman-Changeux type and showed that, with appropriate choices of the parameters, the model could reproduce long-period oscillations, while Dupont and Swillens (1996) postulated the existence of an intermediate Ca2+ domain around the mouth of the receptor to achieve a similar result. Our model differs from these in that we present a single mechanism that can generate a wide variety of oscillatory patterns, and then show experimentally that the necessary elements of the model exist in a particular cell type.
The simplicity of our model can, in some circumstances, be a disadvantage. Our assumption of independent subunits is unlikely to be correct (as pointed out by Laurent and Claret, 1997), and a more detailed allosteric model of the effects of Ca2+ on IP3 binding would presumably increase the model's accuracy. However, we believe that the additional complications introduced by such procedures are unlikely to be a worthwhile expenditure of effort at this stage. More detailed models of the receptor states and phosphorylations can wait until the properties of the pancreatic acinar IP3 receptors are known in more detail, and until spatial effects are better understood.
Zhu et al. (1996) have presented a qualitative model that, in many respects, is similar to ours. They conclude that histamine-stimulated Ca2+ oscillations in HeLa cells result from cycles of phosphorylation and dephosphorylation of the IP3R by CaMK-II. In their model, just as in ours, phosphorylation of the IP3R inhibits Ca2+ release by closing the channel. They showed that inhibition of the phosphatase by calyculin A or okadaic acid (which corresponds to a reduction in k 5 in our model) increases the oscillation period, and this result is reproduced by our model (computations not shown). This emphasizes the importance of receptor dephosphorylation for setting the period of CCK-induced oscillations. In addition, our model is easily adapted to simulate phosphorylation of CaMK-II by letting k 4 = c 4/(0.54 + c 4). This assumes that phosphorylation by CaMK-II is modulated by Ca2+ in a cooperative fashion, and thus includes the possibility of feedback from the Ca2+ signal to receptor phosphorylation. In this case, the model again exhibits long-period baseline spiking (computations not shown).
One principal feature of our model that is supported only indirectly is the assumption that ACh increases membrane transport of Ca2+, while CCK increases it to a lesser extent. In other words, when the cell is at steady state (i.e., in the absence of agonist stimulation) there is a continual, but small, flux of Ca2+ through the cytoplasm, as Ca2+ leaks into the cell and is quickly removed. Upon ACh stimulation, overall membrane transport of Ca2+ is greatly increased, in both directions, and this, in combination with activation of the IP3R, results in raised-baseline, sinusoidal, oscillations that are dependent on external Ca2+. CCK, on the other hand, increases membrane transport of Ca2+ only slightly, and thus CCK-induced oscillations depend on external Ca2+ much less. It has been known for some years that the rate of Ca2+ turnover is low at steady state, and that agonists such as CCh and CCK increase the rate of Ca2+ pumping out of the cytoplasm, as well as increasing the rate of Ca2+ influx (Muallem and Beeker, 1989; Zhang et al., 1992). However, what is not clear is whether ACh increases the rate of Ca2+ turnover more than does CCK. Our model makes the assumption that it does. Although we used our model to make predictions about the effects of removing external Ca2+ and subsequently increasing [ACh], and these predictions were confirmed experimentally, and although the model provides a consistent framework that can possibly explain the different effects of low extracellular Ca2+ on ACh- or CCK-induced oscillations, this is still only indirect evidence for this assumption. One important test of the model will be to compare transmembrane and trans–ER Ca2+ fluxes directly, in the presence of CCK or ACh, or neither.
Lawrie et al. (1993) have shown that application of ACh in the absence of external Ca2+ will initially cause oscillations, but these die away within a few minutes. This particular result is not reproduced by our model because of the simplified way in which it treats Ca2+ pumping. When Ca2+ is removed from the cytoplasm by pumps, it can be removed either to the outside or to the ER. It is easy to see that the rate of removal to the ER has no effect on the long term steady state [Ca2+]i of the cell, which can only be affected by Ca2+ transport across the plasma membrane. When ACh is applied to a cell in low [Ca2+]i, the kinetics of the IP3R can still lead to cycles of Ca2+ release and uptake from the ER, but each time Ca2+ is released into the cell cytoplasm, a fraction of it is lost to the outside. Eventually, the cell runs down and oscillations stop, as observed. Thus, over a longer time scale, depletion of the ER plays a role in terminating Ca2+ oscillations. The only way to model this is to treat Ca2+ transport across the ER membrane separately from Ca2+ transport across the plasma membrane, a feature that is omitted from our model for the sake of simplicity. However, we have constructed an extended version of the model, in which we take into account depletion of the ER (LeBeau, Yule, and Sneyd, unpublished data). The extended model behaves in a similar manner to the model presented here, but can account for a wider array of experimental results, including long-time oscillatory behavior and the application of ACh in the absence of external Ca2+. Details of this model and comparison with experimental results will be presented in a later paper.
Another important feature of the model is the assumption that an increase in [Ca2+]i causes an increase in the binding affinity of IP3 to its receptor. The experimental data on the properties of IP3 binding as a function of Ca2+ are not completely consistent. Yoneshima et al. (1997) claim that Ca2+ increases the binding affinity of IP3 to type-III receptors, but decreases the binding affinity to type-I receptors. However, Cardy et al. (1997), although agreeing that the major effect of Ca2+ on IP3 binding is stimulatory for type-III and inhibitory for type-I receptors, claim that these effects are mediated by changes in the maximal binding (although, for type-III receptors, more complex effects occur at higher Ca2+ concentrations). Nevertheless, they conclude that Ca2+ regulates the interconversion of the IP3R between two different states, one state with a high IP3 affinity, and the other with a low affinity. This interpretation is entirely consistent with our results, as our model can in fact be rigorously derived by considering just such a receptor mechanism (Sneyd, LeBeau, and Yule, manuscript submitted for publication).
As we show in the Appendix, a decrease in IP3 binding affinity with increasing Ca2+ implies that the peak of the steady state open probability curve shifts to the right as [IP3] increases. Conversely, an increase in the IP3 binding affinity with increasing Ca2+ implies that the steady state open probability curve will shift to the left with increasing [IP3]. Thus, since type-I receptors have a decreasing IP3 binding affinity with increasing Ca2+, the model predicts that the steady state open probability curve will shift to the right with increasing [IP3], exactly as seen by Kaftan et al. (1997). On the other hand, since type-III receptors have an increasing IP3 binding affinity with increasing Ca2+, we predict that the steady state open probability curve will shift to the left with increasing [IP3]. These measurements have yet to be performed. No models to date (at least that we know of) have investigated the effects of changes in the maximal binding. In this context, it is important to note that the open probability curve at infinite [IP3] does not give the maximal binding curve. In our model (and all other receptor binding models that we have investigated), the maximal binding fraction is always 1 and, as in the presence of large amounts of IP3, all receptors will bind IP3.
As well as the temporal responses to ACh and CCK being quite different, the spatial characteristics of the response are also agonist dependent (Lawrie et al., 1993; Thorn et al.; 1993a; Xu et al., 1996b). ACh- induced oscillations are initiated at the secretory pole of the cell, and spread from there across the cell, with the response at the basal pole being consistently of smaller amplitude and slightly delayed. During the course of this intracellular wave, significant Ca2+ gradients are maintained in the cell cytoplasm. CCK, on the other hand, causes an increase in [Ca2+]i that is simultaneous across the entire cell, with no change in amplitude from secretory to basal poles. Furthermore, these intracellular Ca2+ waves can be transmitted intercellularly when individual cells in acini are coupled to their neighbors via gap junctions (Yule et al., 1996). A prerequisite for the study of such intra- and intercellular waves is a detailed understanding of the kinetics underlying the oscillatory response in each individual cell. Thus, although the current study does not address these questions, our model provides a useful framework that can be used to study the problem of wave propagation in this cell type.
Acknowledgments
We thank John Williams for helpful discussions. We also thank Dr. Jean-François Dufour, The American Society for Biochemistry and Molecular Biology Inc., and Cell Calcium for permission to reprint figures.
This work was supported by grants from the New Zealand Lottery Grants Board (AP047957), the Marsden Fund of the Royal Society of New Zealand, NIGMS grant R01 GM56126 (J. Sneyd), National Science Foundation grant DMS 9706565 (JS) and National Institute of Diabetes and Digestive and Kidney Diseases grant R01 DK54568 (D.I. Yule).
Abbreviations used in this paper
- Ach
acetylcholine
- CaMK-II
Ca2+-calmodulin kinase II
- CCK
cholecystokinin
- CPA
cyclopiazonic acid
- ER
endoplasmic reticulum
- IP3
inositol 1,4,5-trisphosphate
- IP3R
IP3 receptor
appendix
The Steady State Open Probability of the IP3R
In the majority of current models of the IP3R, the steady state receptor open probability, O, can be expressed in the general form
 |
11 |
for some functions Θ1 and Θ2. The exact form of these two functions differs from model to model. However, we note two things. First, p = Θ2(c) gives the half-maximal IP3 binding to the receptor, and thus Θ2(c) is the EC50 of the IP3 receptor, with respect to IP3 binding. It thus follows from experimental data (Yoneshima et al., 1997) that, for type-I receptors, Θ2 is an increasing function of Ca2+, while for type-III receptors, Θ2 is a decreasing function of Ca2+. Secondly, Θ1(c) is the open probability as a function of c, when p is very large; i.e., in the limit of high [IP3].
Bell-shaped Steady State Curve
If O is a bell-shaped function of c, it follows that it must have a turning point, at which place  = 0. Hence, at the turning point,
 |
12 |
If we let c 0 denote the position of the turning point, then Eq. 12 can be solved to obtain c 0 = c 0(p). We want to know whether c 0 is an increasing or decreasing function of p. In other words, does the peak of the bell-shaped curve move to the right or to the left as p increases.
First, we note that an implicit differentiation gives
 |
13 |
It thus follows that the only way c′0(p) can change sign is if Θ′1(c 0) changes sign. [We do not let the denominator change sign, because if it did, then c′0(p) would become infinite, which is clearly unphysiological. For the same reason, we also exclude singular cases, where both the numerator and denominator vanish together.] Finally, we note that, at the turning point, p + Θ2 = Θ1Θ′2/Θ′1, and so, from Eq. 11, it follows that the open probability at the turning point, O tp, is given by
 |
14 |
We know that, for type-I receptors, Θ2 is an increasing function of c. Hence, for this receptor type, Θ′2 > 0. From Eq. 14, it now follows that O tp is positive only when Θ′1 > 0 at the turning point. However, recall that Θ1 is just the open probability curve at high p. Hence, for lower values of p, the peak of the open probability curve must occur at values of c for which Θ′1 > 0. Since Θ′1 cannot change sign, neither can c′0(p). It remains only to determine which sign it is. However, it is easy to see that, when p is large, c′0(p) must be positive. Hence, c′0(p) is always positive for all p, from which it follows that the peak of the bell-shaped curve must move to the right as p increases. [It is interesting to note that the same argument works when Θ2 is a decreasing function of c, and thus Θ1 < 0. In this case, c′0(p) is always negative for all p, from which it follows that the peak of the bell-shaped curve must move to the left as p increases.)
Monotonic Steady State Curve
Type-III receptors do not have bell-shaped steady state open probability curves, and thus the above argument does not apply to them. However, a similar argument can be used to show that the steady state open probability curve (i.e., the point of maximum slope) shifts to the left as p increases.
Suppose the steady state open probability curve is monotonically increasing, and define
 |
15 |
 |
16 |
For a fixed value of p, the steady state open probability curve, O, reaches half its maximum value at the point c 0, where c 0 is found by solving the equation
 |
17 |
Note that this defines c 0 as a function of p; i.e., c 0(p). We now want to find out whether c 0 is an increasing function of p (in which case the curves shift to the right as p increases), or a decreasing function of p (in which case the curves shift to the left as p increases).
Differentiate both sides with respect to p to get
 |
18 |
where all functions of c are evaluated at c 0.
For a type-III receptor, Θ′2(c) < 0 (as argued above), and we also suppose that the steady state open probability curve is monotonic for all IP3 concentrations and thus Θ′1(c) > 0. If, for any p, the steady state curve becomes bell-shaped, the previous argument applies. Since
 |
19 |
it now follows that θ < θ2(c), and θ
 > θ1(c), and thus c ′0( p) < 0.
In conclusion, we have predicted that, as p increases, the steady state open probability curve of a type-III IP3R will move to the left. To our knowledge, this has not yet been experimentally measured.
Footnotes
Drs. Yule and Groblewski's present address is Department of Pharmacology and Physiology, University of Rochester, School of Medicine, Rochester, NY.
references
- Atri A, Amundson J, Clapham D, Sneyd J. A single-pool model for intra-cellular calcium oscillations and waves in the Xenopus laevisoocyte. Biophysical J. 1993;65:1727–1739. doi: 10.1016/S0006-3495(93)81191-3. [DOI] [PMC free article] [PubMed] [Google Scholar]
- Berridge MJ. Calcium oscillations. J Biol Chem. 1990;265:9583–9586. [PubMed] [Google Scholar]
- Berridge MJ, Potter BVL. Inositol trisphosphate analogues induce different oscillatory patterns in Xenopusoocytes. Cell Regul. 1990;1:675–681. doi: 10.1091/mbc.1.9.675. [DOI] [PMC free article] [PubMed] [Google Scholar]
- Berridge MJ. Elementary and global aspects of calcium signalling. J Physiol. 1997;499:291–306. doi: 10.1113/jphysiol.1997.sp021927. [DOI] [PMC free article] [PubMed] [Google Scholar]
- Bezprozvanny I. Theoretical analysis of calcium wave propagation based on inositol (1,4,5)-trisphosphate (InsP3) receptor functional properties. Cell Calc. 1994;16:151–166. doi: 10.1016/0143-4160(94)90019-1. [DOI] [PubMed] [Google Scholar]
- Bezprozvanny I, Ehrlich BE. The inositol 1,4,5-trisphosphate (InsP3) receptor. J Membr Biol. 1995;145:205–216. doi: 10.1007/BF00232713. [DOI] [PubMed] [Google Scholar]
- Camello PJ, Petersen OH, Toescu EC. Simultaneous presence of cAMP and cGMP exert a co-ordinated inhibitory effect on the agonist-evoked Ca2+signal in pancreatic acinar cells. Pflügers Arch. 1966;432:775–781. doi: 10.1007/s004240050198. [DOI] [PubMed] [Google Scholar]
- Cameron AM, Steiner JP, Roskams AJ, Ali SM, Ronnett GV, Snyder SH. Calcineurin associated with the inositol 1,4,5-trisphosphate receptor-FKBP12 complex modulates Ca2+flux. Cell. 1995;83:463–472. doi: 10.1016/0092-8674(95)90124-8. [DOI] [PubMed] [Google Scholar]
- Cardy TJ, Traynor D, Taylor CW. Differential regulation of types-1 and -3 inositol trisphosphate receptor by cytosolic Ca2+ . Biochem J. 1997;328:785–793. doi: 10.1042/bj3280785. [DOI] [PMC free article] [PubMed] [Google Scholar]
- De Young GW, Keizer J. A single pool IP3-receptor based model for agonist stimulated Ca2+oscillations. Proc Natl Acad Sci USA. 1992;89:9895–9899. doi: 10.1073/pnas.89.20.9895. [DOI] [PMC free article] [PubMed] [Google Scholar]
- Dufour J-F, Arias IM, Turner TJ. Inositol 1,4,5-trisphosphate and calcium regulate the calcium channel function of the hepatic inositol 1,4,5-trisphosphate receptor. J Biol Chem. 1997;272:2675–2681. doi: 10.1074/jbc.272.5.2675. [DOI] [PubMed] [Google Scholar]
- Dupont G, Swillens S. Quantal release, incremental detection and long-period Ca2+ oscillations in a model based on regulatory Ca2+-binding sites along the permeation pathway. Biophys J. 1996;71:1714–1722. doi: 10.1016/S0006-3495(96)79373-6. [DOI] [PMC free article] [PubMed] [Google Scholar]
- Finch EA, Turner TJ, Goldin SM. Calcium as a coagonist of inositol 1,4,5-trisphospate-induced calcium release. Science. 1991;252:443–446. doi: 10.1126/science.2017683. [DOI] [PubMed] [Google Scholar]
- Grynkiewicz G, Poenie M, Tsien RY. A new generation of Ca2+indicators with greatly improved fluorescent properties. J Biol Chem. 1985;260:3440–3450. [PubMed] [Google Scholar]
- Hagar RE, Burgstahler AD, Nathanson MH, Ehrlich BE. Type III InsP3receptor channel stays open in the presence of increased calcium. Nature. 1998;396:81–84. doi: 10.1038/23954. [DOI] [PMC free article] [PubMed] [Google Scholar]
- Hajnóczky G, Gao E, Nomura T, Hoek JB, Thomas AP. Multiple mechanisms by which protein kinase A potentiates inositol 1,4,5-trisphosphate-induced Ca2+mobilization in permeabilized hepatocytes. Biochem J. 1993;293:413–422. doi: 10.1042/bj2930413. [DOI] [PMC free article] [PubMed] [Google Scholar]
- Hajnóczky G, Thomas AP. The inositol trisphosphate calcium channel is inactivated by inositol trisphosphate. Nature. 1994;370:474–477. doi: 10.1038/370474a0. [DOI] [PubMed] [Google Scholar]
- Hajnóczky G, Thomas AP. Minimal requirements for calcium oscillations driven by the IP3receptor. EMBO (Eur Mol Biol Organ) J. 1997;16:3533–3543. doi: 10.1093/emboj/16.12.3533. [DOI] [PMC free article] [PubMed] [Google Scholar]
- Joseph SK, Ryan SV. Phosphorylation of the inositol trisphosphate receptor in isolated rat hepatocytes. J Biol Chem. 1993;268:23059–23065. [PubMed] [Google Scholar]
- Joseph SK. The inositol triphosphate receptor family. Cell Signal. 1996;8:1–7. doi: 10.1016/0898-6568(95)02012-8. [DOI] [PubMed] [Google Scholar]
- Kaftan EJ, Ehrlich BE, Watras J. Inositol 1,4,5-trisphosphate (InsP3) and calcium interact to increase the dynamic range of InsP3receptor-dependent calcium signaling. J Gen Physiol. 1997;110:529–538. doi: 10.1085/jgp.110.5.529. [DOI] [PMC free article] [PubMed] [Google Scholar]
- Kasai H, Li Y-X, Miyashita Y. Subcellular distribution of Ca2+ release channels underlying Ca2+waves and oscillations in exocrine pancreas. Cell. 1993;74:669–677. doi: 10.1016/0092-8674(93)90514-q. [DOI] [PubMed] [Google Scholar]
- Kawanishi T, Blank LM, Harootunian AT, Smith MT, Tsien RY. Ca2+oscillations induced by hormonal stimulation of individual fura-2–loaded hepatocytes. J Biol Chem. 1989;264:12859–12866. [PubMed] [Google Scholar]
- Laurent M, Claret M. Signal-induced Ca2+ oscillations through the regulation of the inositol 1,4,5-trisphosphate-gated Ca2+channel: an allosteric model. J Theor Biol. 1997;186:307–326. doi: 10.1006/jtbi.1996.0365. [DOI] [PubMed] [Google Scholar]
- Lawrie AM, Toescu EC, Gallacher DV. Two different spatiotemporal patterns for Ca2+ oscillations in pancreatic acinar cells: evidence of a role for protein kinase C in Ins(1,4,5)P3-mediated Ca2+signalling. Cell Calc. 1993;14:698–710. doi: 10.1016/0143-4160(93)90096-o. [DOI] [PubMed] [Google Scholar]
- Li Y-X, Rinzel J, Keizer J, Stojilković SS. Calcium oscillations in pituitary gonadotrophs: comparison of experiment and theory. Proc Natl Acad Sci USA. 1994;91:58–62. doi: 10.1073/pnas.91.1.58. [DOI] [PMC free article] [PubMed] [Google Scholar]
- Li Y-X, Rinzel J. Equations for InsP3 receptor-mediated [Ca2+] oscillations derived from a detailed kinetic model: a Hodgkin-Huxley like formalism. J Theor Biol. 1994;166:461–473. doi: 10.1006/jtbi.1994.1041. [DOI] [PubMed] [Google Scholar]
- Li Y-X, Stojilković SS, Keizer J, Rinzel J. Sensing and refilling calcium stores in an excitable cell. Biophys J. 1997;72:1080–1091. doi: 10.1016/S0006-3495(97)78758-7. [DOI] [PMC free article] [PubMed] [Google Scholar]
- Loessberg PA, Zhao H, Muallem S. Synchronized oscillation of Ca2+ entry and Ca2+release in agonist-stimulated AR42J cells. J Biol Chem. 1991;266:1363–1366. [PubMed] [Google Scholar]
- Lytton J, Westlin M, Burk SE, Shull GE, MacLennan DH. Functional comparisons between isoforms of the sarcoplasmic or endoplasmic reticulum family of calcium pumps. J Biol Chem. 1992;2667:14483–14489. [PubMed] [Google Scholar]
- Marchant JS, Chang Y-T, Chung S-K, Irvine RF, Taylor CW. Rapid kinetic measurements of 45Ca2+ mobilization reveal that Ins(2,4,5)P3 is a partial agonist at hepatic InsP3receptors. Biochem J. 1997;321:573–576. doi: 10.1042/bj3210573. [DOI] [PMC free article] [PubMed] [Google Scholar]
- Marchant JS, Taylor CW. Rapid activation and partial inactivation of inositol trisphosphate receptors by inositol trisphosphate. Biochemistry. 1998;37:11524–11533. doi: 10.1021/bi980808k. [DOI] [PubMed] [Google Scholar]
- Marshall ICB, Taylor CW. Biphasic effects of cytosolic Ca2+ on Ins(1,4,5)P3-stimulated Ca2+mobilization in hepatocytes. J Biol Chem. 1993;268:13214–13220. [PubMed] [Google Scholar]
- Muallem S, Beeker TG. Relationship between hormonal, GTP and Ins(1,4,5)P3-stimulated Ca2+uptake and release in pancreatic acinar cells. Biochem J. 1989;263:333–339. doi: 10.1042/bj2630333. [DOI] [PMC free article] [PubMed] [Google Scholar]
- Muallem S, Zhao H, Mayer E, Sachs G. Regulation of intracellular calcium in epithelial cells. Semin Cell Biol. 1990;1:305–310. [PubMed] [Google Scholar]
- Nathanson MH, Padfield PJ, O'Sullivan AJ, Burgstahler AD, Jamieson JD. Mechanism of Ca2+wave propagation in pancreatic acinar cells. J Biol Chem. 1992;267:18118–18121. [PubMed] [Google Scholar]
- Nathanson MH, Fallon MB, Padfield PJ, Maranto AR. Localization of the type 3 inositol 1,4,5-trisphosphate receptor in the Ca2+wave trigger zone of pancreatic acinar cells. J Biol Chem. 1994;269:4693–4696. [PubMed] [Google Scholar]
- Oancea E, Meyer T. Reversible desensitization of inositol trisphosphate–induced calcium release provides a mechanism for repetitive calcium spikes. J Biol Chem. 1996;271:17253–17260. doi: 10.1074/jbc.271.29.17253. [DOI] [PubMed] [Google Scholar]
- Osipchuk YV, Wakui M, Yule DI, Gallacher DV, Petersen OH. Cytoplasmic Ca2+ oscillations evoked by receptor stimulation, G-protein activation, internal application of inositol trisphosphate or Ca2+: simultaneous microfluorimetry and Ca2+ dependent C1−current recording in single pancreatic acinar cells. EMBO (Eur Mol Biol Organ) J. 1990;9:697–704. doi: 10.1002/j.1460-2075.1990.tb08162.x. [DOI] [PMC free article] [PubMed] [Google Scholar]
- Parker I, Ivorra I. Inhibition by Ca2+ of inositol trisphosphate–mediated Ca2+ liberation: a possible mechanism for oscillatory release of Ca2+ . Proc Natl Acad Sci USA. 1990;87:260–264. doi: 10.1073/pnas.87.1.260. [DOI] [PMC free article] [PubMed] [Google Scholar]
- Petersen OH, Wakui M. Oscillating intracellular Ca2+signals evoked by activation of receptors linked to inositol lipid hydrolysis: mechanism of generation. J Membr Biol. 1990;118:93–105. doi: 10.1007/BF01868467. [DOI] [PubMed] [Google Scholar]
- Petersen OH, Gallacher DV, Wakui M, Yule DI, Petersen CCH, Toescu EC. Receptor-activated cytoplasmic Ca2+ oscillations in pancreatic acinar cells: generation and spreading of Ca2+signals. Cell Calc. 1991a;12:135–144. doi: 10.1016/0143-4160(91)90015-7. [DOI] [PubMed] [Google Scholar]
- Peterson CCH, Toescu EC, Petersen OH. Different patterns of receptor-activated cytoplasmic Ca2+ oscillations in single pancreatic acinar cells: dependence on receptor type, agonist concentration and intracellular Ca2+buffering. EMBO (Eur Mol Biol Organ) J. 1991b;10:527–533. doi: 10.1002/j.1460-2075.1991.tb07979.x. [DOI] [PMC free article] [PubMed] [Google Scholar]
- Quinton TM, Dean WL. Cyclic AMP-dependent phosphorylation of the inositol 1,4,5-trisphosphate receptor inhibits Ca2+release from platelet membranes. Biochem Biophys Commun. 1992;184:893–899. doi: 10.1016/0006-291x(92)90675-b. [DOI] [PubMed] [Google Scholar]
- Schulz, I. 1989. Signaling transduction in hormone- and neurotransmitter-induced enzyme secretion from the exocrine pancreas. In Handbook of Physiology. Section 6, The Gastrointestinal System. Vol. III. American Physiological Society, Washington, DC. 443–463.
- Sienaert I, Missiaen L, De Smedt H, Parys JB, Sipma H, Casteels R. Molecular and functional evidence for multiple Ca2+-binding in the type I inositol 1,4,5-trisphosphate receptor. J Biol Chem. 1997;272:25899–25906. doi: 10.1074/jbc.272.41.25899. [DOI] [PubMed] [Google Scholar]
- Sneyd J, Keizer J, Sanderson MJ. Mechanisms of calcium oscillations and waves: a quantitative analysis. FASEB J. 1995;9:1463–1472. doi: 10.1096/fasebj.9.14.7589988. [DOI] [PubMed] [Google Scholar]
- Stauffer PL, Zhao H, Luby-Phelps K, Moss RL, Star RA, Muallem S. Gap junction communication modulates [Ca2+]ioscillations and enzyme secretion in pancreatic acini. J Biol Chem. 1993;268:19769–19775. [PubMed] [Google Scholar]
- Supattapone S, Danoff SK, Theibert A, Joseph SK, Steiner J, Snyder SH. Cyclic AMP-dependent phosphorylation of a brain inositol trisphosphate receptor decreases its release of calcium. Proc Natl Acad Sci USA. 1988;85:8747–8750. doi: 10.1073/pnas.85.22.8747. [DOI] [PMC free article] [PubMed] [Google Scholar]
- Tang Y, Stephenson JL, Othmer HG. Simplification and analysis of models of calcium dynamics based on IP3-sensitive calcium channel kinetics. Biophys J. 1996;70:246–263. doi: 10.1016/S0006-3495(96)79567-X. [DOI] [PMC free article] [PubMed] [Google Scholar]
- Taylor CW, Traynor D. Calcium and inositol trisphosphate receptors. J Membr Biol. 1995;145:109–118. doi: 10.1007/BF00237369. [DOI] [PubMed] [Google Scholar]
- Taylor CW. Inositol trisphosphate receptors: Ca2+-modulated intracellular Ca2+channels. Biochim Biophys Acta. 1998;1436:19–33. doi: 10.1016/s0005-2760(98)00122-2. [DOI] [PubMed] [Google Scholar]
- Tertyshnikova S, Fein A. Inhibition of inositol 1,4,5-trisphosphate-induced Ca2+release by cAMP-dependent protein kinase in a living cell. Proc Natl Acad Sci USA. 1998;95:1613–1617. doi: 10.1073/pnas.95.4.1613. [DOI] [PMC free article] [PubMed] [Google Scholar]
- Thorn P, Lawrie AM, Smith PM, Gallacher DV, Petersen OH. Ca2+oscillations in pancreatic acinar cells: spatiotemporal relationships and functional implications. Cell Calc. 1993a;14:746–757. doi: 10.1016/0143-4160(93)90100-k. [DOI] [PubMed] [Google Scholar]
- Thorn P, Lawrie AM, Smith PM, Gallacher DV, Petersen OH. Local and global cytosolic Ca2+oscillations in exocrine cells evoked by agonists and inositol trisphosphate. Cell. 1993b;74:661–668. doi: 10.1016/0092-8674(93)90513-p. [DOI] [PubMed] [Google Scholar]
- Tsunoda Y, Stuenkel EL, Williams JA. Oscillatory model of calcium signaling in rat pancreatic acinar cells. Am J Physiol. 1990;258:C147–C155. doi: 10.1152/ajpcell.1990.258.1.C147. [DOI] [PubMed] [Google Scholar]
- Volpe P, Alderson-Lang BH. Regulation of inositol 1,4,5-trisphosphate–induced Ca2+release II. Effect of cAMP- dependent protein kinase. Am J Physiol. 1990;258:C1086–C1091. doi: 10.1152/ajpcell.1990.258.6.C1086. [DOI] [PubMed] [Google Scholar]
- Wakui J, Potter BVL, Petersen OH. Pulsatile intracellular calcium release does not depend on fluctuations in inositol trisphosphate concentration. Nature. 1989;339:317–320. doi: 10.1038/339317a0. [DOI] [PubMed] [Google Scholar]
- Watras J, Bezprozvanny I, Ehrlich BE. Inositol 1,4,5-trisphosphate–gated channels in cerebellum: presence of multiple conductance states. J Neurosci. 1991;11:3239–3245. doi: 10.1523/JNEUROSCI.11-10-03239.1991. [DOI] [PMC free article] [PubMed] [Google Scholar]
- Williams JA, Korc M, Dormer R. Action of secretagogues on a new preparation of functionally intact pancreatic acini. Am J Physiol. 1978;235:E517–E524. doi: 10.1152/ajpendo.1978.235.5.E517. [DOI] [PubMed] [Google Scholar]
- Wojcikiewicz RJH. Type I, II, and III inositol 1,4,5-trisphosphate receptors are unequally susceptible to down-regulation and are expressed in markedly different proportions in different cell types. J Biol Chem. 1995;270:11678–11683. doi: 10.1074/jbc.270.19.11678. [DOI] [PubMed] [Google Scholar]
- Wojcikiewicz RJ, Luo SG. Phosphorylation in inositol 1,4,5-trisphosphate receptors by cAMP-dependent protein kinase. Type I, II, and III receptors are differentially susceptible to phosphorylation and are phosphorylated in intact cells. J Biol Chem. 1998;273:5670–5677. doi: 10.1074/jbc.273.10.5670. [DOI] [PubMed] [Google Scholar]
- Xu X, Kitamura K, Lau KS, Muallem S, Miller RT. Differential regulation of Ca2+ release-activated Ca2+influx by heterotrimeric G proteins. J Biol Chem. 1995;270:29169–29175. doi: 10.1074/jbc.270.49.29169. [DOI] [PubMed] [Google Scholar]
- Xu X, Zeng W, Muallem S. Regulation of the inositol 1,4,5-trisphosphate–activated Ca2+by activation of G proteins. J Biol Chem. 1996a;271:11737–11744. doi: 10.1074/jbc.271.20.11737. [DOI] [PubMed] [Google Scholar]
- Xu X, Zeng W, Diaz J, Muallem S. Spacial compartmentalization of Ca2+signaling complexes in pancreatic acini. J Biol Chem. 1996b;271:24684–24690. doi: 10.1074/jbc.271.40.24684. [DOI] [PubMed] [Google Scholar]
- Xu X, Zeng W, Diaz J, Lau KS, Gukovskaya AC, Brown RJ, Pandol SJ, Muallem S. nNOS and Ca2+influx in rat pancreatic acinar and submandibular salivary gland cells. Cell Calc. 1997;22:217–228. doi: 10.1016/s0143-4160(97)90015-4. [DOI] [PubMed] [Google Scholar]
- Yoneshima H, Miyawaki A, Michikawa T, Furuichi T, Mikoshiba K. Ca2+differentially regulates the ligand-affinity states of type 1 and type 3 inositol 1,4,5-trisphosphate receptors. Biochem J. 1997;322:591–596. doi: 10.1042/bj3220591. [DOI] [PMC free article] [PubMed] [Google Scholar]
- Yoshida Y, Imai S. Structure and function and inositol 1,4,5-trisphosphate receptor. Jpn J Pharmacol. 1997;74:125–137. doi: 10.1254/jjp.74.125. [DOI] [PubMed] [Google Scholar]
- Yule DI, Gallacher DV. Oscillations of cytosolic calcium in single pancreatic acinar cells stimulated by acetylcholine. FEBS Lett. 1988;239:358–362. doi: 10.1016/0014-5793(88)80951-7. [DOI] [PubMed] [Google Scholar]
- Yule DI, Lawrie AM, Gallacher DV. Acetylcholine and cholecystokinin induce different patterns of oscillating calcium signals in pancreatic acinar cells. Cell Calc. 1991;12:145–151. doi: 10.1016/0143-4160(91)90016-8. [DOI] [PubMed] [Google Scholar]
- Yule DI, Tseng M-J, Williams JA, Logsdon CD. A cloned CCK-A receptor transduces multiple signals in response to full and partial agonists. Am J Physiol. 1993;265:G999–G1004. doi: 10.1152/ajpgi.1993.265.5.G999. [DOI] [PubMed] [Google Scholar]
- Yule DI, Stuenkel E, Williams JA. Intercellular calcium waves in rat pancreatic acini: mechanism of transmission. Am J Physiol. 1996;271:C1285–C1294. doi: 10.1152/ajpcell.1996.271.4.C1285. [DOI] [PubMed] [Google Scholar]
- Zhang BX, Zhao H, Loessberg P, Muallem S. Activation of the plasma membrane Ca2+pump during agonist stimulation of pancreatic acini. J Biol Chem. 1992;267:15419–15425. [PubMed] [Google Scholar]
- Zhu D-M, Tekle E, Chock PB, Huang CY. Reversible phosphorylation as a controlling factor for sustaining calcium oscillations in HeLa cells: involvement of calmodulin-dependent kinase II and a calyculin A-inhibitable phosphatase. Biochemistry. 1996;35:7214–7223. doi: 10.1021/bi952471h. [DOI] [PubMed] [Google Scholar]