Abstract
Fundamental questions about role of the quaternary structures are addressed by using a statistical mechanics off-lattice model of a dimer protein. The model, in spite of its simplicity, captures key features of the monomer–monomer interactions revealed by atomic force experiments. Force curves during association and dissociation processes are characterized by sudden jumps followed by smooth behavior and form hysteresis loops. Furthermore, the process is reversible in a finite range of temperature stabilizing the dimer, and the width of the hysteresis loop increases as the design procedure improves: i.e., stabilizes the dimer more. It is shown that, in the interface between the two monomeric subunits, the design procedure naturally favors those amino acids whose mutual interaction is stronger.
Molecular recognition is a process by which two biological molecules interact to form a specific complex. Structural domains of proteins recognize ligands, nucleic acid, and other proteins in nearly all fundamental biological processes. The recognition comprises a large spectrum of specific nonbonded interactions, such as van der Waals interactions, hydrogen bonding, and salt bridges, which overcame the loss of conformational entropy on association (1). These interactions are ubiquitous, yet they are responsible for the exquisite specificity of the aggregation. Understanding the aggregation process is important not only for our comprehension of the formation of the molecular aggregates but also to gain insights on how the interactions cancel each other in the many other possible supramolecular modes of association. Investigating the nature of association also can shed light on the protein-folding processes because the aggregation process can be described as the transfer of surface from water to the protein interior. Useful information also can be obtained on the complex relationship between cooperativity and quaternary structure in proteins such as myoglobin. Finally, such type of studies can have important application in pharmacology and medicine. A typical example in this respect is insulin, a protein whose efficiency for the treatment of insulin-dependent diabetes could be boosted by a better understanding of the association/dissociation mechanism (ref. 2 and references therein). A deep understanding of the aggregation mechanism is of current interest also in anti-AIDS research. Subunit–subunit association inhibitors of the dimeric enzyme HIV-1 protease are currently putative agents against HIV infection (3). These drugs are ligands with high affinity at the interface region.
Although several biochemical and biophysical experiments have been directed toward characterizing thermodynamic (1, 4, 5) and kinetic (6) aspects of protein–protein interactions, a small number of experimental (7) and theoretical (see, for example, ref. 8) studies have addressed the role of subunit association at the atomic level. In this respect, an elegant experiment is represented by the determination of the monomeric structure of a dimeric enzyme, Cu, Zn superoxide dismutase obtained by mutating key residues at the subunit–subunit interface (7). The three-dimensional structure of the single subunit exhibits small differences with the native enzyme, yet the conformation is less favorable of the substrate to the reaction site, indicating an essential role of the quaternary structure.
Subunit–subunit interactions have been recently measured by direct force measurements. Yip et al. (9) have revealed the complexity of the insulin dimer dissociation and have shown the energetics associated to the disruption of discrete molecular bonds at the monomer–monomer interface. Although these studies are capable of quantifying the forces governing protein aggregation, the fundamental question on how the design quality of proteins (namely its topology and its three dimensional structure) affects domains of different subunits has never been addressed. Here, we use a simple statistical mechanical model to investigate the relationship between the design of a dimeric protein and the interactions present the subunit–subunit interface. Comparison is made with experiments such as those of Yip et al. (9) by calculating the forces necessary to pull away and push back the two subunits. We find that our model not only is able to capture key aspects of these experiments, but also provides information on the intricate relationship between the design of a dimeric protein and the interactions present the subunit–subunit interface.
Computational Section
Energetics.
¶We use a very simple protein model in which only the Cα atoms are considered (11) and a very simple form of the monomer–monomer interaction energy:
 |
1 |
where VA (VB) is the potential energy of NA (NB) interacting beads constituting chain A (B):
 |
2 |
and VAB is the potential energy given by the interaction of beads of chain A with beads of chain B:
 |
3 |
In Eq. 2, rijA = |riA − rjA| represents the distance between beads i and j of chain A whereas in Eq. 3, rijAB = |riA − rjB| is the distance between bead i of chain A and bead j of chain B. The parameters η(ai,aj) and σ entering these equations determine, respectively, the energy scale and the interaction range between monomer kinds ai and aj. Twenty different beads are used to represent the natural amino acids present in proteins. Interaction parameters between each amino acid pair i,j = 1, … , 20 are chosen to be all attractive [i.e., η(ai,aj) > 0 ∀(i,j)] and proportional to the values determined by Miyazawa and Jernigan (12, 13). The function f(x) in Eq. 2 represents the energy of the virtual Cα-Cα peptide bond, and it is equal to:
 |
4 |
with a and b taken to be 1 and 100 respectively, and d0 set equal to 3.8 Å. The effect of f(x) is to act as a “soft clamp” to keep subsequent residues at nearly the typical distance observed in real proteins.
Protein Model.
We construct a model of a dimeric protein with a given symmetry S by selecting a compact, low-energy configuration. To build the three-dimensional structure, we follow the procedure of ref. 11. A homopolymer is collapsed through molecular dynamics with a potential in Eq. 1, where all of the η’s are taken equal to their maximum (i.e., the most attractive) value, ηmax = 10, and σ is chosen to be equal to σ0 = 6.5 Å. In practice, we consider the motion of chain A only under the potential:
 |
5 |
where S(A) is the chain configuration obtained from of the application of the symmetry transformation S to the chain A. The potential VAS(A) depends only on the coordinates of chain A. In the case of a C2 symmetry, if (xi, yi, zi) i = 1, … , NA are the coordinates of beads of chain A, then (−xi, −yi, zi) i = 1, … , NA are the coordinates of those in chain S(A), and the expression of VAS(A) is:
 |
6 |
where r̃ij =  .
.
The target conformation of the dimer (“native state”) is obtained by collapsing a randomly generated swollen configuration of a chain made up of 50 monomers by using Molecular Dynamics (MD) simulations combined with a slow cooling procedure. The procedure is repeated several times from different random initial conditions (for details see ref. 11).
The procedure of ref. 11 is used to assign a suitable sequence to the selected structure. We used 20 kinds of amino acids ai i = 1, … , 20, with the values of the matrix elements η(ai, aj) i,j = 1, … , 20 as given in refs. 12 and 13. Following ref. 11, small variations in the Lennard-Jones length parameter are allowed. Here, six possible values (σ0 = 6.5, σ1 = 6, σ2 = 6.25, σ3 = 7.0, σ4 = 7.5, and σ5 = 8.0 Å) are permitted, both for the potential within a monomer VA (VB) and between the two monomers VAB. The compositions of both of the sequences (of chain A and B) shown in Table 1 are constrained to be equal to the average composition occurring in real proteins (14).‖ The designed sequences for two monomers are chosen to minimize the energy in the target dimer conformation and entailed an optimal assignment of amino acid type to each bead of each monomer and, independently, a choice of the σ parameter for each i − j pair with |i − j| > 1 within each chain and between the chains. The minimization in the sequence space is made by using a standard annealing procedure, starting from randomly assigned sequences and slowly cooling the system. To check the performance of the design procedure, the sequence resulting from the minimization is slowly cooled several (typically 100) times, starting from different, randomly generated, initial configurations. The design procedure is considered successful if the lowest energy state found during the simulations is within 1 Å of the target conformation.
Table 1.
Number of amino acids of each kind, occurring in A and B sequences (column 3), according to their occurrence in proteins (column 2)
| Residue type | Occurrence in proteins, % | Occurrence in our model, no. |
|---|---|---|
| CYS (type 1) | 1.7 | 1 |
| MET (type 2) | 2.4 | 2 |
| PHE (type 3) | 4.1 | 3 |
| ILE (type 4) | 5.8 | 3 |
| LEU (type 5) | 9.4 | 5 |
| VAL (type 6) | 6.6 | 4 |
| TRP (type 7) | 1.2 | 1 |
| TYR (type 8) | 3.2 | 2 |
| ALA (type 9) | 7.6 | 4 |
| GLY (type 10) | 6.8 | 4 |
| THR (type 11) | 5.7 | 3 |
| SER (type 12) | 7.1 | 3 |
| ASN (type 13) | 4.5 | 2 |
| GLN (type 14) | 4.0 | 1 |
| ASP (type 15) | 5.3 | 2 |
| GLU (type 16) | 6.3 | 3 |
| HIS (type 17) | 2.2 | 1 |
| ARG (type 18) | 5.1 | 2 |
| LYS (type 19) | 6.0 | 2 |
| PRO (type 20) | 5.0 | 2 |
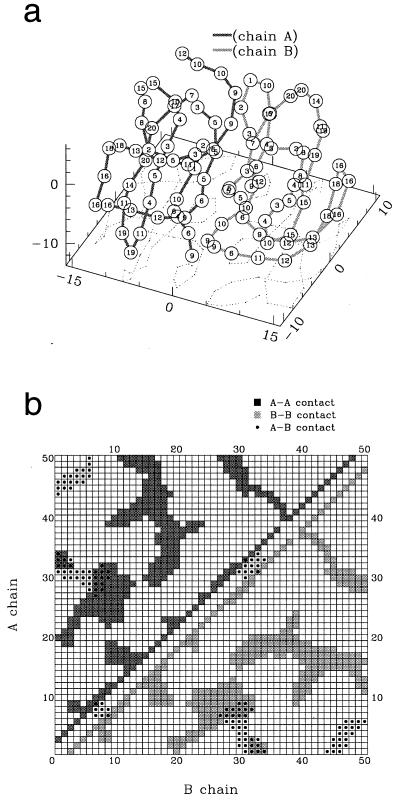
The three-dimensional structure and the intra- and interchain contacts as obtained from the design procedure are shown in Fig. 1. Forces as a function of the distance r between the two subunit centers of mass are calculated (i) by positioning the two monomers at the distance r and keeping the conformations they have in the native protein, without allowing them to move (“static force”); and (ii) by positioning the two monomers at the distance r and performing constrained Molecular Dynamics (CMD) simulations (15–17) to equilibrate the system with r as constraint coordinate.
Figure 1.
Native dimer. (a) Structure and numbering (indicated on each bead) of the type of the bead (as in column 1 of Table 1). (b) Inner (squares)- and inter (dots)-chain contacts. In both figures, the chains A and B are represented in light and dark color, respectively. In our model, the sequences A and B are chosen not to be necessarily equal to explore the relevance of the symmetry of the sequence for protein aggregation.
RESULTS
Energy Landscape and Folding.
Almost all dimeric globular proteins exhibit symmetric or pseudo-symmetric aggregation. Because of the amino acid chirality, only symmetry point groups not containing the inversion are possible. By far the most common point group symmetry is the C2. Examples range from HIV-1 protease to Cu, Zn superoxide dismutase, immuglobulin and glutathione reductase, and many others (1). We therefore impose a C2 symmetry to the native state of the model dimeric protein. The target structure (native state) is chosen as the lowest-energy conformer for the two subunits equipped with the designed sequences, A and B (see Computational Section).
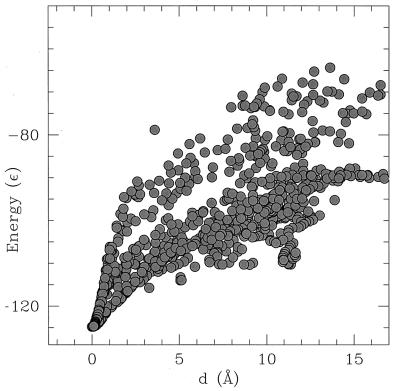
To explore the energy landscape of the dimeric protein, we first collected several configurations of the subunits during MD simulations. Fig. 2 shows the energy of each configuration of the two chains A and B plotted against the distance, d, from the dimer native state. The distance between two dimer configurations ri, r′i, i ∈ [1, … , NA + NB] is measured by using the Kabsch expression:
 |
7 |
where one structure is translated and rotated to get a minimal d (18, 19), and N = NA + NB.
Figure 2.
Energy of the model protein plotted as a function of the distance d between subunits.
The two subunits are able to find the lowest minimum in a reasonable time (e.g., in a time observable by a MD simulation—typical simulation runs are ≈10.000 τ, in a range of temperature around T = 0.1 ɛ) only if starting from a set of initial conditions allowing the two chains to “feel” each other. Obviously, if all beads of chain A are initially located too far—with respect to the Lennard-Jones interacting distances σ—from any bead of chain B, the two chains would evolve independently, and the dimer structure could not be reached. This fact does not imply a particular choice of the initial conditions. The only requirement for the correct folding toward the dimer native state is that the two chains have to be initially in a range of 2–3 σ one from each other. The two chains are initially set as randomly perturbed swollen configurations. To avoid the problem of entanglement between the two chains, the system is initially heated up to very high temperature (order of 1–10 ɛ) and then is slowly cooled (a rescaling of the velocities of a factor 0.98 is made every 5,000–10,000 MD steps) to a lower temperature. Eventually, the dimer is able to fold when a temperature around T = 0.1 ɛ is reached.
Subunit–Subunit Forces.
These interactions are experimentally measured by attaching part of the subunits to opposing surfaces and by measuring the resulting forces at several subunit–subunit distances as the two surfaces are slowly pulled away (9). The intermonomers force is experimentally found to quantitatively depend on the choice of the tethering points. However, the force curves obtained by different selection of these points qualitatively retain the some features. In the purpose of a qualitative study of the intermonomer separation process, the choice of the part of the monomer to be anchored is not crucial. To study the average effect over several different choices for the tethering points, we simulated the anchoring of the center of mass of each monomer. This is accomplished by carrying out CMD simulations in which the distance r between the centers of mass of the subunits is constrained. The subunit–subunit force is measured as the sum of the components along the intermonomers axes of the forces acting on each beads in a chain. For any given fixed distance between the two monomer centers of mass, the force is computed after a number of equilibration CMD steps, typically 2,000–5,000. In this equilibration time, the two chains are free to rearrange themselves to a suitable structure for a fixed intermonomers distance. This procedure is adopted to reproduce the finite time experimentally needed to measure the force. Variations of the equilibration time within the range of 2,000–5,000 CMD steps showed that the resulting force curve does not depend on this change (i.e., in this time, the rearrangement of the structure is already completed). The pulling process is accomplished starting from the dimer native structure and progressively increasing the intermonomers distance. The system is equilibrated at each distance, the force is measured, and then the separation between the two centers of mass is slightly increased. The step of distance variation used is typically within the interval 0.1–0.5 Å. In this range, the results do not depend on the choice of the step length.
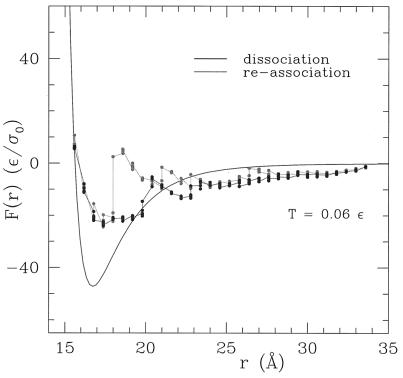
Fig. 3 plots the constrained force as a function of r at a fixed temperature (=0.06 ɛ) (see footnote on p. 9616). Both the force required to dissociate and reform the dimer are reported. Several interesting features emerge from this graph. First, both association and dissociation forces experience sudden jumps followed by a smooth behavior of the force (9, 27–31). Second, by pulling and pushing back the subunits, a hysteresis-like circle is formed. Both behaviors are observed also in experiments of protein dimers (9, 27–31). Consistently, a careful analysis of the contacts between the amino acids of the different subunits indicates that the number of contacts destroyed during dissociation at a given intermonomer distance r is not equal to those formed during the association. The static force curve obtained setting the native conformations of the two monomer at a fixed distance and not allowing them to equilibrate also is reported for comparison in Fig. 3. This is remarkably different from the previous one, stressing the role of protein relaxation in subunit–subunit interactions.
Figure 3.
Subunit dissociation (dark line) and reassociation forces (light line) as resulting from CMD simulations in which the two centers of mass of the two subunits are kept at fixed distance r. The forces are measured after equilibrium at temperature 0.06 ɛ has been reached. Multiple points, very close to each other, indicate repeated calculations and give an estimate of the error bar for the various measured forces. The static force, indicated by the black line, is the force between the monomers immediately after they are separated out at distance r from their native state. The force vs. r curve then is fitted with the function Ffit(r) = γ{(ρ/r)α1 − (ρ/r)α2} (best fit parameters γ = 20.8 ɛ, ρ = 2.4 σ0, α1 = 22.8, and α2 = 8.5, correlation coefficient among fitted and calculated values equal to 0.9998).
Protein Stability.
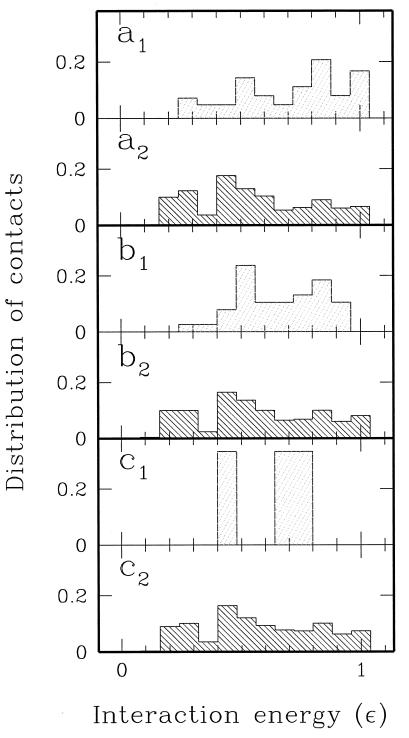
In this section, we compare the interactions at the subunit–subunit interface with those stabilizing the interior of the protein. Fig. 4 plots the distribution of the contacts as a function of their energy at several subunit–subunit distances. The contacts** occurring in the dimer structure, equilibrated at a constrained distance r between the two centers of mass, are counted and grouped in function of their strength. Fig. 4 shows that, in the native state, the design procedure naturally favors stronger forces across the monomer–monomer interfacial contacts relative to the intrachain ones. This is also in agreement with the suggestions coming from the experiments of Yip et al. (9). As r increases, the weakest intermonomer bonds are broken, and the strength distribution becomes more and more peaked around the strongest interaction. In contrast, the intrachain bond distribution remains almost unaltered as a result of the rupture of some contacts and formation of new ones.
Figure 4.
Distributions of inter- (light shadow) and intramonomeric interactions (dark shadow) normalized to the total number of contacts at r = 15.5 Å (native state) (a), r = 23.4 Å (b), and r = 30.6 Å (c). Notice that stronger interactions are favored at the subunit–subunit interface with respect to the intramonomer interactions.
Protein Deformation.
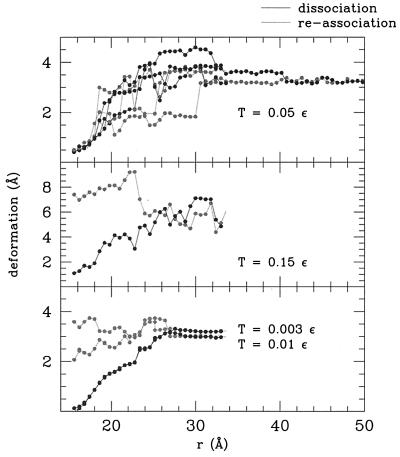
Our calculations allow us also to characterize the deformation of the monomers as the dimer is pulled. The deformation is measured as the distance of each monomer from the configuration it had in the native state, averaged over the two monomers.‡‡ This is accomplished by applying the Kabsch Eq. 7 to each single monomer instead of the whole dimer.
Fig. 5a shows the results of three simulations at temperature T = 0.05 ɛ when the dimer is slowly pulled and then slowly released. It is visible that the final states are always the same, but the pathways to reach them can be quite different. This is fully in agreement with the energy landscape theory and the protein folding funnel concept (20–26). This behavior persists also at higher temperatures, e.g., T = 0.10 ɛ. However, at higher temperature after the dimer is released, the native state in not more recovered, and another locally stable configuration is reached (T = 1.15 ɛ is shown in Fig. 5b). A similar situation occurs also at very low temperatures (Fig. 5c). After the dimer is pulled, the system is unable to reach again its native state when it is released. This indicates that the process of pulling and releasing is “reversible” only in a certain range of temperature. The temperature T has to be not too high (i.e., T has to be lower than a folding temperature Tf), or the system escapes from its local minimum, and not too low (i.e., T has to be higher than a glassy temperature Tg), or thermal fluctuations are not enough to allow the system to overcome the small scale roughness of the energy landscape (see, for instance, refs. 23–25). In this respect, it is worth noticing that the range of temperature in which the dimer is able to recover its native state in the pulling/releasing process coincides with the range of temperature reached at the end of the cooling process explained before—where the system is able to fold starting from random initial configurations.
Figure 5.
Monomer deformation (distance of a monomer from the corresponding native structure, averaged over the two monomers) as a function of the distance r at T = 0.05 ɛ (a), T = 0.15 ɛ (b), and T = 0.01 ɛ (c).
Monomers’ Refolding.
In our ideal dimer, the primary structures for A and B are very similar but not equal. This is done to study the refolding process independently on the two monomeric subunits. Starting from swollen configurations well separated, the two monomers refold as two independent chains. We collected several configurations during MD simulations of these independent monomers. The minimum energy conformations of the couple of noninteracting monomers turns out to be composed of very similar A and B monomeric structures (0.7 Å of rms difference) and to be not too different from the monomer structures constituting the dimer native state (≈2–3 Å each). The lowest energy conformations of the two noninteracting monomers are those reached at the final stage of the pulling process.
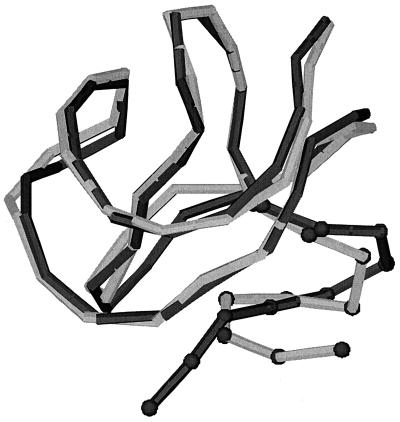
The similarity between the stable conformations of chains A and B folded separately could be predicted because their sequences are similar, although not identical. The similarity between the independently folded conformations and those in the native protein agrees with the experimental results (7). A conformational drift is experienced, as described before. Indeed, as Fig. 6 illustrates, the refolded minimum-energy structure differs from the native one only for a rearrangement of the interfacial region.
Figure 6.
Comparison between the optimized structures of one subunit folded as in the native protein dimer (darkline) and as independent monomer (lightline). Residues at the interface are indicated with circles.
Design Quality.
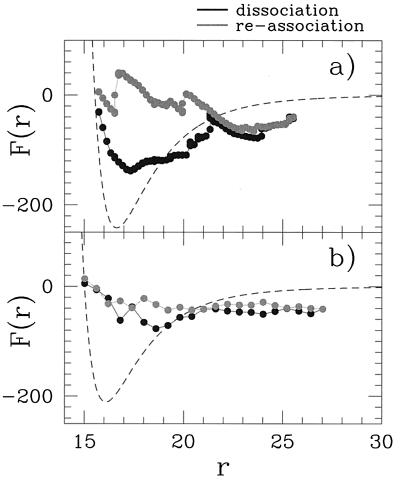
We also have addressed the question of how the width of the hysteresis cycle observed in Fig. 3 depends on the design quality of sequences A and B. To further simplify matters, we have restricted the number of amino acids classes to four, without loss of generality. The same structure of the dimer and the same design procedure (11) as above have been used. However, the design procedure was applied twice, one more and the other less accurate, providing two different pairs of sequences with the same native state and two different degrees of stability. The design quality is selected by choosing a different final “temperature” parameter in the annealing procedure for the design. For the highly optimized sequence, the Monte Carlo selection procedure is ended at a temperature close to zero whereas, for the nonoptimized sequence, it is ended at a temperature of order of ɛ. It leads to a different degree of roughness of energy landscape. Indeed, molecular dynamics simulations performed for the sequences show that the nonoptimal one could be easily trapped in one of the five competitive, alternative structures (local minima) with energy in a range 0.8–5 ɛ higher than the native structure energy whereas the “optimal” sequence exhibits three local minima in a range of 5–9 ɛ. These local minima are found as metastable conformations that, when slightly perturbed, “decay” to the global minimum conformation.
The association and dissociation forces for these two new cases are measured by using the same procedure as before. Results are shown in Fig. 7 and clearly indicate the strong correlation between the design quality and the width of the hysteresis loop.
Figure 7.
Dissociation and reassociation forces for two dimers with the same native state but different pairs of sequences: one obtained with an optimal design (a) and the other with a poor design quality (b). Hysteresis loop width correlates well with the degree of dimer stability.
DISCUSSION AND CONCLUSION
Our model of a dimeric protein, in spite of its extreme simplicity, is able to capture several specific features of the monomer–monomer interactions. Indeed, it reproduces the experimental “jump” behavior of the subunit–subunit force, which has been suggested to be a consequence of the disruption of a hierarchy of different kinds of intermolecular interactions (hydrogen bonds, electrostatic and dispersion forces, and salt bridges) at the monomer–monomer interface. Furthermore, it provides hysteresis-like cycles as observed in direct force experiments on dimeric proteins. Consistently, we find that the number of contacts between amino acids at the interface is different in the association and in the formation processes. Finally, our calculations indicate that the native state of a dimeric protein is recovered if the two subunits are pushed back, again in agreement with experimental evidence (9). The agreement with experiment is rather striking, considering that it is achieved by designing the dimeric protein with a extremely simple force field (a Lennard-Jones potential) mimicking the complex interactions among amino acids. This strongly suggests that the characteristic feature of intermonomer force curves can be simply a consequence of a design procedure optimizing the dimer structure with respect to a myriad of possible alternative structures rather than to specific subunit–subunit interactions. This “design-based stabilization” is presently at the speculative level, yet it offers an explanation for the stability of specific dimers. For instance, the two monomers of insulin can form, in principle, two possible adducts basically energetically equivalent in terms of contact strength (1). However, only one adduct is found in aqueous solution and in the crystal phase (ref. 2 and references therein).
Furthermore, this work also allows detailed theoretical characterization of the dynamics of association of a multimeric protein. First, it is shown that the design of the dimer is very highly optimized at the interface to stabilize the subunit–subunit interactions, in agreement with the experimental observation that the quaternary structure of proteins is disrupted only in drastic conditions or by mutating key residues at the interface (ref. 2 and references therein; ref. 7). Second, we learn that, at the first and most dramatic stages of the dissociation process, only the strongest interfacial interaction forces are maintained whereas the intramonomer interactions turn out to be almost unaltered. Consistently, we expect that the monomers do not rearrange significantly on dissociation, the only region experiencing large rearrangements being at the interface. This is absolutely consistent with the recent high resolution structure of the monomeric form of the dimeric enzyme Cu, Zn superoxide dismutase (7), which exhibits minimal differences with the native protein. The present results may be of help for protein-engineering experiment and for a deeper understanding of function/structure relationships of multimeric proteins.
Acknowledgments
We thank J. R. Banavar for many fruitful discussions and J. N. Onuchic for advice and suggestions. Support from Ministero dell’Universitá e della Ricerca Scientifica e Tecnologica–Cofin is gratefully acknowledged. During the last three months, C.C. has been supported by the National Science Foundation (Grant 96-03839) and by the La Jolla Interfaces in Science program (sponsored by the Burroughs Wellcome Fund).
ABBREVIATIONS
- MD
Molecular Dynamics
- CMD
constrained MD
Footnotes
This paper was submitted directly (Track II) to the Proceedings Office.
Reduced units are used; namely, all quantities are defined in terms of the monomer mass M (we set M = 1 for all monomer kinds), the bond length σ0 = 6.5 Å, and the energy parameter ɛ = ηMAX. The temperature of the system is valuated in MD simulations as the mean kinetic energy per degree of freedom (10) (setting the Boltzmann constant k = 1), and it is thus measured in units of ɛ whereas time is measured in units of τ = σ0 .
.
Amino acids average occurrence in >200 proteins from Klapper (14) has been improved by using 74,168 protein sequences by G. Settanni (personal communication).
A contact between two amino acids i and j is said to occur when their distance is less than (σi,j21/6) × 1.1. The distance (σi,j21/6) corresponds to the abscissa of the minimum of the Lennard–Jones potential for amino acids i and j, and the factor 1.1 is accounted for studies about the correspondence between Lennard–Jones potential and square-well potential, discussed elsewhere (C.C., M. Vendruscolo, A.M., and E. Domany, unpublished work).
The values of the deformations of the two monomers turn out to be rather similar.
References
- 1.Schultz G E, Schirmer R H. Principles of Protein Structure. New York: Springer; 1979. [Google Scholar]
- 2.Whittingham J L, Edwards D J, Antson A A, Clarkson J M, Dodson G G. Biochemistry. 1998;37:11516–11523. doi: 10.1021/bi980807s. [DOI] [PubMed] [Google Scholar]
- 3.Wlodawer A, Vondrasek J. Annu Rev Biophys Biomol Struct. 1998;27:249–284. doi: 10.1146/annurev.biophys.27.1.249. [DOI] [PubMed] [Google Scholar]
- 4.McKenzie H A. Adv Protein Chem. 1967;22:55–234. doi: 10.1016/s0065-3233(08)60041-8. [DOI] [PubMed] [Google Scholar]
- 5.Pocker Y, Biswas S B. Biochemistry. 1981;20:4354–4361. doi: 10.1021/bi00518a019. [DOI] [PubMed] [Google Scholar]
- 6.Koren R, Hammes G G. Biochemistry. 1976;15:1165–1171. doi: 10.1021/bi00650a032. [DOI] [PubMed] [Google Scholar]
- 7.Banci L, Benedetto M, Bertini I, Del Conte R, Piccioli M, Viezzoli M S. Biochemistry. 1998;37:11780–11791. doi: 10.1021/bi9803473. [DOI] [PubMed] [Google Scholar]
- 8.Mark A E, Berendsen H J C, van Gusteren W F. Biochemistry. 1991;30:10866–10872. doi: 10.1021/bi00109a009. [DOI] [PubMed] [Google Scholar]
- 9.Yip C M, Yip C C, Ward M D. Biochemistry. 1998;37:5439–5449. doi: 10.1021/bi9722756. [DOI] [PubMed] [Google Scholar]
- 10.Lebowitz J L, Percus J K, Verlet L. Phys Rev. 1967;153:250–254. [Google Scholar]
- 11.Clementi C, Maritan A, Banavar J R. Phys Rev Lett. 1998;81:3287–3290. [Google Scholar]
- 12.Miyazawa S, Jernigan R L. Macromolecules. 1985;18:534–552. [Google Scholar]
- 13.Miyazawa S, Jernigan R L. J Mol Biol. 1996;256:623–644. doi: 10.1006/jmbi.1996.0114. [DOI] [PubMed] [Google Scholar]
- 14.Klapper M H. Biochem Biophys Res Commun. 1977;78:1018–1024. doi: 10.1016/0006-291x(77)90523-x. [DOI] [PubMed] [Google Scholar]
- 15.Frenkel D, Smit B. Understanding Molecular Simulation. San Diego: Academic; 1996. [Google Scholar]
- 16.Andersen H C. J Comput Phys. 1983;52:24–34. [Google Scholar]
- 17.Ryckaert J P, Ciccotti G, Berendsen H J C. J Comput Phys. 1977;23:327–341. [Google Scholar]
- 18.Kabsch W. Acta Crystallogr A. 1976;32:922–923. [Google Scholar]
- 19.Kabsch W. Acta Crystallogr A. 1978;34:827–828. [Google Scholar]
- 20.Leopold P E, Montal M, Onuchic J N. Proc Natl Acad Sci USA. 1992;89:8721–8725. doi: 10.1073/pnas.89.18.8721. [DOI] [PMC free article] [PubMed] [Google Scholar]
- 21.Betancourt M R, Onuchic J N. J Chem Phys. 1995;103:773–787. [Google Scholar]
- 22.Bryngelson J D, Onuchic J N, Wolynes P G. Proteins Struct Funct Genet. 1995;21:167–195. doi: 10.1002/prot.340210302. [DOI] [PubMed] [Google Scholar]
- 23.Onuchic J N, Wolynes P G, Luthey-Schulten Z, Socci N D. Proc Natl Acad Sci USA. 1995;92:3626–3630. doi: 10.1073/pnas.92.8.3626. [DOI] [PMC free article] [PubMed] [Google Scholar]
- 24.Socci N D, Onuchic J N, Wolynes P G. J Chem Phys. 1996;104:5860–5868. [Google Scholar]
- 25.Onuchic J N, Luthey-Schulten Z, Wolynes P G. Annu Rev Phys Chem. 1997;48:545–600. doi: 10.1146/annurev.physchem.48.1.545. [DOI] [PubMed] [Google Scholar]
- 26.Nymeyer H, Garcia A E, Onuchic J N. Proc Natl Acad Sci USA. 1998;95:5921–5928. doi: 10.1073/pnas.95.11.5921. [DOI] [PMC free article] [PubMed] [Google Scholar]
- 27.Hinterdorfer P, Baumgartner W, Gruber H J, Schilcher K, Schindler H. Proc Natl Acad Sci USA. 1996;93:3477–3481. doi: 10.1073/pnas.93.8.3477. [DOI] [PMC free article] [PubMed] [Google Scholar]
- 28.Allen S, Chen X, Davies J, Davies M C, Dawkes A C, Edwards J C, Roberts C J, Sefton J, Tendler S J B, Willimans P M. Biochemistry. 1997;36:7457–7463. doi: 10.1021/bi962531z. [DOI] [PubMed] [Google Scholar]
- 29.Florin E L, Moy V T, Gaub H E. Science. 1994;264:415–417. doi: 10.1126/science.8153628. [DOI] [PubMed] [Google Scholar]
- 30.Moy V T, Florin E L, Gaub H E. Science. 1994;266:257–259. doi: 10.1126/science.7939660. [DOI] [PubMed] [Google Scholar]
- 31.Lee G U, Chrisey L A, Colton R J. Science. 1994;266:771–773. doi: 10.1126/science.7973628. [DOI] [PubMed] [Google Scholar]


