

Abstract
The present study reports the first comprehensive map of brain networks underlying latent inhibition learning and the first application of structural equation modeling to cytochrome oxidase data. In latent inhibition, repeated exposure to a stimulus results in a latent form of learning that inhibits subsequent associations with that stimulus. As neuronal energy demand to form learned associations changes, so does the induction of the respiratory enzyme cytochrome oxidase. Therefore, cytochrome oxidase can be used as an endpoint metabolic marker of the effects of experience on regional brain metabolic capacity. Quantitative cytochrome oxidase histochemistry was used to map brain regions in mice trained on a tone-footshock fear conditioning paradigm with either tone preexposure (latent inhibition), conditioning only (acquisition), conditioning followed by tone alone (extinction), or no handling or conditioning (naïve). The ventral cochlear nucleus, medial geniculate, CA1 hippocampus, and perirhinal cortex showed modified metabolic capacity due to latent inhibition. Structural equation modeling was used to determine the causal influences in an anatomical network of these regions and others thought to mediate latent inhibition, including the accumbens and entorhinal cortex. An uncoupling of ascending influences between auditory regions was observed in latent inhibition. There was also a reduced influence on the accumbens from the perirhinal cortex in both latent inhibition and extinction. The results suggest a specific network with a neural mechanism of latent inhibition that appears to involve sensory gating, as evidenced by modifications in metabolic capacity and effective connectivity between auditory regions and reduced perirhinal cortex influence on the accumbens.
Keywords: latent inhibition, metabolic mapping, structural equation modeling, cytochrome oxidase, sensory gating, perirhinal cortex, learning and memory
In latent inhibition (LI), preexposure to a stimulus inhibits subsequent associations with that stimulus (Lubow and Moore, 1959). LI has been demonstrated in several behavioral paradigms in a variety of species, including humans, and is disrupted in schizophrenics (Lubow, 1989). Lesion and pharmacological studies have explored the neural mechanisms underlying LI and have identified several key brain regions. Conditioned drink suppression and eye blink conditioning studies demonstrated that lesions to the entorhinal cortex disrupt LI (Coutureau et al., 1999; Shohamy et al., 2000; Coutureau et al., 2002). Other studies using a conditioned drink suppression paradigm showed that lesions to the nucleus accumbens shell disrupt LI while lesions to the core or entire nucleus accumbens facilitate the effect (Gal et al., 2005).
These studies have isolated the entorhinal cortex and nucleus accumbens as key regions involved with LI; however, a single region does not act independently from the rest of the brain. Neural functions that mediate inhibitory learning are likely dependent on interactions within and between systems (McIntosh and Gonzalez-Lima, 1995). Interactions between anatomically related regions create a neural context that is specific to a particular behavioral outcome (McIntosh, 1999, 2004). The present study investigates the interactions between anatomically and functionally related regions that mediate LI in a tone-footshock conditioning paradigm using quantitative cytochrome oxidase (CO) histochemistry (Gonzalez-Lima and Cada, 1998).
CO as an endogenous marker of neuronal activity was first described by Wong-Riley (1989). CO is a mitochondrial enzyme that can be used as an endogenous marker of local brain metabolic capacity because of its rate-limiting role in cellular respiration. CO catalyzes the transfer of electrons from cytochrome c to oxygen, which is the terminal reaction coupled to ATP synthesis in oxidative phosphorylation. Thus CO constitutes the site of oxidative phosphorylation where the capacity for energy production is conserved for subsequent ATP synthesis.
Gonzalez-Lima and Garrosa (1991) described the first quantitative histochemical method for mapping CO activity in the brain. CO activity is well-suited to quantify the endpoint modification of neuronal metabolic capacity because CO reaches a more stabilized state of oxidative metabolism than measures that reflect on-line responses to a stimulus, such as fluorodeoxyglucose (FDG) uptake (Sakata et al., 2005). The endpoint modification in the metabolic capacity of a neuron (CO data) is different from the time-varying metabolic activity of a neuron (e.g. FDG data). CO maps endpoint “potential” energy or metabolic capacity measured as levels of enzymatic induction vs. FDG that maps transient “kinetic” energy or metabolic consumption measured as levels of glucose analog uptake. Therefore, quantitative CO histochemistry is suitable to map the spatial location of neurons with different endpoints of CO enzymatic induction produced by different forms of learning, as shown in this and previous studies.
Gonzalez-Lima (1992) introduced the use of quantitative CO histochemistry for the study of learning functions. The objective of using CO histochemistry for learning studies is different from that of studies with other techniques such as FDG, blood flow or fMRI. For mapping learning functions the objective of a CO study is to visualize a long-lasting modification in brain metabolic capacity produced by a learning paradigm. Increases or decreases in CO activity revealed by quantitative histochemistry reflect underlying changes in the endogenous long-term metabolic capacity of the brain. Therefore, the objective of CO experiments is not to evaluate acute changes in functional activity over a period of seconds or minutes in response to a stimulus as in the case of FDG, blood flow or fMRI. The CO method is best suited for visualizing chronic modifications over hours or days linked to the history of oxidative energy demands on brain regions involved in the training. A PubMed search of learning and memory studies using CO measures revealed over 75 studies, many of which have been reviewed recently by us and others (Sakata et al., 2005; Hu et al., 2006; Conejo et al., 2007). In particular, CO has been used successfully to detect subtle differences in regional brain metabolic capacity in behavioral learning tasks such as Pavlovian conditioning of tones and shocks (Poremba et al., 1997, 1998; Conejo et al., 2005).
Brain circuits related to learning have been often investigated by measuring the activity of specific neural regions. Schmajuk et al. (1996); (2001) and Schmajuk (2005) previously described a conceptual neural network model of LI using a set of differential equations that represent changes in neural activity and connections over time. A complementary approach is to investigate the interactions between brain regions. This approach is based on the finding that brain regions that are functionally coupled show coordinated changes in metabolic capacity, which is manifested in the strength of the correlation of CO activity between regions (Sakata et al., 2000). Differences in mean CO activity reflect differences in the metabolic capacity of particular brain areas, whereas differences in correlations in CO activity between regions reflect differences in functional coupling among brain areas (Sakata et al. 2000). Consequently, CO can be used to determine functional pathways modified as a consequence of learning.
Changes in metabolic capacity can be used to build a network model that describes relationships between regions and how they are modified across different behavioral training paradigms. For example, with CO data from a region A that directly influences region B via an anatomical path, if these regions show a large, positive correlation in CO activities after training, it may be interpreted that an increase in CO activity in region A lead to a corresponding increase in region B. To test such interpretation requires modeling the causal influences between regions in a network, such as with path analysis (McIntosh and Gonzalez-Lima, 1991). Wright (1934) first developed the path analysis method to study the functional relationships between stable variables such as genetic traits manifested as phenotypic features like inherited skin color. Therefore, path analysis is a method better suited to analyze stable relationships, like it would be the case of CO endpoints after chronic training.
The path analysis approach, also known as structural equation modeling (SEM) was first applied to brain mapping by McIntosh and Gonzalez-Lima (1991) in a study of auditory system FDG uptake following long-term habituation. SEM has since been used to analyze neural network interactions in other mapping studies using FDG, blood flow and fMRI data (e.g., McIntosh and Gonzalez-Lima, 1992, 1993, 1994, 1995; Buchel and Friston, 1997; Bruchey et al., 2007). Another leading approach to analyze causal influences in brain networks is dynamic causal modeling (Penny et al. 2004; Mechelli et al. 2004). However, this approach requires temporal sampling of activational responses in the brain. Using CO activity data, the SEM approach is better suited for analysis of stable network interactions because CO histochemistry maps the cumulative endpoint of neuronal enzymatic induction after prolonged training (Gonzalez-Lima and Cada, 1998).
In SEM of CO data, the functional interrelationships between anatomically connected brain regions are given a numeric weight, or path coefficient, derived through a process of iterative data-fitting. Specifically, these path coefficients represent the proportion of CO activity in one area determined by the CO activity of other areas that project to that region. These paths quantify the influences between regions and how they are modified across different behavioral training paradigms. The present study describes a network model based on CO metabolic data and the first application of SEM to CO data.
We hypothesized that changes in metabolic capacity associated with LI would be found in the nucleus accumbens and entorhinal cortex in addition to auditory and hippocampal regions that showed extinction effects in a previous study (Barrett et al., 2003). A comparison of neural mechanisms between LI and Pavlovian extinction was also of interest since both produce a similar behavioral outcome with stimulus alone presentations. We found changes in regional brain metabolic capacity specific to LI and a unique network pattern of effective connectivity that differed from acquisition and extinction.
MATERIALS AND METHODS
Subjects consisted of 48 male CBA/J mice, 5 weeks of age when delivered from the supplier (Jackson Laboratory, Bar Harbor, ME). Six subjects were used in a pilot study to determine training parameters that would produce an attenuated conditioned response (CR) with repeated preexposure to the conditioned stimulus (CS). The parameters chosen for the pilot were based on a design from a previous study of Pavlovian extinction (Barrett et al., 2003). Three of the piloted preexposed subjects were included in the subsequent CO study.
Subjects were divided into four groups: latent inhibition (n = 12), extinction (n =11), acquisition (n = 11), and naïve (n = 11). Subjects were housed under standard laboratory conditions, four to a cage, with a 12 hr light/dark cycle and ad libitum access to food and water. All subjects, except the naïve control group, were handled every day for 7 d before the start of training. All animal experimentation was approved by the University of Texas Institutional Animal Care and Use Committee and complied with all applicable federal and NIH guidelines.
Apparatus
Acquisition training occurred in an excitatory context (context A), which consisted of a 22 × 14 × 22 cm conditioning chamber (MED Associates, St. Albans, VT) enclosed in a sound-attenuated box illuminated with red light. Two sides of the chamber were aluminum, with clear Plexiglas for the front, back, and top. Tones were generated by two Wavetek Sweep / Modulation generators (Wavetek, San Diego, CA). The acoustic CS was a frequency-modulated tone of 1-2 kHz, two sweeps per second, 15 sec in duration, with an intensity of 65 dB measured at the center of the chamber floor. The unconditioned stimulus (US) was a 0.5 mA foot shock, 0.75 sec in duration delivered through metal bars 0.6 cm apart that formed the floor of the chamber and were wired to a Lafayette Instruments Master Shocker (Lafayatte Instrument Co., Lafayette, IN). Stimuli presentation was controlled by computer programs created using the MED-PC for Windows programming language (MED Associates). Between sessions the operant chambers were washed with soap.
Tone preexposure, extinction, and CS probe trials occurred in a separate neutral context (context B), which consisted of a 19 × 25 × 15 cm clear plastic cage placed in a testing room illuminated with red light. A lid with a mounted speaker was placed on top of each plastic cage. The attached speakers were wired to the same tone generators used for Context A, which delivered the same tone CS used during acquisition training. Between sessions, each box was washed and swabbed with an iodine solution to provide a distinctive olfactory environment.
Behavioral Training
Conditioned behavior
The CR measured was freezing behavior, operationally defined as the mouse having all four feet on the floor, with minimal head movements and shallow, rapid breathing for at least 3 sec. Each 15 sec tone was divided into five 3 sec bins and the subject’s behavior was scored for each of those bins during two CS probe sessions. Behavior was also recorded for the 15 sec before the onset of tone, to provide a comparison of activity with and without the CS. Behavior was scored by the same trained observer, who was blind to the subject’s group assignment.
Experimental design
Subjects were randomly assigned to one of four training conditions: latent inhibition, acquisition, extinction, or naïve control (Table 1). The first three groups underwent tone-shock pairings, but the latent inhibition group received tone-alone presentations prior to paired trials and the extinction group received tone-alone sessions after acquisition training. The naïve control group was left unhandled for the duration of the training. This experimental design permitted distinguishing between (1) the effects of CS preexposure (latent inhibition group vs acquisition and naïve groups), (2) the effects of order of CS alone presentations (latent inhibition group vs extinction group), and (3) the effects of training (latent inhibition, acquisition, and extinction groups, vs naïve group) on brain metabolic capacity.
Table 1. Experimental Design.
| Groups | Phase I | Probe I | Phase II | Probe II |
|---|---|---|---|---|
| Latent Inhibition (tone alone before acquisition) | T | No CR | T → S | No CR |
| Acquisition (no tone alone before or after training) | T → S | CR | No T | CR |
| Extinction (tone alone after acquisition) | T → S | CR | T | No CR |
| Naïve control (no training or handling) | – | – | – | – |
T = 1–2 kHz tone sweep (15 sec); S = 0.5 mA foot shock (0.75 sec); → = coterminating tone and shock; CR = freezing behavior scored during 15 sec tone.
Phase I
Training consisted of an hour habituation period to context A. After the initial habituation period, the latent inhibition group received three days of tone preexposure in context B, while the acquisition and extinction groups received two days of training in context A. Tone preexposure for the LI group consisted of 90 tone alone presentations, 15 sec in duration and 40 sec apart, over the course of one hour, resulting in a total tone alone exposure time of 67.5 min. Tone-alone exposure for the LI and extinction groups were equated based on the total amount of tone exposure. Acquisition training consisted of four 15-sec tone presentations with a 0.75 sec coterminating foot shock. Intertrial intervals during acquisition training ranged from 2, 2.5, 3, 3.5, to 4 min and were pseudorandomly assigned by the MED-PC program.
Phase II
At the start of the second phase of training, each subject was placed in context B for 15 min and given four presentations of the CS. Behavior was scored as described above. After this initial probe session (probe I), subjects in the LI group were placed in context A where they underwent two days of acquisition training as described above. Subjects in the extinction and acquisition groups were placed in context B for two 1 hr sessions. During the hour session, the extinction group received 60 presentations of the CS, 15 seconds in duration with 45 sec between each presentation. An additional session increased the total tone alone exposure time to 67.5 min as in the LI group. The acquisition group was exposed to context B, but received no stimulus presentation during the 1 hr extinction sessions.
Final probe and tissue collection
The last day of training consisted of a second probe session (probe II) identical to the session described above. The extinction and acquisition groups received injections of fluorodeoxyglucose (FDG) for a separate study of tone-evoked brain activity (see Barrett et al., 2003). All subjects were quickly decapitated with a guillotine. Brains were removed and frozen in −40°C isopentane for ~ 5 min. Sections of each brain were cut at 40 µm at −20°C on a Reichert-Jung 2800 Frigocut E cryostat. Two series of adjacent sections were picked up on slides and stored at −40°C. One series was processed using cytochrome oxidase histochemistry. The second series of brain sections for the extinction and acquisition groups was processed for FDG autoradiography as reported in Barrett et al. (2003).
Cytochrome oxidase histochemistry
Sections were processed for quantitative cytochrome oxidase histochemistry using previously described procedures (Gonzalez-Lima and Garrosa, 1991; Gonzalez-Lima and Cada, 1994). In brief, slides were treated for five min in a phosphate buffer (0.1 M, pH 7.6) containing 10% w/v sucrose and 0.5% v/v glutaraldehyde to facilitate tissue adherence to slides. Three changes at five min each of phosphate buffer (0.1 M, pH 7.6) containing 10% w/v sucrose followed in order to remove blood cells. Slides were then placed for 10 min in a Tris buffer (0.05 M, 7.6 pH) containing 275 mg/L of cobalt chloride, 10% w/v sucrose, and 0.5% v/v dimethylsulfoxide for metal intensification to enhance staining contrast. Afterwards, slides were placed for five min in phosphate buffer rinse (0.1 M, pH 7.6), then incubated for 1 hr at 37°C in 700 mL of oxygen saturated reactive solution containing 350 mg of diaminobenzedine tetrahydrocholoride, 52.5 mg of cytochrome c, 35 gm of sucrose, 14 mg of catalase, and 1.75 ml of dimethylsulfoxide in phosphate buffer. A 10% sucrose phosphate buffer with 4% v/v formalin was used to stop the reaction and fix the tissue by immersing the slides for 30 min. Finally, slides were dehydrated with ethanol, cleaned with xylene, and coverslipped with Permount.
Anatomically matched sections from all groups were stained in the same batch to remove the possibility of interbatch variability as a possible confound between groups. Sets of homogenized brain tissue standards were also included in each batch of slides. These standards were used to quantify enzymatic activity and control for staining variability across different batches of cytochrome oxidase staining. For details on standard preparation and quantification see Gonzalez-Lima and Cada (1994).
Image analysis
Optical density for the cytochrome oxidase-stained tissue was analyzed using an image processing system consisting of a CCD camera, DC powered light box, image capture board (Targa), and Java image analysis software (version 1.4, Jandel Scientific, San Rafael, CA). The system was calibrated using an optical density step tablet, and the images were corrected for optical distortions using a subtraction of background illumination. Optical density was sampled across three adjacent sections from both hemispheres, averaged, and converted to enzymatic activity units (µmol/min/g tissue wet weight) using spectrophotometric measurements taken from the brain tissue standards.
Statistical analyses
Behavior
Behavioral differences between groups were evaluated on the basis of probe trial data. Freezing scores ranging from 0 to 5 were averaged across four tone-alone presentations during each probe session and converted from a raw count to a percentage. Behavioral data were analyzed for group differences with SPSS 11.5 software using a one-way analysis of variance (ANOVA). The significance level was set at p < 0.05. Evidence of latent inhibition was evaluated by comparing behavior in the latent inhibition group to behavior in the acquisition and extinction groups during the second probe.
Regional mean CO activity
A measure of global brain CO activity was obtained by averaging intensity readings of from all the brain sections used in each subject. This global measure of CO activity was used as a reference for group differences in overall metabolic capacity, as well as for normalization of the CO activity data of each region of interest (ROI) for each subject (i.e., ROI/brain) to minimize inter-subject staining differences unrelated to treatment group effects. Normalization ratios were multiplied by the average mean CO activity of the naïve group to convert the units into those of enzymatic activity (µmol/min/g wet tissue). Regional CO activity was averaged across subjects for each group to obtain mean ± standard error of mean.
Analysis of variance (ANOVA) was used to examine between-group differences in freezing behavior and regional brain CO activity. Since many regions of interest were examined, Hochberg’s Bonferroni corrected post-hoc tests were used with a statistical significance level set at p < 0.05. This approach reduced the risk of inflated Type I error associated with multiple tests while not discarding true differences.
Measures of CO activity were not obtained for some regions due to poor tissue quality or sections missing the appropriate anatomical level for a particular ROI. Thus some regional comparisons consisted of a smaller n. In the case of the infralimbic cortex, tissue quality was extremely poor for that particular bregma level and consequently the ROI was dropped from the analysis.
Interregional correlations
Functional relationships between regions that showed a mean difference between groups, as revealed by ANOVA, were analyzed using Pearson product-moment correlations. To ensure the reliability of correlations, a jackknife procedure was performed in which each individual subject was dropped from a group, and then correlations were calculated again without that subject’s data. This procedure was iterated until each subject had been sequentially dropped and the analysis repeated. To minimize Type I error, correlations that remained significantly different from zero at p < 0.01 through all iterations were considered statistically reliable for further analysis. These correlations were then tested for significant differences between groups. The Fisher Z transformation was used to convert each correlation to a Z score. A test statistic of the form
(where Zij is the Fisher Z transformation value for the correlation coefficient between regions i and j, ng1 is the sample size in group one, and ng2 is the sample size in group two) was then used to compare group differences. This approach has been used previously to test differences in regional correlations between groups (Jones and Gonzalez-Lima, 2001a, b).
Brain-behavior correlations
Correlations between brain CO activity and behavioral measurements of freezing during probe trials were also computed using the regions that revealed changes in metabolic capacity in addition to the nucleus accumbens and entorhinal cortex. Freezing scores from probe I and probe II were averaged together for each group. This probe average provided an index of behavioral change across the three groups with LI having the lowest average, acquisition having the highest average, and extinction having an intermediate average probe freezing score. Positive brain-behavior correlations reflect a linear relationship between increased regional CO activity and strength of the CR, while a negative correlation reflects a linear relationship between decreased regional CO activity and strength of the CR. The jackknife procedure described above was also used to ensure the reliability of the correlations.
Structural equation modeling
SEM was first applied to the network analysis of neuroscience data of any kind by McIntosh and Gonzalez Lima (1991), using FDG uptake data. SEM was then applied to PET cerebral blood flow data (McIntosh and Gonzalez Lima, 1994). In SEM, covariances are decomposed (“effects decomposition”) in order to identify causal influences between variables. Anatomic connections between brain regions are given a numeric weight, or path coefficient, derived through a process of iterative data-fitting, which describes the causal influences between these regions. In the present application of SEM, path coefficients represent the proportion of CO activity in one area determined by the CO activity of other areas that project to that region. These path coefficients can be compared between conditions to investigate changes in functional influences across experimental groups.
Regions included in the proposed model were selected based on the means analysis, correlational analysis, and previous literature. Specifically, regions showing changes in metabolic capacity due to LI were used to construct the model in addition to the nucleus accumbens and entorhinal cortex. Connections between regions were strongly based on known anatomical connectivity based on previous literature and functional relationships revealed through the correlational analysis. The proposed model is represented in Figure 1.
Figure 1.
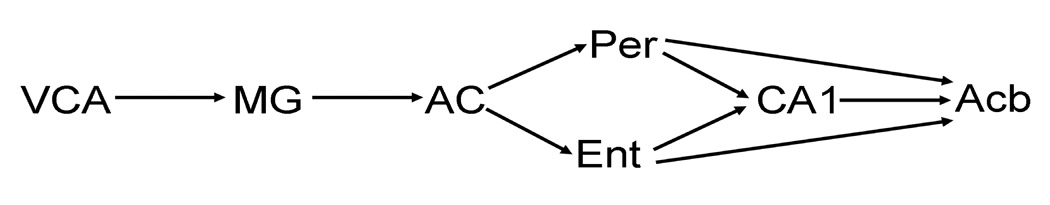
Proposed network model of latent inhibition. Regions are represented by abbreviations. Anatomical connections are represented by arrows. Anterior ventral cochlear nucleus = VCA; medial geniculate = MG; auditory cortex = AC; perirhinal cortex = Per; entorhinal cortex = Ent; anterior hippocampus CA1 = CA1; nucleus accumbens = Acb.
A separate set of pairwise correlations were computed between the selected regions, which consisted of the anterior ventral cochlear nucleus (VCA), medial geniculate (MG; MGD and MGV combined), auditory cortex (AC; TE1 and TE3 combined), perirhinal cortex (Per), entorhinal cortex (Ent), CA1, and nucleus accumbens (Acb; shell and core combined) for each group. For simplicity of the model, some regions were combined due to a high degree of collinearity. High collinearity is problematic in SEM resulting in a model that is unsolvable. Interregional correlations were used to determine path coefficients for a latent inhibition, acquisition, and extinction model.
Path coefficients were computed using LISREL (version 8.54, Scientific Software). The model begins with starting values using LISREL non-iterative least-squares estimation of the unknown parameters (path coefficients and residuals). Iterations are then used to compute the implied covariances and verify these values with the original covariances. Optimizations in the model parameters are made until we reproduce the optimal parameters that reliably minimize the deviation of the implied covariances from the original covariances. An expected cross-validation index, which is a measure of the discrepancy between the fitted covariance matrix in the analyzed sample and the expected covariance matrix that would be obtained in another sample of the same size, was computed using LISREL to provide an estimate of the model’s reproducibility.
Omnibus comparisons between groups were performed using a stacked model approach. In this approach, path coefficients in one model are constrained to be equal between conditions (null model) and compared to another model where the coefficients are allowed to vary (alternative model). A X² goodness-of-fit statistic was computed for each model based on its ability to reproduce the original correlation matrix and then summed along with degrees of freedom for all three groups. The summed X² for the alternative model was then subtracted from the summed X² for the null model. This X² difference can be assessed using the difference between the null degrees of freedom and the alternative model degrees of freedom. This approach resembles a simple t test for group mean differences in that the null hypothesis predicts no group mean differences (McIntosh and Gonzalez-Lima, 1995). For the present study, the null hypothesis was that path coefficients between groups do not differ.
The model was also described in terms of direct effects, total effects and residuals. The decomposition of such effects can be informative in that it provides an indication of a brain region or pathway’s total influence and whether this influence is modified at any stage in the system. Direct effects are represented by path coefficients and quantify the causal influence of a given structure on another. Total effects represent the impact of a region on all other regions and are the algebraic sum of direct and indirect effects. Residual values are the combined influences of areas outside the model and the influence of the brain region upon itself.
RESULTS
Behavioral results
The average freezing percentages during both tone-alone probe trials for the latent inhibition, acquisition, and extinction groups are shown in Figure 2. The acquisition and extinction groups both showed a high percentage of freezing after acquisition training (~80%) in the first probe session. After acquisition training the latent inhibition group only froze 24% of the time. This percentage of freezing in the latent inhibition group was significantly lower compared to the acquisition group’s probe II data (F(1, 21) = 163.81; p < 0.01). The observed effect between the preexposed latent inhibition group and the non-preexposed acquisition group constitutes the traditional comparison used to demonstrate the latent inhibition effect.
Figure 2.
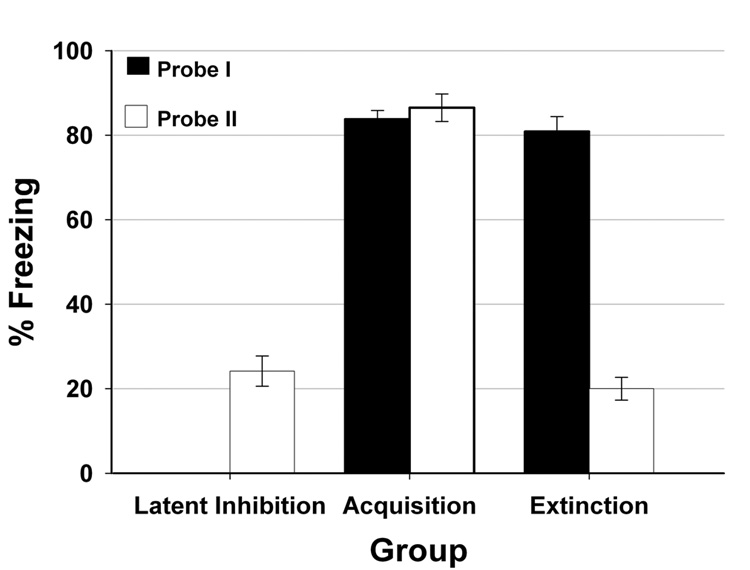
Average freezing behavior. Data average across four tone CS presentations during probe session I and probe session II are shown for the three training groups. Black bars represent freezing percentages during probe I; White bars represent freezing percentages during probe II. There was on freezing observed in the latent inhibition group during probe I.
The attenuated freezing response in the latent inhibition group was also comparable to the CR in the extinction group. There was no significant difference in freezing behavior between the latent inhibition and extinction groups during the phase II probe. The extinction group, however, did show a significant decrease in freezing behavior compared to its phase I probe (F(1, 10) = 596.40; p < 0.01) and compared to the acquisition group during the phase II probe (F(1, 20) = 247.86; p < 0.01). These findings demonstrate that extinction training was effective at extinguishing the tone-evoked freezing behavior.
Finally, there was no significant freezing behavior during the tone-off periods preceding each stimulus presentation (pre-CS). The mean pre-CS freezing percentage for each of the three trained groups was low and ranged from 0–6%. The lack of freezing behavior during the pre-CS interval confirms that contextual excitatory effects were not transferred from context A to B and that the observed CR was evoked by the tone.
Mean brain CO activity results
Of the 46 total regions of interest measured, 14 showed significant overall effects (ANOVA, p < 0.05) and significant pair-wise differences after the Hochberg Bonferroni correction for group comparisons (p < 0.05). The naïve control group was treated as a baseline comparison for the other experimental groups. Changes in metabolic capacity between groups in relation to the naïve control revealed four classes of effects: (1) latent inhibition effects; (2) acquisition effects; (3) extinction effects; and (4) effects common to trained groups. A summary of these effects are shown in Table 2 and analyzed ROIs are illustrated in Figure 3. In Table 2 the difference between “LI group greater than acquisition” versus “acquisition lower than LI” (and other similar group comparisons) is indicated relative to the naïve control. For example, in the perirhinal cortex “LI group greater than acquisition” is the correct interpretation rather than “acquisition lower than LI” because the mean in LI group (334 ± 15) is greater than acquisition (250 ± 30) whereas the acquisition group’s mean is not different from the naive group (266 ± 16). Therefore, relative to the naïve, the effect was an increase in the LI group instead of a decrease in the acquisition group.
Table 2. Significant group effects in mean cytochrome oxidase activity values ± standard error of mean (µmol/min/g tissue wet weight).
| Latent Inhibition | Acquisition | Extinction | Naive | |
|---|---|---|---|---|
| 1. Latent inhibition (LI) effects | ||||
| LI group greater than acquisition | ||||
| Perirhinal cortex(PER) | 334 ± 15 | 250 ± 30 | 306 ± 23 | 266 ± 16 |
| LI greater than acquisition and naïve | ||||
| Anterior hippocampus CA1 (rCA1)* | 322 ± 15 | 253 ± 24 | 292 ± 18 | 234 ± 14 |
| LI group greater than extinction | ||||
| Ventral cochlear nucleus, anterior (VCA) | 447 ± 15 | 401 ± 18 | 357 ± 26 | 407 ± 19 |
| LI lower than naïve | ||||
| Medial geniculate nucleus, dorsal (MGD) | 288 ± 11 | 303 ± 15 | 328 ± 7 | 336 ± 12 |
| Medial geniculate nucleus, ventral (MGV) | 294 ± 11 | 314 ± 13 | 337 ± 10 | 343 ± 11 |
| 2. Acquisition effects | ||||
| Acquisition lower than LI and naïve | ||||
| Caudate putamen, caudal* (CPc) | 325 ± 12 | 235 ± 24 | 308 ± 26 | 321 ± 17 |
| Acquisition lower than LI and extinction | ||||
| Anterior hippocampus CA3 (rCA3) | 336 ± 12 | 245 ± 22 | 333 ± 28 | 302 ± 17 |
| 3. Extinction effects | ||||
| Extinction greater than LI | ||||
| Medial septum (MS) | 272 ± 6 | 309 ± 16 | 329 ± 17 | 292 ± 16 |
| Extinction greater than acquisition | ||||
| Auditory cortex, dorsal (TE1) | 292 ± 9 | 270 ± 10 | 329 ± 12 | 297 ± 19 |
| Extinction greater than naïve | ||||
| Auditory cortex, ventral* (TE3) | 267 ± 7 | 268 ± 11 | 296 ± 10 | 245 ± 13 |
| Insular cortex* (INS) | 294 ± 8 | 309 ± 15 | 329 ± 15 | 268 ± 9 |
| 4. Effects common to trained groups | ||||
| LI and extinction lower than naïve | ||||
| Cerebellar vermis (CBV) | 337 ± 15 | 354 ± 12 | 348 ± 21 | 417 ± 19 |
| All groups lower than naïve | ||||
| Spinal trigeminal nucleus* (ST) | 322 ± 15 | 342 ± 15 | 324 ± 22 | 415 ± 18 |
| External cuneate* (ECu) | 280 ± 15 | 272 ± 12 | 281 ± 17 | 418 ± 20 |
The indicated group differences are significant at p < 0.05 after Hochberg’s modified Bonferroni correction for multiple comparisons
significant at p < 0.01
Figure 3.
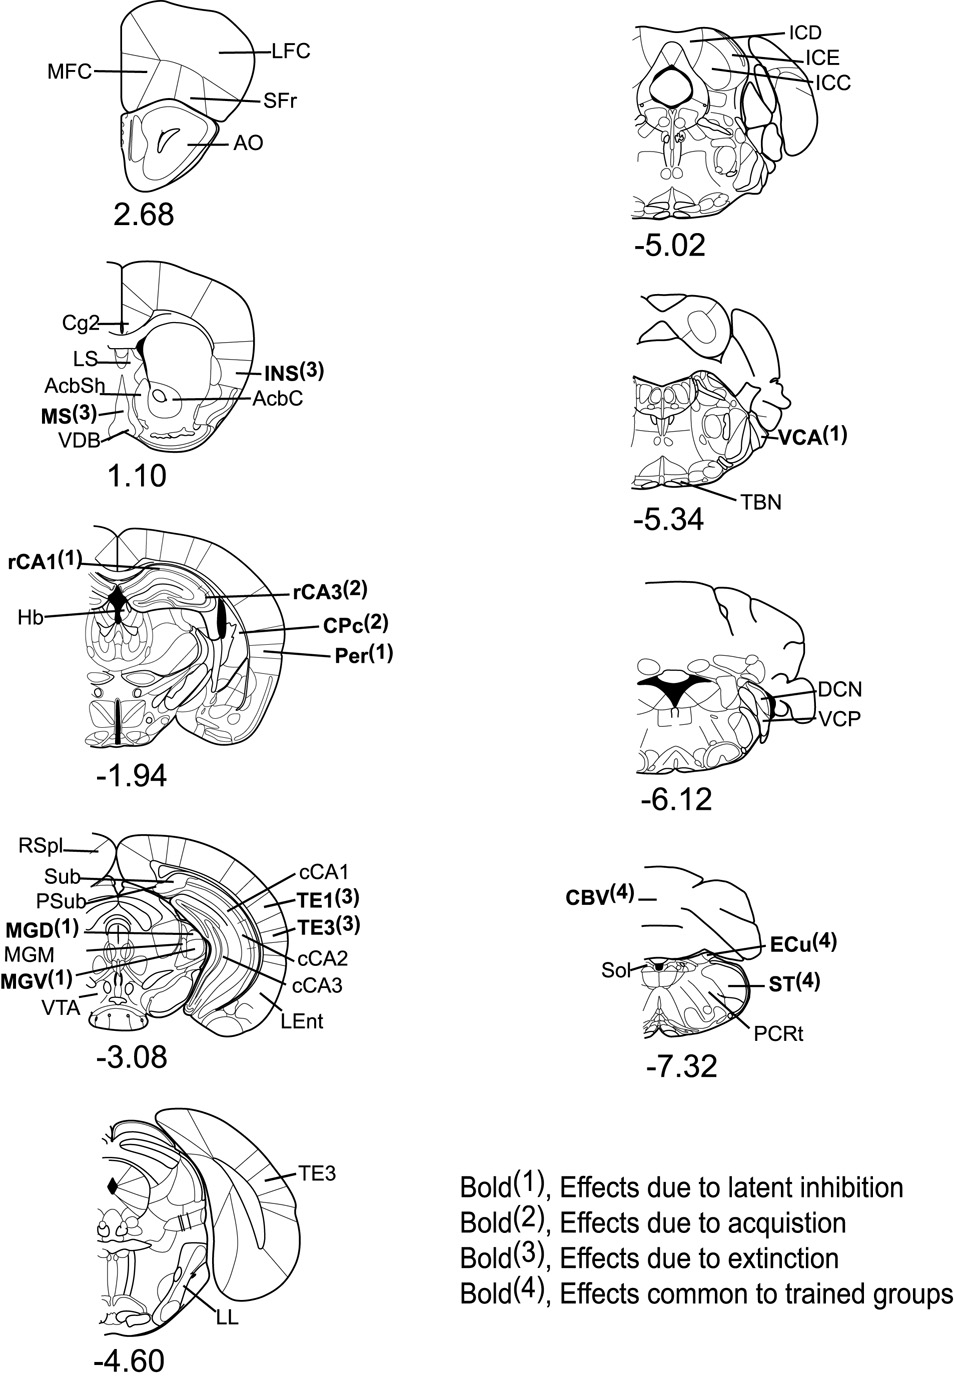
Coronal brain diagrams depicting regions of interest by Bregma level. The significant mean CO activity differences (p < 0.05) observed in each region are indicated in bold face. Anterior-posterior bregma coordinates are indicated below each diagram. MFC = medial frontal cortex, LFC = lateral frontal cortex, SFr = sulcal frontal cortex, AO = anterior olfactory nucleus, Cg2 = anterior cingulate, LS = lateral septum, MS = medial septum, INS = insular cortex, VDB = vertical diagonal band nucleus, AcbSh = accumbens shell, AcbC = accumbens core, rCA1 = anterior hippocampus CA1, rCA3 = anterior hippocampus CA3, Hb = lateral habenula, CPc = caudal caudate putamen, Per = perirhinal cortex, CeA = central amygdala, BLA = basolateral amygdala, MeA = medial amygdala, RSpl = retrosplenial cortex, Sub = subiculum, Psub = presubiculum, MGD = medial geniculate nucleus dorsal, MGM = medial geniculate nucleus medial, MGV = medial geniculate nucleus ventral, VTA = ventral tegmental area, cCA1 = posterior hippocampus CA1, cCA2 = posterior hippocampus CA2, cCA3 = posterior hippocampus CA3, TE1 = auditory cortex dorsal, TE3 = auditory cortex ventral, Ent = entorhinal cortex, TE2 = secondary auditory cortex, LL = lateral lemniscus, ICD = inferior colliculus nucleus dorsal, ICE = inferior colliculus nucleus external, ICC = inferior colliculus nucleus central, VCA = ventral cochlear nucleus anterior, TBN = trapezoid body nucleus, DCN = dorsal cochlear nucleus, VCP = ventral cochlear nucleus posterior, CBV = cerebellum vermis, ECu = external cuneate nucleus, ST = spinal trigeminal nucleus, Sol = Solitary tract, PCRt = parvocellular reticular nucleus. [Section diagrams were reproduced with permission from (Paxinos and Franklin, 2001)].
Latent inhibition effects
The most prominent changes in CO activity for the latent inhibition group were found in hippocampal and auditory regions. The one way ANOVA revealed that CO activity in the perirhinal cortex (F(3,36) = 3.57; p< 0.05), CA1 hippocampus (F(3,36) = 5.39; p < 0.01), dorsal medial geniculate (F(3,31) = 3.72; p < 0.05), ventral medial geniculate (F(3,31) = 4.17; p < 0.05), and the anterior ventral cochlear nucleus (F(3,39) = 3.38; p < 0.05) differed significantly between groups. The post-hoc analysis further revealed that the perirhinal and CA1 metabolic CO activity in the latent inhibition group was significantly greater (27–34%) than CO activity in the acquisition group. CA1 also showed a 38% increase in metabolic CO activity in the latent inhibition group relative to the naïve group.
The dorsal medial geniculate and ventral medial geniculate showed a significant decrease in CO activity (17%) in the LI group as compared to the naïve control group while the ventral cochlear nucleus showed a 25% increase in CO activity relative to the extinction group. No significant differences in mean metabolic capacity were found between groups for the nucleus accumbens shell, nucleus accumbens core, and the entorhinal cortex, which were proposed to play a role in latent inhibition based on lesion and pharmacological studies.
Acquisition effects
Hippocampal and striatal CO activity in the acquisition group was lower relative to the other groups. Metabolic capacity in CA3 and caudal caudate putamen differed significantly between groups (F(3,36) = 4.92; p < 0.01 and F(3,36) = 4.60; p < 0.01 respectively). Specifically, CO activity in the caudate putamen was about 37% lower in the acquisition group when compared to the latent inhibition and naïve groups. CO activity in CA3 was also 35–37% lower in the acquisition group relative to the latent inhibition and extinction groups.
Extinction effects
Significant differences between groups for the medial septum (F(3,38) = 3.04; p < 0.05), dorsal auditory cortex (F(3,41) = 3.46; p < 0.05), ventral auditory cortex (F(3,41) = 3.80; p < 0.05), and insular cortex (F(3,38) = 4.27; p < 0.05) showed effects due to extinction. The medial septum showed greater CO activity (21%) in the extinction group when compared to the latent inhibition group. Greater CO activity in TE1 and TE3 was also observed in the extinction group relative to the acquisition and naïve groups respectively (20–21%). The insular cortex showed a significant increase in CO activity compared to the naïve group (22%). There were no significant decreases in CO activity relative to the other groups.
Effects common to trained groups
Significant effects common to the three trained groups relative to the naïve control group were found mostly in brainstem somatosensory regions. The cerebellar vermis (F(3,40) = 4.48; p < 0.01), spinal trigeminal nucleus (F(3,40) = 5.78; p < 0.01), and external cuneate (F(3,40) = 18.18; p < 0.01) were found to be statistically different between groups. CO activity in the cerebellar vermis was significantly lower in the latent inhibition and extinction groups relative to the naïve control (24–30%). The spinal trigeminal nucleus and external cuneate showed CO activity that was significantly lower in all training groups compared to the naïve group (21–29% and 48–53% respectively).
Interregional within-group correlations
There were 11 interregional correlation coefficients (r) that were greater than zero at p < 0.01 in the LI group. Correlational analysis revealed the rostral hippocampus CA1 field (rCA1) was positively correlated with the rostral hippocampus CA3 field (rCA3; r = 0.86) and the caudate putamen (CPc; r = 0.84). CO activity in rCA3 was positively correlated with the perirhinal cortex (Per; r = 0.91). This functional connectivity between hippocampal and parahippocampal regions was not significant in the extinction group. The dorsal medial geniculate (MGD) was also correlated with the ventral medial geniculate (MGV) in the LI group (r = 0.94). This correlation was not significant in the extinction group.
There were also strong positive correlations among cerebellar regions including the cerebellar vermis (CBV), external cuneate (ECu), and the spinal trigeminal nucleus (ST) in the LI group (r = 0.89 – 0.93). These correlations changed across groups with a positive correlation between CBV and the dorsal medial geniculate (MGD) in the acquisition group (r = 0.89) and a negative correlation between ST and dorsal auditory cortex (TE1) in the extinction group (r = −0.83). Significant correlations between cerebellar and brain stem regions were absent in the naïve group.
The nucleus accumbens shell (Acbs) and core (Acbc) were positively correlated across groups (r = 0.94 – 0.96); however there was a significant correlation with the insular cortex (INS) between both Acbs (r = 0.91) and Acbc (r = 0.89) in the acquisition group and a positive correlation between Acbs and the medial septum (MS) in the naïve group (r = 0.85). The entorhinal cortex (Ent) was positively correlated with TE1 in the LI group (r = 0.87).
Several correlations showed a significant difference between groups using the Fisher-Z transformation at p < 0.01 including MGV-MGD, ST-TE1, Per-MGD, Per-Ent, MGV-CBV, and Acbs-MS correlations. The MGV-MGD correlation was 0.94 in the LI group, which was significantly different from the extinction group (r = 0.07). The ST-Te1 correlation was −0.83 in the extinction group, which differed significantly from LI (r = 0.48) and acquisition (r = 0.58). Per-MGD and Per-Ent correlations differed significantly between LI (r = −0.08 and 0.21 respectively) and the naïve group (r = 0.85 and 0.94 respectively). Per-Ent also differed significantly between acquisition (r = −0.55) and the naïve group (r = 0.94). The MGV-CBV correlation was significantly different between acquisition (r = 0.88) and extinction (r = 0.01). Finally with the Acbs-MS correlation, both acquisition (r = 0.91) and the naïve group (r = 0.85) differed significantly from extinction (r = −0.47).
Brain-behavior correlations
After the jackknife procedure the only region showing a significant correlation with conditioned behavior was the nucleus accumbens shell (r = .698, p<0.05) in the latent inhibition group. An increase in CO activity in the nucleus accumbens shell is positively correlated with a reduction in the CR due to tone preexposure. The other groups did not show reliably significant correlations between ROIs and conditioned behavior.
Structural equation modeling
Bivariate correlations were used to compute path coefficients between regions in the proposed network model. These correlations include ROIs that were combined for simplicity to compute causal influences between regions using SEM. Chi-square analysis revealed that a model where all paths were free to vary was significantly different from a model with fixed paths (X² diff(18) = 72.35, p <0.01). This indicates that the patterns of interactions among ROIs were statistically different between the LI, acquisition, and extinction groups. Differences in path coefficients between the three models are represented in Figure 4. Direct effects, total effects, and residual influences are listed in table 3, table 4 and table 5 and are described below.
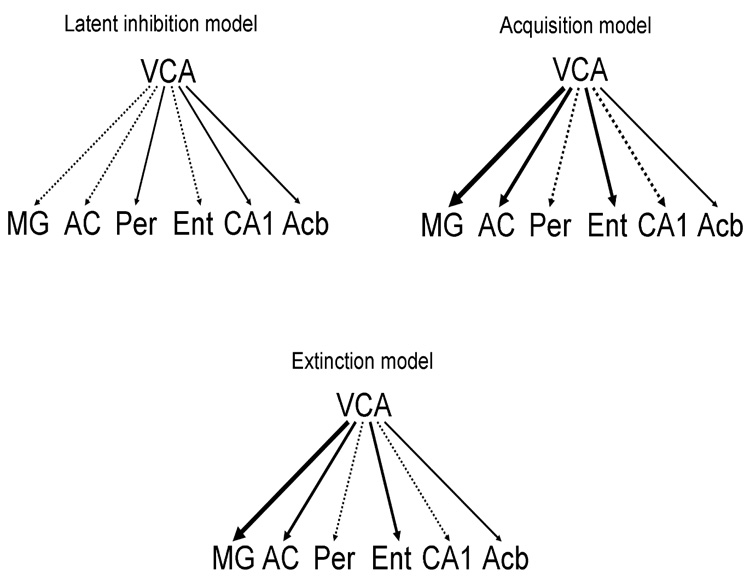
Figure 4.
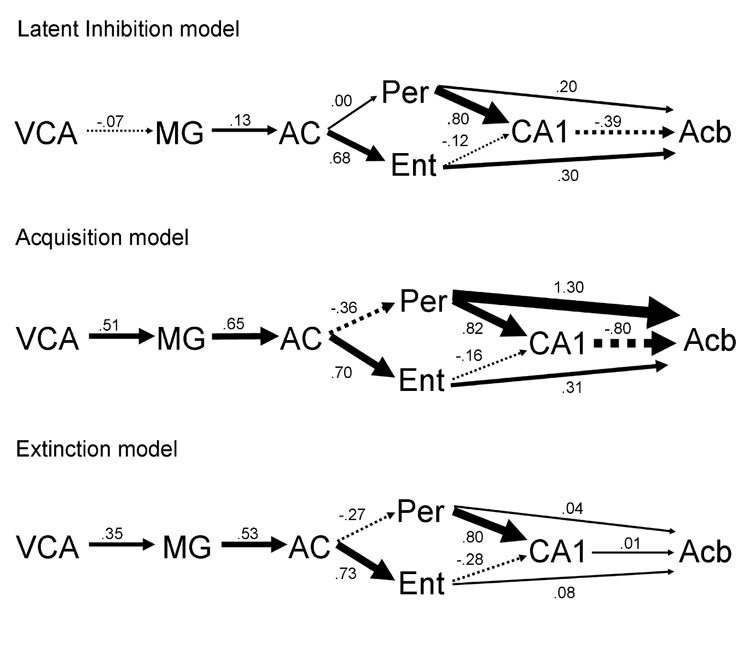
Graphic representation of the direct effects for the a) latent inhibition model, b) acquisition model, and c) extinction model. Magnitude of the direct effect is proportional to arrow width for each path. Positive path coefficients are shown as solid arrows, whereas negative coefficients are shown as segmented arrows. Path coefficients are indicated next to each arrow. Abbreviations are defined in Figure 1.
Table 3. Total effects, direct effects and residuals (PSI values) for the functional neural network model of latent inhibition.
Total effects are the algebraic sum of the direct and indirect effects. Direct effects represent the influence of one brain region on another with the impact of other regions left constant. Residual influences include the combined influences outside the model and the influences of the brain region upon itself. The columns list origins of the effect and the rows list structures being affected. Values given are the coefficients for total, direct, and residual effects. Effects that cannot occur given the direct anatomical connections are left blank. Abbreviations are defined in Figure 1.
| ROIs | VCA | MG | AC | Per | Ent | rCA1 | Acb |
|---|---|---|---|---|---|---|---|
| A. Total Effects | |||||||
| VCA | |||||||
| MG | −0.07 | ||||||
| AC | −0.01 | 0.13 | |||||
| Per | 0.00 | 0.00 | 0.00 | ||||
| Ent | −0.01 | 0.09 | 0.68 | ||||
| rCA1 | 0.00 | −0.01 | −0.08 | 0.80 | −0.12 | ||
| Acb | 0.00 | 0.03 | 0.23 | −0.11 | 0.35 | −0.39 | |
| B. Direct Effects | |||||||
| VCA | |||||||
| MG | −0.07 | ||||||
| AC | 0.13 | ||||||
| Per | 0.00 | ||||||
| Ent | 0.68 | ||||||
| rCA1 | 0.80 | −0.12 | |||||
| Acb | 0.20 | 0.30 | −0.39 | ||||
| C. PSI (residuals) | |||||||
| 1.00 | 1.00 | 0.98 | 1.00 | 0.54 | 0.35 | 0.82 | |
Table 4. Total effects, direct effects, and residuals (PSI values) for the functional neural network model of acquisition.
Total effects are the algebraic sum of the direct and indirect effects. Direct effects represent the influence of one brain region on another with the impact of other regions left constant. Residual influences include the combined influences outside the model and the influences of the brain region upon itself. The columns list origins of the effect and the rows list structures being affected. Values given are the coefficients for total, direct, and residual effects. Effects that cannot occur given the direct anatomical connections are left blank. Abbreviations are defined in Figure 1.
| ROIs | VCA | MG | AC | Per | Ent | rCA1 | Acb |
|---|---|---|---|---|---|---|---|
| A. Total Effects | |||||||
| VCA | |||||||
| MG | 0.51 | ||||||
| AC | 0.33 | 0.65 | |||||
| Per | −0.12 | −0.23 | −0.36 | ||||
| Ent | 0.23 | 0.46 | 0.70 | ||||
| rCA1 | −0.13 | −0.26 | −0.41 | 0.82 | −0.16 | ||
| Acb | 0.03 | 0.05 | 0.08 | 0.64 | 0.44 | −0.80 | |
| B. Direct Effects | |||||||
| VCA | |||||||
| MG | 0.51 | ||||||
| AC | 0.65 | ||||||
| Per | −0.36 | ||||||
| Ent | 0.70 | ||||||
| rCA1 | 0.82 | −0.16 | |||||
| Acb | 1.30 | 0.31 | −0.80 | ||||
| C. PSI (residuals) | |||||||
| 1.00 | 0.65 | 0.57 | 0.87 | 0.51 | 0.23 | 0.39 | |
Table 5. Total effects, direct effects, and residuals (PSI values) for the functional neural network model of extinction.
Total effects are the algebraic sum of the direct and indirect effects. Direct effects represent the influence of one brain region on another with the impact of other regions left constant. Residual influences include the combined influences outside the model and the influences of the brain region upon itself. The columns list origins of the effect and the rows list structures being affected. Values given are the coefficients for total, direct, and residual effects. Effects that cannot occur given the direct anatomical connections are left blank. Abbreviations are defined in Figure 1.
| ROIs | VCA | MG | AC | PER | ENT | CA1 | NucAcc |
|---|---|---|---|---|---|---|---|
| A. Total Effects | |||||||
| VCA | |||||||
| MG | 0.35 | ||||||
| AC | 0.18 | 0.53 | |||||
| Per | −0.05 | −0.14 | −0.27 | ||||
| Ent | 0.13 | 0.39 | 0.73 | ||||
| rCA1 | −0.08 | −0.22 | −0.42 | 0.80 | −0.28 | ||
| Acb | 0.01 | 0.02 | 0.04 | 0.05 | 0.08 | 0.01 | |
| B. Direct Effects | |||||||
| VCA | |||||||
| MG | 0.35 | ||||||
| AC | 0.53 | ||||||
| Per | −0.27 | ||||||
| Ent | 0.73 | ||||||
| rCA1 | 0.80 | −0.28 | |||||
| Acb | 0.04 | 0.08 | 0.01 | ||||
| C. PSI (residuals) | |||||||
| 1.00 | 0.88 | 0.72 | 0.93 | 0.47 | 0.20 | 0.99 | |
Direct effects
The direct influences from the auditory regions in the latent inhibition model were weak suggesting reduced influences between regions early in the model. The VCA’s influence on the MG was negative and weak with a path coefficient of −0.07 in the LI model. This path coefficient was positive in the acquisition and extinction groups with path coefficients of 0.51 and 0.35 respectively. The influence on AC from the MG was also weak in the latent inhibition condition with a path coefficient of 0.13. The path weights in the acquisition and extinction conditions were stronger with respective coefficients of 0.65 and 0.53.
The reduced coupling observed between regions involved with auditory processing was also reflected in projections to hippocampal regions. Influence on Per from the AC in the LI model was weak with a path coefficient near zero. In the acquisition and extinction models, these paths were weakly negative with coefficients of −0.36 and −0.27 respectively. These findings suggest sensory gating of the tone CS by the auditory system in the LI group condition that is not present in the acquisition and extinction conditions.
Another interesting finding was the presence of a strong influence on the Acb from the Per with a path coefficient of 1.30 in the acquisition model. The path coefficients were weaker in the latent inhibition and extinction models (0.20 and 0.04 respectively). This indicates a reduced influence of the perirhinal cortex on the nucleus accumbens relative to the tone excitor.
Differences between specific pathways in the model were also tested by fixing beta values with path coefficients obtained from the model where all paths were free to vary. When values were fixed for VCA-MG at −0.7 and at 0.13 for the MG-AC pathway, the model was significantly different from the null (X² diff(16) = 72.4, p <0.01). The same was true when AC-Per was fixed at 0.00 and the Per-Acb pathway was fixed at 0.20 (X² diff(16) = 72.4, p <0.01). This suggests that these specific paths in the LI model are significantly different from the same paths in the acquisition and extinction models.
Total effects
Total effects computed for the influence of the ventral cochlear nucleus on all regions are represented in Figure 5. In general, the VCA’s total influences in the latent inhibition model are all weak and near zero. The VCA’s influences in the acquisition and extinction models are stronger with influences on the MG the strongest (0.51 and 0.35, respectively). The VCA’s influence on the nucleus accumbens remains weak across groups.
Figure 5.
Graphic representation of the total effects for the VCA in the a) latent inhibition, b) acquisition, and c) extinction model. Positive total effects are shown as solid arrows, whereas negative ones are shown as segmented arrows. Magnitude of the total effect is proportional to arrow width. The VCA has a relatively small influence across all regions in the latent inhibition model. The VCA’s influence on other regions in the acquisition and extinction model are stronger, especially on the MG and AC. Abbreviations are defined in Figure 1.
Residual influences
CA1 residuals were small for the three training groups indicating that more of the variance in CA1 was accounted for by the selected pathways. In the acquisition group Acb also had a relatively small residual value (0.39). The residual values for Acb in the latent inhibition and extinction groups were above 0.80.
Expected Cross Validation Index (ECVI)
The ECVI for the model was 4.51, which falls between the 90% confidence interval (3.72–5.55) as reported by LISREL. The ECVI is a measure of the discrepancy between the fitted covariance matrix in the analyzed sample and the expected covariance matrix that would be obtained in another sample of the same size. Based on the obtained ECVI and 90% confidence interval we conclude the model represents a reasonably close approximation of the population.
DISCUSSION
The findings provided the first comprehensive map of networks underlying LI and suggested that sensory gating may be a plausible LI mechanism, as evidenced by alterations in metabolic capacity and functional connectivity between auditory regions and a reduced perirhinal cortex influence on the accumbens. At the cellular level, CO data characterize the induction of the CO enzyme inside mitochondria. This enzymatic induction is the metabolic endpoint measure of a neuron’s capacity to meet its energy demand throughout training. Other regions associated with fear conditioning, such as the amygdala, did not show CO effects. Since CO maps sustained modifications in energy demand, one possible interpretation is that such regions may have a time-limited involvement; e.g., they may be activated initially but then return to baseline. This is in agreement with another recent CO study in rats that found that several days of tone-footshock conditioning modified the metabolic capacity of septo-hippocampal regions, but not the amygdala (Conejo et al., 2005). The role of the amygdala in LI is inconsistent, with lesions to the basolateral amygdala disrupting LI in appetitive conditioning in one study (Coutureau et al., 2001) and lesions producing abnormally persistent LI in another (Schiller and Weiner, 2005). In the present study, the amygdala did not show any CO differences or significant correlations and consequently was not included in the LI model.
LI is a form of inhibitory learning comparable in behavior to extinction. The inhibitory learning effects associated with LI and extinction suggest the two paradigms may share neural mechanisms. The present results suggest that LI and extinction do not differ much in terms of regional CO metabolic activity, but do differ in terms of functional connectivity. Interacting brain regions create a functional network or neural context that is specific to a particular behavioral outcome. Certain regions within a functional network may show similar changes in metabolic capacity but have different interactions with other regions across several behavioral responses. Such regions serve as behavioral catalysts that enable a transition between behavioral states (McIntosh, 2004). The important role neural contexts and behavioral catalysts play in learning paradigms, such as LI, and how they differ across other behavioral outcomes is highlighted through SEM.
One cannot attribute the variability in C.O. activity in a given region to any one thing in the behavioral paradigm, rather one should view this as an overall change in C.O. due to a particular combination of tones and shocks given over the course of several days. One can, however, account for the variability in C.O. in a given region in terms of direct (main effects) or moderating (interaction) effects of other regions. One could say then that the overall combination of tones and shocks, reflecting either LI, acquisition, or extinction learning, alters these main effects and interactions thus providing support for network interactions between brain regions. However, whether an influence is really a sustained, consistent, direct influence through a direct anatomical connection, or a consistent influence via a moderating region, could never really be ascertained given the long temporal window and the fact that brain regions may change in their causal associations over the course of the training period.
The proposed SEM model, as with all models, represents a simplified description of the underlying neural networks. Anatomical connections between regions are based on known pathways, such as the connections to the Acb from Ent, Per, and CA1 (Newman and Winans, 1980). However, every known pathway for a specific network cannot be included in a single model since this increases the number of unknown variables, which ultimately makes the model unsolvable. Though anatomically correct, the current model is incomplete. For example, Per has a connection from Ent (Kohler, 1988) that is not included in our model. Additionally, bidirectional connections were also excluded from the model such as projections from AC to MG (Roger and Arnault, 1989; Arnault and Roger, 1990). When constructing a model for SEM, one is required to compromise between anatomical accuracy, solvability, and interpretability. The reliability/reproducibility of the model is also challenged given the small sample size. With a small n, estimates could potentially change if one or more subjects were added or removed; however the ECVI, which provides a measure of reproducibility, provides support the model is a close representation of the population.
Nonetheless, the results from CO histochemistry and SEM suggest that sensory gating may be a plausible explanation for the LI effect, which is indicated by the decreased metabolic capacity and functional connectivity between auditory regions. In particular, the formation of auditory fear memories requires the synthesis of mRNA and protein in the MG (Parsons et al., 2006), suggesting that below baseline MG metabolism in LI may reflect a reduced processing of the tone stimulus. Sensory gating regulates the processing of meaningful and irrelevant stimuli. Weiner (2003) describes LI as an expression deficit resulting from contradicting stimulus-no consequence and stimulus-reinforcement events. Preexposure in LI decreases the signal value of the tone through a stimulus-no event association, which competes for behavioral expression when the preexposed stimulus subsequently predicts a meaningful event. In our proposed LI model, sensory gating of irrelevant stimuli may be an explanation for the observed decreases in the influence of VCA on MG and the influence of MG on AC. The weak functional interactions between auditory regions reflect a decrease in the tone’s excitatory properties that may result from the stimulus-no event association. Sensory gating in the auditory regions could create a neural context that mediates the attenuated CR in LI.
The proposed sensory gating in the present study may also provide insight to the disruption of LI observed in individuals with schizophrenia. Feldon and Weiner (1992) previously discussed the potential of the LI paradigm as an animal model of schizophrenia since symptoms associated with the disorder reflect the inability to ignore irrelevant stimuli. Individuals with schizophrenia show disruptions in the LI effect and learn the stimulus-event association despite familiarity with the conditioned stimulus (Lubow, 1989; Kilts, 2002; Lubow and Kaplan, 2005).
Deficits in sensory information gating have also been demonstrated in patients with schizophrenia (Braff, 1993). Siegel et al. (1984) reported abnormal sensory gating in schizophrenics and their relatives who showed deficits in inhibition of P50 auditory evoked responses. The deficit in inhibition of P50 auditory evoked responses has since been reported in medicated and untreated schizophrenics (Clementz et al., 1998; Light et al., 2000; Adler et al., 2004). Such deficits in information processing may account for disrupted tasks, such as LI. Impaired LI observed in schizophrenics has provided a useful model of schizophrenia at the behavioral, anatomical, and genetic level. For example, our recent study of the genetic basis of schizophrenia showed that mice with mutations in neuregulin-I, a candidate susceptibility gene for schizophrenia, have deficits in the behavioral expression of LI (Rimer et al., 2005).
According to the switching model of LI (Weiner, 1990; Weiner and Feldon, 1997; Weiner, 2003) the nucleus accumbens appears to modulate the LI effect. Based on our results, a plausible explanation is that this modulation may be dependent on sensory gating from CS preexposure. Regions involved in auditory sensory processing send information through the parahippocampal and hippocampal regions to the nucleus accumbens. If the accumbens is acting as a dynamic modulator of contradicting information, it is possible that variation in metabolic capacity is better reflected on an individual subject’s basis rather than on the cumulative group mean in metabolic capacity. Consistent with this interpretation is the finding that a subject’s metabolic capacity in the nucleus accumbens shell was the only brain regional effect that showed a significant reliable positive correlation with behavioral freezing expression of LI in individual subjects.
The parahippocampal regions are important in relaying information from sensory areas to the cortex. Although changes in mean metabolic capacity in the entorhinal cortex were not observed, our model does emphasize the importance of interactions with this region in LI. Since the entorhinal cortex, perirhinal cortex, and hippocampus are functionally and anatomically related, lesions to any one region would disrupt the LI effect. The important role of hippocampal and parahippocampal regions in LI is also evident through differences in metabolic capacity.
The hippocampus and perirhinal cortex showed increases in metabolic capacity in the LI group. Increased perirhinal and hippocampal metabolic capacity in the LI group may reflect a dissociation of converging auditory and somatosensory input. This hypermetabolism may in turn affect system level interactions between hippocampal and cortical regions during learning. Such metabolic differences in the hippocampal regions support the idea that the functional relevance of a brain area depends on the status of other connected areas as illustrated in our model by a shift in effective connectivity between CA1, Ent, Per and Acb.
The present findings are also consistent with previous metabolic mapping studies of inhibitory learning. For example, an SEM study of long-term and short-term habituation to an acoustic stimulus found that influence from the ventral cochlear nucleus on the auditory cortex and medial geniculate was small in a group receiving long-term presentations of a stimulus when compared to a group receiving short-term presentations (McIntosh et al., 1991). This effect is similar to what was found in the present study and may reflect the decrease in signal value of a non-meaningful stimulus. Our study on the blocking effect (Jones and Gonzalez-Lima, 2001b) revealed excitatory effects in the accumbens and CS-US contiguity effects in rCA1, Per, and AC. The present study continues to emphasize the importance of hippocampal and parahippocampal regions in converging auditory (CS) and somatosensory (US) information. Another study on differential inhibition (Jones and Gonzalez-Lima, 2001a) showed decreased activity in the ventral cochlear nucleus in the differential inhibition group, which reflects changes in the learned signal value of the tone. Similarly in LI, the learned signal value of the tone decreases as the tone becomes an irrelevant stimulus that does not provide any new information about the environment.
Our proposed neural model stresses the importance of looking at a behavioral phenomenon in terms of a system of neural interactions. Single regions are important components of the network; however, behavioral responses depend on both regional brain activity and the interregional functional connectivity of the involved brain networks (McIntosh and Gonzalez-Lima, 1994, 1995; McIntosh, 2001, 2004). Examining functional interactions between different brain regions can provide a more useful perspective into the neural mechanism underlying a specific behavioral outcome. SEM can help characterize functional interactions; however, this approach represents an isolated system. Still the combination of metabolic mapping techniques and anatomically based SEM provides a strong approach to understanding brain-behavior relationships at the systems level.
Acknowledgements
This work was supported by National Institutes of Health grants R01 NS37755, R01 MH076847 and T32 MH65728 directed by FGL. We thank Jose Saavedra, Julio Rojas, Jessica Gutierrez and Stanley Lewis for their technical assistance.
Footnotes
Publisher's Disclaimer: This is a PDF file of an unedited manuscript that has been accepted for publication. As a service to our customers we are providing this early version of the manuscript. The manuscript will undergo copyediting, typesetting, and review of the resulting proof before it is published in its final citable form. Please note that during the production process errors may be discovered which could affect the content, and all legal disclaimers that apply to the journal pertain.
REFERENCES
- Adler LE, Olincy A, Cawthra EM, McRae KA, Harris JG, Nagamoto HT, Waldo MC, Hall MH, Bowles A, Woodward L, Ross RG, Freedman R. Varied effects of atypical neuroleptics on P50 auditory gating in schizophrenia patients. Am J Psychiatry. 2004;161:1822–1828. doi: 10.1176/ajp.161.10.1822. [DOI] [PubMed] [Google Scholar]
- Arnault P, Roger M. Ventral temporal cortex in the rat: connections of secondary auditory areas Te2 and Te3. J Comp Neurol. 1990;302:110–123. doi: 10.1002/cne.903020109. [DOI] [PubMed] [Google Scholar]
- Barrett D, Shumake J, Jones D, Gonzalez-Lima F. Metabolic mapping of mouse brain activity after extinction of a conditioned emotional response. J Neurosci. 2003;23:5740–5749. doi: 10.1523/JNEUROSCI.23-13-05740.2003. [DOI] [PMC free article] [PubMed] [Google Scholar]
- Braff DL. Information processing and attention dysfunctions in schizophrenia. Schizophr Bull. 1993;19:233–259. doi: 10.1093/schbul/19.2.233. [DOI] [PubMed] [Google Scholar]
- Bruchey AK, Shumake J, Gonzalez-Lima F. Network model of fear extinction and renewal functional pathways. Neuroscience. 2007;145:423–437. doi: 10.1016/j.neuroscience.2006.12.014. [DOI] [PMC free article] [PubMed] [Google Scholar]
- Buchel C, Friston KJ. Modulation of connectivity in visual pathways by attention: cortical interactions evaluated with structural equation modelling and fMRI. Cereb Cortex. 1997;7:768–778. doi: 10.1093/cercor/7.8.768. [DOI] [PubMed] [Google Scholar]
- Clementz BA, Geyer MA, Braff DL. Poor P50 suppression among schizophrenia patients and their first-degree biological relatives. Am J Psychiatry. 1998;155:1691–1694. doi: 10.1176/ajp.155.12.1691. [DOI] [PubMed] [Google Scholar]
- Conejo NM, Lopez M, Cantora R, Gonzalez-Pardo H, Lopez L, Begega A, Vallejo G, Arias JL. Effects of Pavlovian fear conditioning on septohippocampal metabolism in rats. Neurosci Lett. 2005;373:94–98. doi: 10.1016/j.neulet.2004.09.066. [DOI] [PubMed] [Google Scholar]
- Conejo NM, Gonzalez-Pardo H, Vallejo G, Arias JL. Changes in brain oxidative metabolism induced by water maze training. Neuroscience. 2007;145:403–412. doi: 10.1016/j.neuroscience.2006.11.057. [DOI] [PubMed] [Google Scholar]
- Coutureau E, Blundell PJ, Killcross S. Basolateral amygdala lesions disrupt latent inhibition in rats. Brain Res Bull. 2001;56:49–53. doi: 10.1016/s0361-9230(01)00592-5. [DOI] [PubMed] [Google Scholar]
- Coutureau E, Lena I, Dauge V, Di Scala G. The entorhinal cortex-nucleus accumbens pathway and latent inhibition: a behavioral and neurochemical study in rats. Behav Neurosci. 2002;116:95–104. doi: 10.1037//0735-7044.116.1.95. [DOI] [PubMed] [Google Scholar]
- Coutureau E, Galani R, Gosselin O, Majchrzak M, Di Scala G. Entorhinal but Not Hippocampal or Subicular Lesions Disrupt Latent Inhibition in Rats. Neurobiol Learn Mem. 1999;72:143–157. doi: 10.1006/nlme.1998.3895. [DOI] [PubMed] [Google Scholar]
- Feldon J, Weiner I. From an animal model of an attentional deficit towards new insights into the pathophysiology of schizophrenia. J Psychiatri Res. 1992;26:345–366. doi: 10.1016/0022-3956(92)90040-u. [DOI] [PubMed] [Google Scholar]
- Gal G, Schiller D, Weiner I. Latent inhibition is disrupted by nucleus accumbens shell lesion but is abnormally persistent following entire nucleus accumbens lesion: The neural site controlling the expression and disruption of the stimulus preexposure effect. Behav Brain Res. 2005;162:246–255. doi: 10.1016/j.bbr.2005.03.019. [DOI] [PubMed] [Google Scholar]
- Gonzalez-Lima F, Garrosa M. Quantitative histochemistry of cytochrome oxidase in rat brain. Neurosci Lett. 1991;123:251–253. doi: 10.1016/0304-3940(91)90943-n. [DOI] [PubMed] [Google Scholar]
- Gonzalez-Lima F. Brain imaging of auditory learning functions in rats: studies with fluorodeoxyglucose autoradiography and cytochrome oxidase histochemistry. In: Gonzalez-Lima, Finkenstädt, Scheich, editors. Advances in Metabolic Techniques for Brain Imaging of Behavioral and Learning Functions. Dordrecht: Kluwer Academic Publishers; 1992. [Google Scholar]
- Gonzalez-Lima F, Cada A. Cytochrome oxidase activity in the auditory system of the mouse: a qualitative and quantitative histochemical study. Neuroscience. 1994;63:559–578. doi: 10.1016/0306-4522(94)90550-9. [DOI] [PubMed] [Google Scholar]
- Gonzalez-Lima F, Cada A. Quantitative histochemistry of cytochrome oxidase activity: Theories, methods, and regional brain vulnerability. In: Lima Gonzalez., editor. Cytochrome Oxidase in Neuronal Metabolism and Alzheimer’s Disease. New York: Plenum; 1998. [Google Scholar]
- Hochberg Y. A Sharper Bonferroni Procedure for Multiple Tests of Significance. Biometrika. 1988;75:800–802. [Google Scholar]
- Hu D, Xu X, Gonzalez-Lima F. Vicarious trial-and-error behavior and hippocampal cytochrome oxidase activity during Y-maze discrimination learning in the rat. Int J Neurosci. 2006;116:265–280. doi: 10.1080/00207450500403108. [DOI] [PubMed] [Google Scholar]
- Jones D, Gonzalez-Lima F. Associative effects of Pavlovian differential inhibition of behaviour. Eur J Neurosci. 2001a;14:1915–1927. doi: 10.1046/j.0953-816x.2001.01810.x. [DOI] [PubMed] [Google Scholar]
- Jones D, Gonzalez-Lima F. Mapping Pavlovian conditioning effects on the brain: blocking, contiguity, and excitatory effects. J Neurophysiol. 2001b;86:809–823. doi: 10.1152/jn.2001.86.2.809. [DOI] [PubMed] [Google Scholar]
- Kilts CD. The changing roles and targets for animal models of schizophrenia. Biol Psychiatry. 2001;11:845–855. doi: 10.1016/s0006-3223(01)01286-0. [DOI] [PubMed] [Google Scholar]
- Kohler C. Intrinsic connections of the retrohippocampal region in the rat brain: III. The lateral entorhinal area. J Comp Neurol. 1988;271:208–228. doi: 10.1002/cne.902710204. [DOI] [PubMed] [Google Scholar]
- Light GA, Geyer MA, Clementz BA, Cadenhead KS, Braff DL. Normal P50 suppression in schizophrenia patients treated with atypical antipsychotic medications. Am J Psychiatry. 2000;157:767–771. doi: 10.1176/appi.ajp.157.5.767. [DOI] [PubMed] [Google Scholar]
- Lubow RE. Latent inhibition and conditioned attention theory. Cambridge, England: Cambridge University Press; 1989. [Google Scholar]
- Lubow RE, Moore AU. Latent inhibition: The effect of nonreinforced pre-exposure to the conditional stimulus. J Comp Physiol Psychol. 1959:415–419. doi: 10.1037/h0046700. [DOI] [PubMed] [Google Scholar]
- Lubow RE, Kaplan O. The visual search analogue of latent inhibition: implications for theories of irrelevant stimulus processing in normal and schizophrenic groups. Psychol Bull Rev. 2005;12:224–243. doi: 10.3758/bf03196368. [DOI] [PubMed] [Google Scholar]
- McIntosh AR. Mapping cognition to the brain through neural interactions. Memory. 1999;7:523–548. doi: 10.1080/096582199387733. [DOI] [PubMed] [Google Scholar]
- McIntosh AR. Towards a network theory of cognition. Neural Netw. 2001;13:861–870. doi: 10.1016/s0893-6080(00)00059-9. [DOI] [PubMed] [Google Scholar]
- McIntosh AR. Contexts and catalysts: a resolution of the localization and integration of function in the brain. Neuroinformatics. 2004;2:175–182. doi: 10.1385/NI:2:2:175. [DOI] [PubMed] [Google Scholar]
- McIntosh AR, Gonzalez-Lima F. Structural modeling of functional neural pathways mapped with 2-deoxyglucose: effects of acoustic startle habituation on the auditory system. Brain Res. 1991;547:295–302. doi: 10.1016/0006-8993(91)90974-z. [DOI] [PubMed] [Google Scholar]
- McIntosh AR, Gonzalez-Lima F. Structural modeling of functional visual pathways mapped with 2-deoxyglucose: effects of patterned light and footshock. Brain Res. 1992;578:75–86. doi: 10.1016/0006-8993(92)90232-x. [DOI] [PubMed] [Google Scholar]
- McIntosh AR, Gonzalez-Lima F. Network analysis of functional auditory pathways mapped with fluorodeoxyglucose: associative effects of a tone conditioned as a Pavlovian excitor or inhibitor. Brain Res. 1993;627:129–140. doi: 10.1016/0006-8993(93)90756-d. [DOI] [PubMed] [Google Scholar]
- McIntosh AR, Gonzalez-Lima F. Structural equation modeling and its application to network analysis in functional brain imaging. Human Brain Map. 1994a;2:2–22. [Google Scholar]
- McIntosh AR, Gonzalez-Lima F. Network interactions among limbic cortices, basal forebrain, and cerebellum differentiate a tone conditioned as a Pavlovian excitor or inhibitor: fluorodeoxyglucose mapping and covariance structural modeling. J Neurophysiol. 1994b;72:1717–1733. doi: 10.1152/jn.1994.72.4.1717. [DOI] [PubMed] [Google Scholar]
- McIntosh AR, Gonzalez-Lima F. Functional network interactions between parallel auditory pathways during Pavlovian conditioned inhibition. Brain Res. 1995;683:228–241. doi: 10.1016/0006-8993(95)00378-4. [DOI] [PubMed] [Google Scholar]
- Mechelli A, Price CJ, Friston KJ, Ishai A. Where bottom-up meets top-down: neuronal interactions during perception and imagery. Cereb Cortex. 2004;11:1256–1265. doi: 10.1093/cercor/bhh087. [DOI] [PubMed] [Google Scholar]
- Newman R, Winans SS. An experimental study of the ventral striatum of the golden hamster. II. Neuronal connections of the olfactory tubercle. J Comp Neurol. 1980;191:193–212. doi: 10.1002/cne.901910204. [DOI] [PubMed] [Google Scholar]
- Parsons RG, Riedner BA, Gafford GM, Helmstetter FJ. The formation of auditory fear memory requires the synthesis of protein and mRNA in the auditory thalamus. Neuroscience. 2006;141:1163–1170. doi: 10.1016/j.neuroscience.2006.04.078. [DOI] [PMC free article] [PubMed] [Google Scholar]
- Paxinos G, Franklin K. The mouse brain in stereotaxic coordinates. 2 Edition. San Diego: Academic; 2001. [Google Scholar]
- Penny WD, Stephan KE, Mechelli A, Friston KJ. Modelling functional integration: a comparison of structural equation and dynamic causal models. Neuroimage. 2004;23:S264–S274. doi: 10.1016/j.neuroimage.2004.07.041. [DOI] [PubMed] [Google Scholar]
- Poremba A, Jones D, Gonzalez-Lima F. Metabolic effects of blocking tone conditioning on the rat auditory system. Neurobiol Learn Mem. 1997;68:154–171. doi: 10.1006/nlme.1997.3792. [DOI] [PubMed] [Google Scholar]
- Poremba A, Jones D, Gonzalez-Lima F. Classical conditioning modifies cytochrome oxidase activity in the auditory system. Eur J Neurosci. 1998;10:3035–3043. doi: 10.1046/j.1460-9568.1998.00304.x. [DOI] [PubMed] [Google Scholar]
- Rimer M, Barrett DW, Maldonado MA, Vock VM, Gonzalez-Lima F. Neuregulin-1 immunoglobulin-like domain mutant mice: clozapine sensitivity and impaired latent inhibition. Neuroreport. 2005;16:271–275. doi: 10.1097/00001756-200502280-00014. [DOI] [PubMed] [Google Scholar]
- Roger M, Arnault P. Anatomical study of the connections of the primary auditory area in the rat. J Comp Neurol. 1989;287:339–356. doi: 10.1002/cne.902870306. [DOI] [PubMed] [Google Scholar]
- Sakata JT, Coomber P, Gonzalez-Lima F, Crews D. Functional connectivity among limbic brain areas: Differential effects of incubation temperature and gonadal sex in the Leopard gecko, Eublepharis macularius. Brain Behav Evol. 2000;55:139–151. doi: 10.1159/000006648. [DOI] [PubMed] [Google Scholar]
- Sakata JT, Crews D, Gonzalez-Lima F. Behavioral correlates of differences in neural metabolic capacity. Brain Res Rev. 2005;48:1–15. doi: 10.1016/j.brainresrev.2004.07.017. [DOI] [PubMed] [Google Scholar]
- Schiller D, Weiner I. Basolateral amygdala lesions in the rat produce an abnormally persistent latent inhibition with weak preexposure but not with context shift. Behav Brain Res. 2005;163:115–121. doi: 10.1016/j.bbr.2005.04.005. [DOI] [PubMed] [Google Scholar]
- Schmajuk NA, Lam Y-W, Gray JA. Latent inhibition: A neural network approach. J Exp Psychol Anim Behav Process. 1996;22:321–349. doi: 10.1037//0097-7403.22.3.321. [DOI] [PubMed] [Google Scholar]
- Schmajuk NA, Cox L, Gray JA. Nucleus accumbens, entorhinal cortex and latent inhibition: A neural network model. Behav Brain Res. 2001;118:123–141. doi: 10.1016/s0166-4328(00)00319-3. [DOI] [PubMed] [Google Scholar]
- Shohamy D, Allen MT, Gluck MA. Dissociating entorhinal and hippocampal involvement in latent inhibition. Behav Neuro. 2000;114:867–874. [PubMed] [Google Scholar]
- Shumake J, Barrett D, Gonzalez-Lima F. Behavioral characteristics of rats predisposed to learned helplessness: reduced reward sensitivity, increased novelty seeking, and persistent fear memories. Behav Brain Res. 2005;164:222–230. doi: 10.1016/j.bbr.2005.06.016. [DOI] [PubMed] [Google Scholar]
- Siegel C, Waldo M, Mizner G, Adler LE, Freedman R. Deficits in sensory gating in schizophrenic patients and their relatives. Evidence obtained with auditory evoked responses. Arch Gen Psychiatry. 1984;41:607–612. doi: 10.1001/archpsyc.1984.01790170081009. [DOI] [PubMed] [Google Scholar]
- Weiner I. Neural substrates of latent inhibition: The switching model. Psychol Bull. 1990;108:442–461. doi: 10.1037/0033-2909.108.3.442. [DOI] [PubMed] [Google Scholar]
- Weiner I. The 'two-headed' latent inhibition model of schizophrenia: Modeling positive and negative symptoms and their treatment. Psychopharmacology. 2003;169:257–297. doi: 10.1007/s00213-002-1313-x. [DOI] [PubMed] [Google Scholar]
- Weiner I, Feldon I. The switching model of latent inhibition: An update of neural substrates. Behav Brain Res. 1997;88:11–25. doi: 10.1016/s0166-4328(97)02314-0. [DOI] [PubMed] [Google Scholar]
- Wright S. The method of path coefficients. Annals of Mathematical Statistics. 1934;5:161–215. [Google Scholar]
- Wong-Riley MT. Cytochrome oxidase: an endogenous metabolic marker for neuronal activity. Trends Neurosci. 1989;12:94–101. doi: 10.1016/0166-2236(89)90165-3. [DOI] [PubMed] [Google Scholar]