

Abstract
The maternal separation paradigm has been applied to C57BL/6J mice as an animal developmental model for understanding structural deficits leading to abnormal behaviour. A maternal separation (MS) model was used on postnatal day (PND) 9, where the pups were removed from their mother for 24 h (MS24). When the pups were 10 weeks old, the level of anxiety and fear was measured with two behavioural tests; an open field test and an elevated plus maze test. The Barnes platform maze was used to test spatial learning, and memory by using acquisition trials followed by reverse trial sessions. The MS24 mice spent more time in the open arms of the elevated plus maze compared to controls, but no other treatment differences were found in the emotional behavioural tests. However, in the reverse trial for the Barnes maze test there was a significant difference in the frequency of visits to the old goal, the number of errors made by the MS24 mice compared to controls and in total distance moved. The mice were subsequently sacrificed and the total number of neurons estimated in the hippocampus using the optical fractionator. We found a significant loss of neurons in the dentate gyrus in MS mice compared to controls. Apparently a single maternal separation can impact the number of neurons in mouse hippocampus either by a decrease of neurogenesis or as an increase in neuron apoptosis. This study is the first to assess the result of maternal separation combining behaviour and stereology.
Keywords: Maternal separation, Behaviour, Hippocampus, Stereology
Introduction
Developing an animal model of mental disorders is controversial due to the human nature of the symptoms such as hallucinations, delusions and poverty of speech. These symptoms can only be adequately assessed by psychological assessments and therefore cannot be modulated in animals. A way to try to circumvent these problems is studying certain psychological or psychophysiological aspects of mental disorders such as latent inhibition, prepulse inhibition or P50 gating (Ellenbroek and Cools 1990, 1995; Geyer and Markou 1995; Ellenbroek et al. 2004). However, it is still unclear how (and if) these abnormalities are linked to the symptoms of mental illness. In rodent models prepulse inhibition (PPI) of the acoustic startle response is a model of sensorimotor gating mechanisms in the brain, while an equivalent reaction in humans is eye blinking (Braff et al. 1978; Ellenbroek et al. 1998). It has been shown that rat pups that underwent 24 h maternal separation on postnatal day (PND) 6 or 9 expressed reduced prepulse inhibition (PPI) on postnatal day 69 and had hyperactivity of the dopamineric system involving the dopamine neurotransmitter system via the hypothalamic–pituitary–adrenal (HPA) axis (Ellenbroek and Cools 1995). Further, the PPI deficits could be reversed with typical antipsychotic drugs like haloperidol and were not detected prior to puberty (Ellenbroek et al. 1998). Due to the changes seen in the HPA axis, the dopamine system, hippocampus and long-term behavioural effects modelling deficits seen in mental patients has lead Ellenbroek and co-workers to hypothesis the 24-h maternal deprivation model to be a “schizophrenia-like” neurodevelopmental animal model (Ellenbroek and Cools 1998, 2002; Ellenbroek et al. 1998, 2004, 2005).
One of the striking characteristics of the developing neuroendocrine stress system in the mouse and rat is a period of reduced stress-responsiveness, the so-called stress hypo-responsive period (SHRP) (Schapiro et al. 1962; Cirulli et al. 1994; Schmidt et al. 2002). From about postnatal day (PND) 4–14 in the rat, and PND 1–12 in the mouse, the animals neuroendocrine system is characterized by a low basal corticosterone level and by the inability of a mild stressor, e.g. exposure to novelty, to induce a corticosterone response (Cirulli et al. 1994; Schmidt et al. 2003). In this study, we used the C57BL/6 inbred mouse. Due to a similar postnatal neurodevelopmental course in the mouse and rat (Clancy et al. 2001), we used PND 9 as the day of separation equivalent to Ellenbroek and co-workers day of choice in the rat. We tested if a 24-h maternal separation on PND 9 can cause an adult phenotype characterized by altered levels of activity and anxiety, learning and memory dysfunction, deficits in behavioural flexibility (reversal deficits) as well as changes in number of neurons in the hippocampus and its subregions in the mouse brain.
Material and methods
Animals
The offspring of 4 male and 8 female C57BL/6J mice (8 weeks old) obtained from Taconic Europe (Taconic Farms Inc., DK) were used in this study. The animals were acclimatized to the animal facility for 1 week. Multiparous females were used, since there is a higher rate of offspring survival. The animals were housed under a 12:12 h light/dark cycle (lights on at 6 a.m.) with constant temperature (21 ± 2°C) and humidity (52 ± 2%) in Macrolon type III cages with environmental enrichment in the form of wood splints bedding (aspen 4HV), wood shavings, 1 piece of Aspen Corner 15, 1 standard mouse house made of recycled cardboard, 1 aspen chewing stick size medium, and pads of nesting material (all obtained from Brogaarden, DK). Food (Altromin pills NR 1324) and tap water were available ad libitum. Two females were placed in a male’s cage for a period of 1 week to ensure conception, followed by separation of the two females to their own cages.
Maternal separation
Pregnant females were checked for litters daily at 09:00 a.m. If litters were found, the day of birth was defined as PND 0 for that litter. On PND 0, litters were randomly assigned to maternal separation (MS) (N = 16, 9 males and 7 females), or to standard facility rearing (SFR). For the behavioural testing, 16 MS animals (4 males and 6 females) and 5 SFR animals (2 males and 3 females) were included, while 12 of the MS animals (2 males and 10 females) and 7 control animals (2 males and 5 females) were used for cell counting. Litters were not culled or sexed at birth to minimize the handling of the pups, but male and female pups were separated at weaning (PND 28) and group housed with their siblings, which resulted in 2–5 mice per cage. The environmental enrichment applied to the mothers was also applied to the MS and control animals.
The 24-h deprivation was carried out on PND 9 starting at 8 a.m. The pups remained in the home cage but were placed in a separate room with the same temperature, humidity and lighting conditions as the home stable. The cage was placed on a heating pad, which had a constant temperature of 31°C. No food or water was available during the separation. The dam was placed in a cage with similar facilities as the home cage in the home stable. The pups were checked every 3 h, using a red light during the night. Body weights were recorded before and after separation. Immediately after 24 h the dams were returned to the home cage and reunited with the pups.
Test for anxiety and fear related behaviour
When the pups reached 10 weeks of age they were subjected once to the open field test (Hall 1934) and the elevated plus maze test, which is based on the procedure used by Montgomery (1955) and later validated by Pellow et al. (1985). Behaviour was analysed using EthoVision (Noldus, Groeningen, The Netherlands). All behavioural testing took place between 10 a.m. and 3 p.m.
Open field test (OFT)
The open field consisted of a circular wooden platform (diameter 90 cm) surrounded by a 43 cm high wall with a camera mounted directly above. A central circle of 31 cm diameter was defined in the behaviour analysis software. Three 60-W light bulbs illuminated the arena. On the day of testing each animal was transported in a cardboard box to the centre of the open field and behaviour was recorded for 10 min. After the trial the maze was cleaned with a solution of acetic acid and soap water and faecal boli were counted.
The following parameters were calculated; total distance moved (cm), time spent in central circle and time spent in peripheral zone (expressed as % of session duration).
Elevated plus maze
The plus maze was elevated 50 cm above the ground and consisted of two opposing open arms (21 cm × 8 cm) connected by a central square (8 cm × 8 cm) to two opposing enclosed arms of the same size with 32 cm high walls. A video camera placed above the maze recorded the animals’ behaviour. On the day of testing, the animal was placed in the centre of the maze and behaviour was recorded for 10 min. Between trials the maze was cleaned as described for the OFT. The following parameters were calculated; total duration (s) in open and closed arms, the number of entries into the open and closed arms and the total distance moved (cm). From these parameters the ratio of entries into the open arms to the total number of arm entries, and the ratio of time spent in the open arms to time spent in both open and closed arms was calculated.
Test for spatial memory; Barnes maze
The Barnes maze (Barnes 1975) consisted of a circular, white-coated platform 90 cm in diameter and elevated 50 cm over the ground. Sixteen 5 cm wide holes were evenly distributed around the perimeter, 2.5 cm from the edge. A pair of rails was placed under two opposing holes to hold the hidden escape box. The escape box was a dark plastic storage box with a 5 cm diameter hole in the lid. A dark cylindrical cardboard tube (7.5 cm × 7 cm high) with a lid was used as the transport and start chamber.
Three 60-W bulbs illuminating the maze and high irregular rock and techno music played from a computer in a random manner provided the aversive stimuli. As with the previous test, a digital video camera mounted above the maze recorded animal’s behaviours.
Shaping
For 2 days before testing commenced, the animals were trained to enter the hidden escape box. Using the transport cylinder, the mouse was placed near the edge of the target hole with the hidden escape box underneath. Two cardboard walls blocked entry to adjacent holes. Only dim lightning and no noise was used during this phase of the experiment. The animal was allowed 5 min to enter the escape box and if this failed, it was placed manually inside. When the animal entered the box it was quickly carried to the home cage.
Acquisition trials
Six consecutive trials were given, one per day. The animal was placed in the transport cylinder, oriented in a random direction, in the centre of the maze. The aversive stimuli were turned on and the cylinder removed. Recording in the behaviour-observation software began immediately after the experimenter had left the room. The trial ended after 5 min or when the animal entered the hidden escape box. If the animal failed to enter the box or re-entered the maze after recording was stopped, the aversive stimuli were turned back on and the animal was allowed 5 min more to enter the escape box. If that also failed, the animal was manually placed in the box. After completion of each trial, the box was placed in the home cage.
Reversal trials
Three days after acquisition trials, the escape box was placed underneath the hole opposite to the hole that had been the target during acquisition training. Reversal training was conducted for seven consecutive days as described above.
Parameters
Each of the 16 escape holes in the Barnes maze was defined as a separate zone-of-interest in the behaviour analysis software. The following parameters were analysed: latency to target [time from start of the trial to first entry into the target hole zone (s)], total distance moved (cm) and error frequency (number of visits to other holes than the target hole). During reversal training two additional parameters were analysed: the mean number of visits to the old target hole over the seven trials (the hole where the escape box was located during acquisition training) and the mean number of visits to the two holes adjacent to the old target hole.
Three different search strategies could be distinguished and were scored manually. The random search strategy is characterized by a non-systematic exploration of the maze with many centre maze crossings and some perseverations. Perseverations were defined as repeatedly searching the same hole or two adjacent holes (Bach et al. 1995). Secondly, there is the serial search strategy, defined as systematic consecutive hole searching in a clockwise or counter clockwise manner and finally a spatial search strategy, defined as searching less than three holes from the location of the goal (Barnes 1979; Bach et al. 1995; Inman-Wood et al. 2000; Zhang et al. 2002; Raber et al. 2004) (Fig. 1).
Fig. 1.

Three different search strategies could be applied: Random, a pattern that include many hole examinations in a random manner; Serial, a relative systematic search either clockwise or counterclockwise; Spatial, a pattern where the target box is found within relative short time and with high accuracy
Fixation and embedding
Approximately 1 week after all tests were concluded, the animals were scarified by CO2 asphyxiation and within 1 h the brains were dissected out and placed in a 37% formalin solution (Fixatin). The brains were split through corpus callosum, separating the two hemispheres. After systematic random assignment of left or right hemisphere they were coloured on the outer surface to preserve a coded sequence and embedded in paraffin with an automatic vacuum tissue processor (Leica ASP300). The hemispheres were then mounted horizontally balancing on needles and embedded in a paraffin block with up to four hemispheres in one block
Sectioning
The whole hemisphere was cut horizontally with a Leica (model SM 2400) microtome with a microtome setting of 40 μm thickness. All sections were mounted on silicone-coated glass (Frost +). After a minimum of 24 h in a 40°C heating cupboard, the sections were sampled systematic uniformly randomly (SURS). The first section was randomly selected from a random number table, hereafter every 6th section was sampled systematically for staining and counting. This provided a total of 8–10 sections containing the hippocampus per specimen. To be able to account for block advance (BA) the block height was measured for every 100th section. The BA determines the hitting probability of the particles within the block (see later for calculation). Furthermore, the paraffin shrinkage effect was calculated and amounted to about 70%. The sections were stained with a modified Vogt’s Cresyl violet acetate (Armed forces).
Optical design equipment
The optical design equipment consisted of an Olympus BH-2 microscope with an oil immersion 100× objective of high numerical aperture (NA = 1.40), which allows focusing in a thin focal plane inside a thick section. A camera transmits the image to a computer screen where a counting frame is superimposed using the computer-assisted stereological (CAST)-Grid software (Visiopharm, Hørsholm, DK). A motorized automatic stage was used to control movement in the x,y- plane via a connected joystick. Movement in the z-axis was controlled manually with the focus button on the microscope and the distance between the upper and lower surfaces of the sections was measured with a Heidenhein microcator (Heidenhain, Germany) with a precision of 0.5 μm.
Definitions and divisions of the hippocampus
The hippocampus was subdivided into five regions; the dentate gyrus (DG), the hilus of the dentate gyrus (CA4), regio inferior (CA3/2), region superior (CA1) and subiculum.
Neurons were counted manually in the sub-sampled sections containing the hippocampus, using the optical disector design. The layers comprising the hippocampus were defined consistently in all sections using the terminology of Blackstad (1956). It was not considered too difficult to differentiate the neuronal layers in horizontal sections (Fig. 2). The granule cell layer and the pyramidal cell layers also contain the cell bodies of basket cells and glial cells. The glial cells can be easily identified and counted separately, but the basket cells are so similar in appearance to the granule and pyramidal cells that they are included in the estimates. It was previously shown that they comprise less than 1% of the neurons in these layers (review West et al. 1991).
Fig. 2.

A schematic drawing of the hippocampus with the five subregions identified in this study. Dg, the granule cell layer of the dentate gyrus; h/CA4, hilus of the dentate gyrus; ri, regio inferior; CA3/2, rs, region superior; CA1, s, subiculum
Stereological equations
Estimation of the total neuron number, N
For the estimation of total neuron numbers, neurons were counted in optical disectors and sampled according to the so-called fractionator principles. In a fractionator, cells are counted directly in a known fraction of the different hippocampal subdivisions and the total neuron number, N, is estimated by multiplying the number of particles counted with the reciprocal sampling fractions:
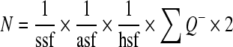 |
where ssf is the section sampling fractions, asf the area sampling fraction, and hsf the height sampling fraction. The bilateral cell number is estimated by multiplying the unilateral number ∑Q− by 2. This is admissible when the right or left hippocampus is sampled systematically randomly.
The asf is known as the area of the counting frame of the disector relative to the area associated with each x,y-step movement of the disector:
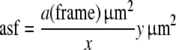 |
After having ascertained that the cell density was constant within the disector height, the height sampling fraction was defined as:
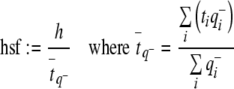 |
is the q− weighted mean section thickness (Gundersen et al. 1988; Dorph-Petersen 2001).
Estimation of total volume—the Cavalieri estimator
Besides estimating total neuron numbers, it was also decided to estimate total volume of the different compartments of the hippocampus although the main purpose was estimation of cell numbers. Estimates of volume were obtained according to the principles of Cavalieri’s basic estimator (Gundersen and Jensen 1987) and corrected for shrinkage. Notice that these volumes were not used for the estimation of total neuron number. The estimates of total neuron number obtained by the fractionator design are independent of the containing volume. Further, when total number and volume is estimated, the density, NV (cells/mm3) can be obtained as well without extra work.
Error predictions
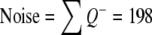
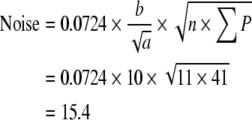
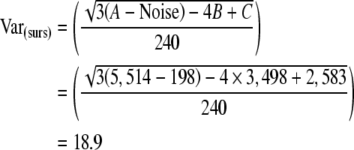
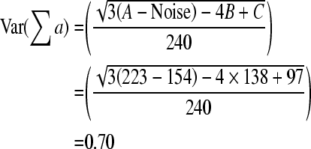
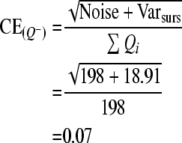
The precision of the two different estimates (neuron number and volume) can be expressed by the coefficient of error, CE. The CE for the Cavalieri estimation of volume was first formulated and described by Gundersen and Jensen (1987) revised in Gundersen et al. (1999). Table 1 gives an example of how CE for both volume and neuron estimates are calculated in this study (see also Gundersen et al. 1999).
Table 1.
Example of how the CE is calculated for neuron number and volume respectively
| Section | Q−j | A:Qi × Qi | B:Qi × Qi + 1 | C:Qi × Qi + 2 | Section | P−j | A:Pi × Pi | B:Pi × Pi + 1 | C:Pi × Pi + 2 |
|---|---|---|---|---|---|---|---|---|---|
| 1 | 11 | 121 | 616 | 231 | 1 | 2 | 4 | 22 | 8 |
| 2 | 56 | 3,136 | 1,176 | 1,064 | 2 | 11 | 121 | 44 | 33 |
| 3 | 21 | 441 | 399 | 378 | 3 | 4 | 16 | 12 | 12 |
| 4 | 19 | 361 | 342 | 57 | 4 | 3 | 9 | 9 | 3 |
| 5 | 18 | 324 | 54 | 198 | 5 | 3 | 9 | 3 | 9 |
| 6 | 3 | 9 | 33 | 48 | 6 | 1 | 1 | 3 | 3 |
| 7 | 11 | 121 | 176 | 165 | 7 | 3 | 9 | 9 | 6 |
| 8 | 16 | 256 | 240 | 352 | 8 | 3 | 9 | 6 | 15 |
| 9 | 15 | 225 | 330 | 90 | 9 | 2 | 4 | 10 | 8 |
| 10 | 22 | 484 | 132 | – | 10 | 5 | 25 | 20 | – |
| 11 | 6 | 36 | – | – | 11 | 4 | 16 | – | – |
| Sum | 198 | 5,514 | 3,498 | 2,583 | Sum | 41 | 223 | 138 | 97 |
 |
 |
||||||||
 |
 |
||||||||
 |
 |
||||||||
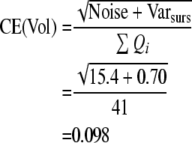
When an appropriate number of sections have been chosen (10 or a little less), it is the number of points counted (the noise) which decides the precision of the estimate. To count about 200 points per sample is usually enough to obtain a CE around 5–8%, unless the object is very irregular (Gundersen and Jensen 1987; Gundersen et al. 1988; West and Gundersen 1990). When CE is estimated for the cell counting, Noise is equal to ∑Q−.
Statistical analyses
All data were analysed with the statistical software packages SPSS (Statistical Package for the Social Sciences, version 14.00) or SigmaStat (version 2.0). If Levene’s test for equality of variances did not fail, a t test was applied to test for differences between the two experimental groups. For data where normality tests failed, the non-parametric tests Mann–Whitney U test and Kruskal–Wallis test were applied. The animals performance over the six acquisition trials and the seven reversal trials in the Barnes maze was analysed by mixed-model analysis of variance with trial as within-subject factor and experimental group as between-subjects factor. Homogeneity of the variance-difference scores was determined by Mauchly’s test of sphericity [SPSS Inc. Chicago, IL, USA. SPSS Base version 11.5 User Manual; 2004]. When the assumption of sphericity was violated, degrees of freedom were adjusted with the Huynh–Feldt correction. Group differences in strategy selection in the Barnes maze were analysed with the likelihood-ratio chi-square test for each trial separately. Group differences were considered significant when P < 0.05.
Results
Only significant behavioural results are depicted and statistically elaborated.
Body weights
A significant weight loss was found in the pups after separation (P = 0.019, paired t test). However, 8 weeks after separation the body weights of MS and SFR animals were similar (P = 0.61, unpaired t test).
Open field test
Both experimental groups spent more time in the periphery of the open field than the centre (P < 0.001, t test). There was no significant difference between MS and SFR groups in either distance moved or frequency of visits to and time spent in the centre or periphery of the open field (data not shown).
Elevated plus maze
The MS animals spent more time in the open arms than the SFR animals and allotted a greater percentage of time spent in both open and closed arms to the open arms (P = 0.035 and P = 0.046, t test, respectively; Fig. 3).
Fig. 3.

The mean (+SEM) time spent in both the open and closed arms. *There was a significant difference between MS 24 (N = 16) and SFR 24 (N = 5) in time spent in open arms (P < 0.05, ANOVA). ** Time spent in closed arms compared with time spent in open arms (P < 0.001, t test)
In trial progress there was a significant difference in both frequency and duration in closed and open arms [Closed arms frequency: (F(9,171) = 3.544, P < 0.0001) and duration: (Wilk’s λ F(9,11) = 6.045, P = 0.004), Open arms frequency: (Wilk’s λ F(9,11) = 8.086, P = 0.001) and duration: (F(9,171) = 6.253, P < 0.0001)].
There was no significant difference in any of the other parameters analysed.
Barnes maze
Acquisition trials
Latency to reach the target hole, total distance moved on the maze, and error frequency all decreased significantly over the course of the six acquisition trials (F(4.3,77.4) = 3.88, P = 0.005; F(5,90) = 2.56, P = 0.033; F(3.9,70.1) = 2.49, P = 0.05; respectively), indicating that the animals indeed learned the task. There was, however, no significant difference between the two experimental groups.
Reversal trials
Latency to reach the new target hole (Fig. 4 left) total distance moved on the maze (Fig. 5), and error frequency (Fig. 6) all decreased significantly over the course of the seven reversal trials (F(3.1;55.95) = 3.08, P < 0.05; F(1.85;33.41) = 16.24, P < 0.001; F(3.43,61.68) = 18.79, P < 0.001, respectively). The MS24 animals made significantly more errors over the course of reversal training (F(1, 18) = 4.79, P < 0.05; Fig. 6) and travelled longer distances (Fig. 5; P = 0.008, Mann–Whitney U-test). This might indicate that the MS animals did not learn the reversal task as fast as the controls.
Fig. 4.

Left: Mean (±SEM) latency to “Goal”. There was a significant difference in Trial progress and a significant Trial x Group interaction (P < 0.05). Right: Mean (±SEM) frequency of visits to “Old Goal”. There was * a significant difference between the two groups (P < 0.05, Mann–Whitney U test) and a significant decrease over time (P < 0.05, RM ANOVA). MS 24 (N = 16) and SFR (N = 5)
Fig. 5.

Mean (±SEM) distance moved in reverse trials. There was a significant decrease over time (P < 0.05, RM ANOVA) and * a significant difference between the two treatment groups (P < 0.05, Mann–Whitney U test) but no significant Trial x Group interaction. MS 24 (N = 16) and SFR (N = 5)
Fig. 6.

Mean (±SEM) frequency of errors in MS 24 (N = 16) and SFR (N = 5) * there was a significant difference between the two treatment groups and a significant decrease in Trial progress (P < 0.05). MS 24 (N = 16) and SFR (N = 5)
The MS24 animals made significantly more visits to the old target hole (Fig. 4 right) and the two adjacent holes over the course of the seven reversal trials (t(17.5) = 3.72, P < 0.01; t(17.5) = 4.34, P < 0.001).
This tendency to venture to the old goal and the adjacent holes could be an indication of perseveration, a behavioural pattern also found in other animal models and in schizophrenic patients (Bleuler 1950; Bach et al. 1995; review Crider 1997)
Search strategies
The animal’s search pattern evolved over time (Fig. 7). The usual behaviour sequence was a progression from a random to a serial, and finally to a spatial search strategy. This sequence indicates that the animals became more accurate and more efficient in locating the correct hole. Likelihood-ratio chi-square tests showed that the experimental groups differed in their choice of search strategy on days 2 and 3 of acquisition training (χ(2) = 10.5, P < 0.01; χ(2) = 6.6, P < 0.05, respectively). Already at this early time the SFR animals adopted a serial search strategy while the MS animals maintained a random search strategy. On all other acquisition and reversal training days the two experimental groups did not differ significantly with respect to their choice of search strategy.
Fig. 7.

Overview of mean (%) search strategies applied in the acquisition and reverse trial sessions. The search pattern evolved over time from a random to a serial, and finally to a spatial search strategy. From acquisition days 2 and 3, the SFR animals adopted a serial search strategy, while the MS animals maintained a random search strategy. On all other acquisition and reversal training days the two experimental groups did not differ significantly with respect to their choice of search strategy. SFR (N = 5) animals to the left and MS (N = 16) animals to the right
Neuron number
The stereological sampling is shown in Table 2.
Table 2.
Overview of the stereological sampling used in this study
| Subiculum | CA4 | CA1 | CA3 | DG | |
|---|---|---|---|---|---|
| MS (maternal separated) | |||||
| Area (frame) (μm2) | 770–1,160 | 710–1,100 | 259 | 259 | 259 |
| Z depth (μm) | 20 | 20 | 20 | 20 | 20 |
| X and Y step (μm) | 175 | 80 | 100 | 100 | 170 |
| ∑Q− | 208 ± 36.5 | 140 ± 23.8 | 254 ± 15.7 | 193 ± 10.3 | 205 ± 15.4 |
| Mean section thickness, tq− (μm) | 39.5 ± 0.2 | 40.0 ± 0.30 | 39.0 ± 0.3 | 38.9 ± 0.30 | 39.3 ± 0.30 |
| Height sampling fraction, hsf | 1.97 ± 0.01 | 2.00 ± 0.01 | 1.95 ± 0.02 | 1.95 ± 0.01 | 1.96 ± 0.02 |
| Area sampling fraction, asf | 57.4 ± 11.5 | 16.8 ± 4.06 | 38.7 ± 0.00 | 30.7 ± 0.01 | 111 ± 0.00 |
| Section sampling fraction (k), ssf | 6 | 6 | 6 | 6 | 6 |
| Guard zone, (μm) | 5.5–7 | 5.5–7 | 5.5–7 | 5.5–7 | 5.5–7 |
| SFR (Control) | |||||
| Area (frame) (μm2) | 1,222 ± 61.6 | 1,388 ± 34.7 | 197 ± 0.1 | 240 ± 6.2 | 197 ± 0.1 |
| Z depth (μm) | 20 | 20 | 20 | 20 | 20 |
| X and Y step (μm) | 200 | 95 | 100 | 100 | 170 |
| ∑Q− | 245 ± 14.7 | 190 ± 14.4 | 215 ± 13.6 | 188 ± 11.8 | 201 ± 7.5 |
| Mean section thickness, tq− (μm) | 39.0 ± 0.60 | 39.1 ± 0.5 | 38.5 ± 0.6 | 38.2 ± 0.4 | 38.6 ± 0.4 |
| Height sampling fraction, hsf | 1.95 ± 0.03 | 1.95 ± 0.02 | 1.93 ± 0.03 | 1.91 ± 0.02 | 1.93 ± 0.02 |
| Area sampling fraction, asf | 33.3 ± 1.62 | 6.46 ± 0.29 | 50.9 ± 0.03 | 42.0 ± 1.28 | 147 ± 0.07 |
| Section sampling fraction (k), ssf | 6 | 6 | 6 | 6 | 6 |
| Guard zone, (μm) | 5.5–7 | 5.5–7 | 5.5–7 | 5.5–7 | 5.5–7 |
There was no significant difference in the total bilateral neuron number in hippocampus (Table 3). However, in the five subregions of hippocampus, there was a significant difference in the dentate gyrus (P = 0.029, Students t test), but none in the four other regions (see Fig. 8; Table 3). The neuron loss in the dentate gyrus is equivalent to a 20% reduction in the maternal separated animals compared with controls. The results should be interpreted with caution due to the low number of subjects.
Table 3.
Total estimated neuron number in five subregions of the hippocampus
| Maternally separated (MS) N = 12 | Sex | Subiculum | CA4 | CA1 | CA3 | DG | Total | ||||||
|---|---|---|---|---|---|---|---|---|---|---|---|---|---|
| Subject | Neurons (103) | CE | Neurons (103) | CE | Neurons (103) | CE | Neurons (103) | CE | Neurons (103) | CE | Neurons (103) | CE | |
| Female | 331 | 0.08 | 42.9 | 0.13 | 292 | 0.06 | 190 | 0.07 | 672 | 0.07 | 1.529 | 0.09 | |
| Female | 264 | 0.10 | 34.8 | 0.13 | 243 | 0.06 | 189 | 0.07 | 576 | 0.07 | 1.307 | 0.09 | |
| Female | 371 | 0.08 | 18.6 | 0.18 | 303 | 0.06 | 226 | 0.06 | 474 | 0.08 | 1.393 | 0.09 | |
| Female | 107 | 0.08 | 21.2 | 0.08 | 142 | 0.08 | 112 | 0.09 | 334 | 0.10 | 716 | 0.09 | |
| Female | 148 | 0.07 | 23.1 | 0.07 | 213 | 0.07 | 144 | 0.08 | 354 | 0.10 | 882 | 0.08 | |
| Female | 132 | 0.07 | 20.6 | 0.08 | 262 | 0.06 | 174 | 0.07 | 665 | 0.07 | 1.254 | 0.07 | |
| Female | 138 | 0.07 | 20.2 | 0.07 | 155 | 0.08 | 163 | 0.08 | 552 | 0.07 | 1.028 | 0.07 | |
| Female | 189 | 0.12 | 67.9 | 0.13 | 202 | 0.07 | 134 | 0.08 | 460 | 0.08 | 1.053 | 0.10 | |
| Female | 144 | 0.05 | 23.1 | 0.07 | 230 | 0.07 | 171 | 0.07 | 597 | 0.07 | 1.166 | 0.07 | |
| Female | 197 | 0.05 | 20.9 | 0.07 | 229 | 0.07 | 203 | 0.07 | 484 | 0.09 | 1.135 | 0.07 | |
| Male | 237 | 0.10 | 67.2 | 0.12 | 257 | 0.06 | 191 | 0.07 | 487 | 0.09 | 1.239 | 0.09 | |
| Male | 242 | 0.10 | 37.4 | 0.13 | 224 | 0.06 | 186 | 0.07 | 788 | 0.06 | 1.488 | 0.09 | |
| Mean | 208 | 0.08 | 33.2 | 0.11 | 229 | 0.07 | 174 | 0.07 | 538 | 0.08 | 1.182 | 0.08 | |
| CV control (SFR) N = 7 |
0.50 | 0.36 | 0.28 | 0.21 | 0.26 | 0.25 | |||||||
| Female | 186 | 0.07 | 26.3 | 0.07 | 285 | 0.07 | 175 | 0.08 | 804 | 0.07 | 1.476 | 0.07 | |
| Female | 176 | 0.07 | 30.2 | 0.09 | 240 | 0.07 | 191 | 0.08 | 658 | 0.08 | 1.296 | 0.08 | |
| Female | 169 | 0.07 | 31.5 | 0.07 | 273 | 0.07 | 205 | 0.07 | 655 | 0.08 | 1.333 | 0.07 | |
| Female | 194 | 0.05 | 25.3 | 0.09 | 182 | 0.08 | 186 | 0.07 | 617 | 0.06 | 1.204 | 0.08 | |
| Female | 162 | 0.08 | 34.1 | 0.09 | 278 | 0.07 | 199 | 0.08 | 725 | 0.07 | 1.397 | 0.05 | |
| Male | 157 | 0.08 | 20.3 | 0.09 | 206 | 0.08 | 115 | 0.09 | 613 | 0.09 | 1.112 | 0.07 | |
| Male | 221 | 0.06 | 28.0 | 0.07 | 285 | 0.07 | 191 | 0.07 | 644 | 0.09 | 1.368 | 0.07 | |
| Mean | 181 | 0.07 | 27.9 | 0.08 | 250 | 0.07 | 180 | 0.08 | 674 | 0.08 | 1.312 | 0.08 | |
| CV | 0.07 | 0.12 | 0.17 | 0.06 | 0.11 | 0.08 | |||||||
| Student’s t test | P = 0.41 | P = 0.46 | P = 0.37 | P = 0.65 | P = 0.02* | P = 0.20 | |||||||
* P < 0.05
Fig. 8.

The total neuron number for the two treatment groups in five sub-regions of the mouse hippocampus for the pooled data in MS (N = 12) and SFR (N = 7). * MS ≠ SFR, P < 0.05, Student´s t test in the dentate gyrus. filled circle MS; open circle SFR; Sub Subiculum, CA 4 Hilus, DG Dentate Gyrus
Volume
After Cavalieri estimation of volume and correction for shrinkage (67.7%) a Student’s t test did not show any significant difference in either the total hippocampal volume or in the five subregions of the hippocampus between groups (Table 4).
Table 4.
Total estimated volume in five subregions of the hippocampus
| Maternally separated (MS) N = 12 | Sex | Subiculum | CA4 | CA1 | CA3 | DG | Total | ||||||
|---|---|---|---|---|---|---|---|---|---|---|---|---|---|
| Subject | Volume mm2 | CE | Volume mm2 | CE | Volume mm2 | CE | Volume mm2 | CE | Volume mm2 | CE | Volume mm2 | CE | |
| Female | 4.33 | 0.05 | 0.69 | 0.08 | 1.46 | 0.05 | 1.52 | 0.05 | 1.80 | 0.03 | 9.79 | 0.05 | |
| Female | 3.38 | 0.05 | 0.69 | 0.06 | 1.14 | 0.06 | 1.39 | 0.05 | 1.23 | 0.04 | 7.84 | 0.05 | |
| Female | 4.25 | 0.05 | 0.59 | 0.07 | 1.54 | 0.05 | 1.72 | 0.04 | 1.18 | 0.04 | 9.29 | 0.05 | |
| Female | 1.66 | 0.12 | 0.60 | 0.07 | 0.52 | 0.09 | 1.00 | 0.06 | 1.06 | 0.04 | 4.84 | 0.08 | |
| Female | 2.40 | 0.09 | 0.86 | 0.06 | 0.79 | 0.08 | 1.26 | 0.05 | 1.29 | 0.04 | 6.59 | 0.07 | |
| Female | 1.73 | 0.12 | 0.65 | 0.07 | 1.07 | 0.06 | 1.39 | 0.05 | 1.33 | 0.03 | 6.17 | 0.07 | |
| Female | 2.26 | 0.10 | 0.69 | 0.06 | 0.68 | 0.09 | 1.42 | 0.05 | 1.22 | 0.04 | 6.26 | 0.07 | |
| Female | 2.29 | 0.07 | 1.04 | 0.08 | 1.00 | 0.06 | 1.26 | 0.05 | 1.12 | 0.06 | 6.71 | 0.06 | |
| Female | 2.15 | 0.07 | 0.79 | 0.06 | 0.91 | 0.07 | 1.45 | 0.05 | 1.13 | 0.03 | 6.43 | 0.06 | |
| Female | 3.00 | 0.06 | 0.74 | 0.06 | 0.98 | 0.07 | 1.47 | 0.05 | 1.13 | 0.06 | 7.32 | 0.06 | |
| Male | 2.98 | 0.06 | 1.01 | 0.06 | 1.07 | 0.06 | 1.39 | 0.05 | 1.15 | 0.05 | 7.00 | 0.06 | |
| Male | 3.31 | 0.05 | 0.91 | 0.05 | 1.22 | 0.06 | 1.63 | 0.04 | 2.18 | 0.03 | 9.25 | 0.05 | |
| Mean | 2.81 | 0.08 | 0.77 | 0.07 | 1.03 | 0.07 | 1.41 | 0.05 | 1.32 | 0.04 | 7.34 | 0.06 | |
| CV Contol(SFR) N = 7 |
0.32 | 0.20 | 0.29 | 0.13 | 0.25 | 0.20 | |||||||
| Female | 2.97 | 0.08 | 0.78 | 0.07 | 1.26 | 0.06 | 1.69 | 0.04 | 1.56 | 0.03 | 8.25 | 0.06 | |
| Female | 2.29 | 0.09 | 0.91 | 0.07 | 1.01 | 0.06 | 1.22 | 0.05 | 1.45 | 0.03 | 6.88 | 0.07 | |
| Female | 2.51 | 0.09 | 0.87 | 0.06 | 1.16 | 0.06 | 1.88 | 0.04 | 1.38 | 0.04 | 7.82 | 0.06 | |
| Female | 2.55 | 0.09 | 0.52 | 0.09 | 0.85 | 0.07 | 1.30 | 0.05 | 0.73 | 0.04 | 6.05 | 0.07 | |
| Female | 2.10 | 0.11 | 0.86 | 0.07 | 0.98 | 0.07 | 1.48 | 0.05 | 1.30 | 0.04 | 6.73 | 0.07 | |
| Male | 2.32 | 0.10 | 0.52 | 0.10 | 1.03 | 0.07 | 1.19 | 0.05 | 1.73 | 0.05 | 6.78 | 0.08 | |
| Male | 2.83 | 0.08 | 0.70 | 0.07 | 1.17 | 0.05 | 1.46 | 0.05 | 1.58 | 0.04 | 7.72 | 0.06 | |
| Mean | 2.51 | 0.09 | 0.75 | 0.08 | 1.07 | 0.05 | 1.46 | 0.05 | 1.39 | 0.04 | 7.18 | 0.07 | |
| CV | 0.12 | 0.19 | 0.13 | 0.17 | 0.23 | 0.11 | |||||||
| Student’s t test | P = 0.40 | P = 0.79 | P = 0.76 | P = 0.62 | P = 0.66 | P = 0.79 | |||||||
Discussion
In the present study, 24 h maternal separation on PND 9 in mice pups resulted in a 20% neuron decrease in the dentate gyrus and behavioural perseverations in the Barnes maze. The anxiety and thus stress related behavioural tests conducted did not show any indications of an elevated anxiety level. On the contrary, the MS mice showed a reduced sign of anxiety, since they ventured more often onto the open arms than the equivalent control group. This could indicate that the SHRP was not repressed, in spite of our expectations. The results were thus surprising and contradicted some but not all other findings (Pihoker et al. 1993; Plotsky and Meany 1993; Cirulli et al. 1994; Wigger and Neuman 1999; Boccia and Pedersen 2001; Parfitt et al. 2004). A study by Lehman et al. (1999) found that MS 24 at PND 9 did not result in the anxiety/fear response predicted by the group (Lehmann et al. 1999). Others have also found that effects of a manipulation of the HPA axis cannot always be used to predict effects of the same manipulation of fear/anxiety expression at the behavioural level (see Lehmann et al. 1999; Parfitt et al. 2004). Furthermore, Parfitt et al. (2004) reported that maternally separated C57BL/6 male mice had a prolonged increase in plasma CORT after an acute stressor, but in adulthood showed no increased fear/anxiety behavioural response (Parfitt et al. 2004). The lack of fear response does evidently not necessarily mean that the corticosterone plasma level is not elevated in MS animals but since the corticosterone level was not measured this question remains unanswered. Finally, a study by Francis et al. (2002) concluded that MS rats subjected to an enriched environment could reverse the effect from MS on the HPA function and anxiety behaviour (Francis et al. 2002). In conclusion, we found that the MS mice in our study did not show behavioural indications on a repressed SHRP, which might be explained by the enriched environment the mice were kept in. The corticosterone plasma level was not measured.
In the data presented for the Barnes maze, there were no significant differences between the two treatment groups during the acquisition period. Latency to reach the target hole, total distance moved on the maze, and error frequency all decreased significantly over the course of the six acquisition trials and seven reversal trials, indicating that the animals were able to learn the task with time, which is in agreement with other studies (e.g. Pompl et al. 1999).
One consequence of hippocampal dysfunction is perseveration (Devenport et al. 1988). For the MS animals the group differences in the number of errors made, the goal parameter and the distance moved were therefore of interest. The differences found in the parameter “Close to Old Goal” the significantly higher frequency of “Errors” and visits to “Old Goal” by the MS 24 animals indicate that the MS animals were more perseverant which could point to a hippocampal lesion (Devenport et al. 1988; Bach et al. 1995). However, since perseveration is also a feature of prefrontal cortical dysfunction and there was no hippocampal dysfunction in the acquisition trials, we can only conclude that the behaviour in reversal trial may be related to hippocampus, but we cannot exclude that it is was caused by, e.g. a prefrontal cortical deficit.
One of the advantages of the Barnes maze is its ability to reveal the search strategies applied by the mice. The search strategies can be an indication of how well the cognitive abilities in the mice are due to the use of extra-maze cues (Barnes 1979; Holmes et al. 2002). In this study, an overall search pattern evolved with time. On initial trials the mice tended to use a random pattern and explore many incorrect holes, often returning to the centre after investigating the edge of the platform. With more experience the number of centre crossings decreased and a more systematic search was applied. Thus in later trials many mice went directly to the correct hole or one or two holes away before locating the hidden box. The mice learned the task better after a previous introduction to the platform and used the “Spatial” search strategy earlier. Furthermore, the SFR mice used the search strategy “Serial” significantly faster than the MS mice in the acquisition trials, but this was not true in the reversal trials. The serial search strategy requires the mouse to use the multiple relationships among extra-maze stimuli to find the escape tunnel (Barnes 1979; Bach et al. 1995). So apparently the MS mice needed more time to acquire to the spatial search strategy when learning the task, which could indicate a learning disability. However, since the MS mice did not show difficulties in using the spatial search strategy in the reverse trials, no firm conclusions can be made on this point.
Over 85% of granule cell neurogenesis are previously described to occur postnatally in the rodent with peak neurogenesis between PND 5 and 7 and total cell number increasing throughout the first year and continuing throughout life (Altman and Das 1965; Schlessinger et al. 1975; Bayer et al. 1982; Kuhn et al. 1996; Kempermann et al. 1998). Much research has focused on the neurogenesis in both the adult and newborn hippocampus of mammals (Kempermann et al. 1997; Gould et al. 1997; Eriksson et al. 1998; Tanapat et al. 1998, 2001; Gould et al. 1999; Lemaire et al. 2000; Malberg et al. 2000; Raber et al. 2004; Mirescu et al. 2004; Greisen et al. 2005) but only a few of these studies have used modified stereological methods (Kempermann et al. 1997; Eriksson et al. 1998; Gould et al. 1999; Lemaire et al. 2000; Malberg et al. 2000; Greisen et al. 2005). None of these previous studies have quantified the total cell numbers in the hippocampus using stereology in early trauma animal models or in humans. The model can apparently induce a neuron change in the hippocampus but whether the lower neuron number is a decrease due to a neuron loss or because neurogenesis has been affected in the peak period could not be determined in this study. Secondly, the impact of the neuron loss is not immediately linked to a possible memory deficit. Even though the MS animals had a reduced emotional responds in the elevated plus maze and showed perseverance in the Barnes maze, the cognitive deficits could just as well be due to a prefrontal damage and thus not a result of the decreased neuron numbers in DG.
We tested if a 24-h maternal separation on PND 9 can cause an adult phenotype characterized by altered levels of activity and anxiety, learning and memory dysfunction, deficits in behavioural flexibility (reversal deficits) as well as changes in number of neurons in the hippocampus and its subregions in the mouse brain. We found that a single 24 h maternal separation on PND 9 could elicit a reduced stress response in the elevated plus maze and induce perseveration behaviour in the Barnes maze. Further, a 20% reduction in total neuron numbers was found in the dentate gyrus of the hippocampus.
Ethics
The experiment was carried out in accordance with the European Communities Council Directive of 24 November 1986 (86/609/EEC) and the Danish legislation regulating animal experiments (Animal care and housing BEK nr 687 from 25/07/2003). The Danish Animal Experiments Inspectorate approved the protocols (Journal No. 2003/561–781).
Acknowledgments
We are grateful for the help and assistance from our technicians Susanne Sørensen and Hans Jørgen Jensen from Research Laboratory for Stereology and Neuroscience at Bispebjerg Hospital. Further, we wish to thank associated professor Thomas Krohn and animal caretaker Helene Rieman from Laboratory Animal Science and Welfare, KVL (The Royal Veterinary and Agricultural University) for letting KF work at the animal facilities. The financial support from The Lundbeck Foundation is sincerely acknowledged.
Open Access This article is distributed under the terms of the Creative Commons Attribution Noncommercial License which permits any noncommercial use, distribution, and reproduction in any medium, provided the original author(s) and source are credited.
References
- Altman J, Das D (1965) Autoradiograhic and histological evidence of postnatal hippocampal neurogenesis in rats. J Comp Neurobiology 124:319–336 [DOI] [PubMed]
- Arborelius L, Hawks BW, Owens MJ, Plotsky PM, Nemeroff CB (2004) Increased responsiveness of presumed 5-HT cells to citalopram in adult rats subjected to prolonged maternal separation relative to brief separation. Psychopharmacology (Berl) 176(3–4):248–255 [DOI] [PubMed]
- Bach ME, Hawkins RD, Osman M, Kandel ER, Mayford M (1995) Impairment of spatial but not contextual memory in CaMKII mutant mice with a selective loss of hippocampal LTP in the range of the theta frequency. Cell 81(6):905–915 [DOI] [PubMed]
- Barnes CA (1979) Memory deficits associated with senescence: a neurophysiological and behavioral study in the rat. J Comp Physiol Psychol 93(1):74–104 [DOI] [PubMed]
- Bayer SA, Yackel JW, Puri PS (1982) Neurons in the rat dentate gyrus granular layer substantially increase during juvenile and adult life. Science 216(4548):890–892 [DOI] [PubMed]
- Blackstad TW (1956) Commissural connections of the hippocampal region in the rat, with special reference to their mode of termination. J Comp Neurol 105(3):417–537 [DOI] [PubMed]
- Bleuler E (1950) Dementia praecox or the group of schizophrenias. New York International University Press, New York
- Boccia ML, Pedersen CA (2001) Brief vs. long maternal separations in infancy: contrasting relationships with adult maternal behavior and lactation levels of aggression and anxiety. Psychoneuroendocrinology 26(7):657–672 [DOI] [PubMed]
- Braff D, Stone C, Callaway E, Geyer M, Glick I, Bali L (1978) Prestimulus effects on human startle reflex in normals and schizophrenics. Psychophysiology 15(4):339–343 [DOI] [PubMed]
- Braff DL, Geyer MA, Swerdlow NR (2001) Human studies of prepulse inhibition of startle: normal subjects, patient groups, and pharmacological studies. Psychopharmacology (Berl) 156(2–3):234–258 [DOI] [PubMed]
- Cirulli F, Santucci D, Laviola G, Alleva E, Levine S (1994) Behavioral and hormonal responses to stress in the newborn mouse: effects of maternal deprivation and chlordiazepoxide. Dev Psychobiol 27(5):301–316 [DOI] [PubMed]
- Clancy B, Darlington RB, Finlay BL (2001) Translating developmental time across mammalian species. Neuroscience 105(1):7–17 [DOI] [PubMed]
- Crider A (1997) Perseveration in schizophrenia. Schizophr Bull 23(1):63–74 [DOI] [PubMed]
- Devenport LD, Hale RL, Stidham JA (1988) Sampling behavior in the radial maze and operant chamber: role of the hippocampus and prefrontal area. Behav Neurosci 102(4):489–498 [DOI] [PubMed]
- Dorph-Petersen KA, Nyengaard JR, Gundersen HJG (2001) Tissue shrinkage and unbiased stereological estimation of particle number and size. J Microsc 204(Pt 3):232–246 [DOI] [PubMed]
- Ellenbroek BA, Cools AR (1990) Animal models with construct validity for schizophrenia. Behav Pharmacol 1(6):469–490 [DOI] [PubMed]
- Ellenbroek BA, Cools AR (1995) Animal models of psychotic disturbances. In: den Boer J, Westenberg H, van Praag H (eds) Advances in the neurobiology of schizophrenia, vol 1. Wiley, Chichester, pp 89–109
- Ellenbroek BA, van den Kroonenberg PT, Cools AR (1998) The effects of an early stressful life event on sensorimotor gating in adult rats. Schizophr Res 30(3):251–260 [DOI] [PubMed]
- Ellenbroek BA, Cools AR (1998) The neurodevelopment hypothesis of schizophrenia: clinical evidence and animal models. Neurosci Res Com 22(3):127–136 [DOI]
- Ellenbroek BA, Sams Dodd F, Cools AR (2000) Simulation models for schizophrenia. In: Ellenbroek BA, Cools AR (eds) Atypical antipsychotics. Birkhauser, Basel, pp 121–142
- Ellenbroek BA, Cools AR (2002) Early maternal deprivation and prepulse inhibition: the role of the postdeprivation environment. Pharmacol Biochem Behav 73(1):177–184 [DOI] [PubMed]
- Ellenbroek BA, de Bruin NM, van Den Kroonenburg PT, van Luijtelaar EL, Cools AR (2004) The effects of early maternal deprivation on auditory information processing in adult Wistar rats. Biol Psychiatry 55(7):701–707 [DOI] [PubMed]
- Ellenbroek BA, Derks N, Park HJ (2005) Early maternal deprivation retards neurodevelopment in Wistar rats. Stress 8(4):247–257 [DOI] [PubMed]
- Eriksson PS, Perfilieva E, Bjork-Eriksson T, Alborn AM, Nordborg C, Peterson DA, Gage FH (1998) Neurogenesis in the adult human hippocampus. Nat Med 4(11):1313–1317 [DOI] [PubMed]
- Francis DD, Diorio J, Plotsky PM, Meaney MJ (2002) Environmental enrichment reverses the effects of maternal separation on stress reactivity. J Neurosci 22(18):7840–7843 [DOI] [PMC free article] [PubMed]
- Geyer M, Markou A (1995) Animal models of psychiatric disorders. In: Bloom F, Kupfer D (eds) Psychopharmacology: the fourth generation of progress. Raven Press, New York, pp 787–798
- Gould E, McEwen BS, Tanapat P, Galea LA, Fuchs E (1997) Neurogenesis in the dentate gyrus of the adult tree shrew is regulated by psychosocial stress and NMDA receptor activation. J Neurosci 17(7):2492–2498 [DOI] [PMC free article] [PubMed]
- Gould E, Reeves AJ, Fallah M, Tanapat P, Gross CG, Fuchs E (1999) Hippocampal neurogenesis in adult Old World primates. Proc Natl Acad Sci USA 96(9):5263–5267 [DOI] [PMC free article] [PubMed]
- Greisen MH, Altar CA, Bolwig TG, Whitehead R, Wortwein G (2005) Increased adult hippocampal brain-derived neurotrophic factor and normal levels of neurogenesis in maternal separation rats. J Neurosci Res 79(6):772–778 [DOI] [PubMed]
- Gundersen HJG, Jensen EB (1987) The efficiency of systematic sampling in stereology and its prediction. J Microsc 147(Pt 3):229–263 [DOI] [PubMed]
- Gundersen HJG, Bagger P, Bendtsen TF, Evans SM, Korbo L, Marcussen N, Moller A, Nielsen K, Nyengaard JR, Pakkenberg B (1988) The new stereological tools: disector, fractionator, nucleator and point sampled intercepts and their use in pathological research and diagnosis. APMIS 96(10):857–881 [DOI] [PubMed]
- Gundersen HJG, Jensen EB, Kieu K, Nielsen J (1999) The efficiency of systematic sampling in stereology-reconsidered. J Microsc 193(Pt 3):199–211 [DOI] [PubMed]
- Hall C (1934) Emotional behavior in the rat- Defecation and urination as measures of individual differences in emotionality. J Comp Psychology 18:385–403 [DOI]
- Holmes A, Wrenn CC, Harris AP, Thayer KE, Crawley JN (2002) Behavioral profiles of inbred strains on novel olfactory, spatial and emotional tests for reference memory in mice. Genes Brain Behav 1(1):55–69 [DOI] [PubMed]
- Inman-Wood SL, Williams MT, Morford LL, Vorhees CV (2000) Effects of prenatal cocaine on Morris and Barnes maze tests of spatial learning and memory in the offspring of C57BL/6J mice. Neurotoxicol Teratol 22(4):547–557 [DOI] [PubMed]
- Kempermann G, Kuhn HG, Gage FH (1997) More hippocampal neurons in adult mice living in an enriched environment. Nature 386(6624):493–495 [DOI] [PubMed]
- Kempermann G, Kuhn HG, Gage FH (1998) Experience-induced neurogenesis in the senescent dentate gyrus. J Neurosci 18(9):3206–3212 [DOI] [PMC free article] [PubMed]
- Kuhn HG,Dickinson-Anson H, Gage FH (1996) Neurogenesis in the dentate gyrus of the adult rat: age-related decrease of neuronal progenitor proliferation. J Neurosci 16(6):2027–2033 [DOI] [PMC free article] [PubMed]
- Lehmann J, Pryce CR, Bettschen D, Feldon J (1999) The maternal separation paradigm and adult emotionality and cognition in male and female Wistar rats. Pharmacol Biochem Behav 64(4):705–715 [DOI] [PubMed]
- Lemaire V, Koehl M, Le MM, Abrous DN (2000) Prenatal stress produces learning deficits associated with an inhibition of neurogenesis in the hippocampus. Proc Natl Acad Sci USA 97(20):11032–11037 [DOI] [PMC free article] [PubMed]
- Malberg JE, Eisch AJ, Nestler EJ, Duman RS (2000) Chronic antidepressant treatment increases neurogenesis in adult rat hippocampus. J Neurosci 20(24):9104–9110 [DOI] [PMC free article] [PubMed]
- Marenco S, Weinberger DR (2000) The neurodevelopmental hypothesis of schizophrenia: following a trail of evidence from cradle to grave. Dev Psychopathol 12(3):501–527 [DOI] [PubMed]
- Mirescu C, Peters JD, Gould E (2004) Early life experience alters response of adult neurogenesis to stress. Nat Neurosci 7(8):841–846 [DOI] [PubMed]
- Montgomery KC (1955) The relation between fear induced by novel stimulation and exploratory behavior. J Comp Physiol Psychol 48(4):254–260 [DOI] [PubMed]
- Parfitt DB, Levin JK, Saltstein KP, Klayman AS, Greer LM, Helmreich DL (2004) Differential early rearing environments can accentuate or attenuate the responses to stress in male C57BL/6 mice. Brain Res 1016(1):111–118 [DOI] [PubMed]
- Pihoker C, Owens MJ, Kuhn CM, Schanberg SM, Nemeroff CB (1993) Maternal separation in neonatal rats elicits activation of the hypothalamic–pituitary–adrenocortical axis: a putative role for corticotropin-releasing factor. Psychoneuroendocrinology 18(7):485–493 [DOI] [PubMed]
- Pilowsky LS, Kerwin RW, Murray RM (1993) Schizophrenia: a neurodevelopmental perspective. Neuropsychopharmacology 9(1):83–91 [DOI] [PubMed]
- Pellow S, Chopin P, File SE, Briley M (1985) Validation of open:closed arn entries in an elevated plus-maze as a measure of anxiety in the rat. J Neurosci Methods 14:149–167 [DOI] [PubMed]
- Plotsky PM, Meaney MJ (1993) Early, postnatal experience alters hypothalamic corticotropin-releasing factor (CRF) mRNA, median eminence CRF content and stress-induced release in adult rats. Brain Res Mol Brain Res 18(3):195–200 [DOI] [PubMed]
- Pompl PN, Mullan MJ, Bjugstad K, Arendash GW (1999) Adaptation of the circular platform spatial memory task for mice: use in detecting cognitive impairment in the APP(SW) transgenic mouse model for Alzheimer’s disease. J Neurosci Methods 87(1):87–95 [DOI] [PubMed]
- Raber J, Rola R, LeFevour A, Morhardt D, Curley J, Mizumatsu S, VandenBerg SR, Fike JR (2004) Radiation-induced cognitive impairments are associated with changes in indicators of hippocampal neurogenesis. Radiat Res 162(1):39–47 [DOI] [PubMed]
- Schapiro S, Geller E, Eiduson S (1962) Neonatal adrenal cortical response to stress and vasopressin. Proc Soc Exp Biol Med 109:937–941 [DOI] [PubMed]
- Schlessinger AR, Cowan WM, Gottlieb DI (1975) An autoradiographic study of the time of origin and the pattern of granule cell migration in the dentate gyrus of the rat. J Comp Neurol 159(2):149–175 [DOI] [PubMed]
- Schmidt M, Oitzl MS, Levine S, de Kloet ER (2002) The HPA system during the postnatal development of CD1 mice and the effects of maternal deprivation. Brain Res Dev Brain Res 139(1):39–49 [DOI] [PubMed]
- Schmidt M, Enthoven L, van der MM, Levine S, de Kloet ER, Oitzl MS (2003) The postnatal development of the hypothalamic–pituitary–adrenal axis in the mouse. Int J Dev Neurosci 21(3):125–132 [DOI] [PubMed]
- Tanapat P, Galea LA, Gould E (1998) Stress inhibits the proliferation of granule cell precursors in the developing dentate gyrus. Int J Dev Neurosci 16(3–4):235–239 [DOI] [PubMed]
- Tanapat P, Hastings NB, Rydel TA, Galea LA, Gould E (2001) Exposure to fox odor inhibits cell proliferation in the hippocampus of adult rats via an adrenal hormone-dependent mechanism. J Comp Neurol 437(4):496–504 [DOI] [PubMed]
- van den Buus M, Garner B, Koch M (2003) Neurodevelopmental animal models of schizophrenia: effects on prepulse inhibition. Curr Mol Med 3(5):459–471 [DOI] [PubMed]
- Weinberger DR (1987) Implications of normal brain development for the pathogenesis of schizophrenia. Arch Gen Psychiatry 44(7):660–669 [DOI] [PubMed]
- West MJ, Gundersen HJG (1990) Unbiased stereological estimation of the number of neurons in the human hippocampus. J Comp Neurol 296(1):1–22 [DOI] [PubMed]
- West MJ, Slomianka L, Gundersen HJG (1991) Unbiased stereological estimation of the total number of neurons in thesubdivisions of the rat hippocampus using the optical fractionator. Anat Rec 231(4):482–497 [DOI] [PubMed]
- Wigger A, Neumann ID (1999) Periodic maternal deprivation induces gender-dependent alterations in behavioral and neuroendocrine responses to emotional stress in adult rats. Physiol Behav 66(2):293–302 [DOI] [PubMed]
- Zhang J, McQuade JM, Vorhees CV, Xu M (2002) Hippocampal expression of c-fos is not essential for spatial learning. Synapse 46(2):91–99 [DOI] [PubMed]