Abstract
Lactic acid bacteria contribute to wine transformation during malolactic fermentation. They generally improve the sensorial properties of wine, but some strains produce histamine, a toxic substance that causes health issues. Histamine-producing strains belong to species of the genera Oenococcus, Lactobacillus, and Pediococcus. All carry an hdcA gene coding for a histidine decarboxylase that converts histidine into histamine. For this study, a method based on quantitative PCR and targeting hdcA was developed to enumerate these bacteria in wine. This method was efficient for determining populations of 1 to 107 CFU per ml. An analysis of 264 samples collected from 116 wineries of the same region during malolactic fermentation revealed that these bacteria were present in almost all wines and at important levels, exceeding 103 CFU per ml in 70% of the samples. Histamine occurred at an often important level in wines containing populations of the above-mentioned bacteria. Fifty-four colonies of histamine producers isolated from four wines were characterized at the genetic level. All were strains of Oenococcus oeni that grouped into eight strain types by randomly amplified polymorphic DNA analysis. Some strains were isolated from wines collected in distant wineries. Moreover, hdcA was detected on a large and possibly unstable plasmid in these strains of O. oeni. Taken together, the results suggest that the risk of histamine production exists in almost all wines and is important when the population of histamine-producing bacteria exceeds 103 per ml. Strains of O. oeni producing histamine are frequent in wine during malolactic fermentation, but they may lose this capacity during subcultures in the laboratory.
Lactic acid bacteria (LAB) used in food fermentation may produce histamine, a biogenic amine that accumulates in foods and causes diverse health issues when large quantities are ingested (28, 30, 31). Histamine results from the decarboxylation of the natural amino acid histidine catalyzed by a specific enzyme, the histidine decarboxylase (HDC). The gene hdcA coding for HDC is associated with other genes coding for a histidine/histamine exchanger and accessory proteins (14, 16). The coupled reactions of HDC and the exchanger promote the uptake of extracellular histidine, its conversion into histamine, the release of histamine and CO2 out of the cell, and importantly, the consumption of a cytoplasmic proton. The HDC pathway might help bacteria to regulate their cytoplasmic pH in acid environments or provide metabolic energy via the activity of the ATP synthase (19). LAB producing histamine (HDC+ LAB) belong to diverse species, but these species comprise both HDC+ and HDC− strains. In the HDC+ strain Lactobacillus hilgardii IOEB 0006, hdcA was detected on an unstable plasmid, which could explain the erratic phylogenetic distribution of HDC+ strains (14).
During winemaking, LAB are used to improve the organoleptic properties of wine, mainly by converting the malic acid that is present in grape juice and characterized by a strong acidic taste into the softer lactic acid (11). The conversion occurs during a phase of winemaking named malolactic fermentation, when the population of LAB in wine exceeds 106 CFU·ml−1. LAB growing in wine belong to the genera Lactobacillus, Pediococcus, Leuconostoc, and Oenococcus. The species Oenococcus oeni is generally predominant in wines undergoing spontaneous malolactic fermentation, i.e., fermentation performed by LAB naturally present in wine. O. oeni is also the species that is used industrially to inoculate wine in order to perform this fermentation under controlled conditions (11). Histamine is often detected in wines but at a rather low concentration compared to that of other fermented foods, such as cheese (29). However, wine contains alcohol and other substances that increase the toxicity of histamine. Therefore, the recommended upper limits of histamine in wine range from 1 to 10 mg·liter−1 (8). It is well established that histamine is produced by LAB during malolactic fermentation and the ensuing storage period (12, 14). Many HDC+ strains of the genera Oenococcus, Lactobacillus, and Pediococcus were isolated from wine, but it is still not well determined whether these bacteria are frequent and abundant or not during winemaking (2, 7, 9, 13, 20). The role of O. oeni in histamine formation is also unclear. Independent works suggest that HDC+ strains of this species are frequent or rare in wine, and they are considered either weak or strong histamine producers (2, 6, 7, 13, 20).
Real-time quantitative PCR (QPCR) is an efficient technique used to detect and count microorganisms in foods (for a review, see reference 27). During the past few years, diverse methods based on QPCR were proposed to determine populations of yeasts and bacteria in wine (3, 18, 21, 23, 24). Interestingly, a method was recently proposed to determine HDC+ LAB in cheese (4). The present study was initiated with the aim of analyzing the populations of HDC+ LAB present in wine during malolactic fermentation. A method involving QPCR was developed. It was used to analyze 264 samples collected in numerous wineries at the end of malolactic fermentation. Unexpectedly important populations of these undesirable bacteria, comprising between 103 and 107·ml−1, were often detected. The involved bacteria were characterized at the species and strain levels and a correlation was made between populations of HDC+ LAB and concentrations of histamine in wine.
MATERIALS AND METHODS
Bacteria, growth conditions, and identification.
LAB were isolated on agar-solidified de Man, Rogosa, and Sharpe (MRS) broth supplemented with 100 mg·liter−1 pimaricin at 25°C in an anaerobic atmosphere. LAB were propagated in liquid MRS broth. LAB species were identified by species-specific PCR tests using primers matching the rpoB gene (26). O. oeni strain typing was carried out by using multiplex randomly amplified polymorphic DNA (RAPD)-PCR (25). Eight HDC+ O. oeni strains isolated during this work, designated strains A to H, were stored in the IOEB collection under reference numbers IOEB 0605 to IOEB 0612, respectively.
Wine samples.
All of the 264 samples used in this study were red wines produced in 116 wineries of the Bordeaux, France, area during the 2005 vintage. They were collected at or close to the end of the malolactic fermentation, before SO2 was added. Usually commercial starters are not used for malolactic fermentation in these wines, but this information was not known for some wines.
DNA purification.
Genomic DNA of bacteria grown in MRS broth was prepared by using the Wizard genomic DNA purification kit (Promega) according to the manufacturer's instructions. DNA of microorganisms present in wine was purified by a previously reported method (5) that was modified as follows. Microorganisms of a 10-ml sample of wine were collected by centrifugation at 5,300 × g for 15 min. The pellet was washed once with 1 ml of Tris-EDTA buffer (10 mM Tris hydrochloride [pH 8.0], 1 mM EDTA) and resuspended in 300 μl of the same buffer. Cells were disrupted with 200 μl of 0.1-mm-diameter glass beads in a FastPrep FP120 instrument (MP Biomedicals) used at a power level of 6.5 during five cycles of a 45-s disruption interspaced with 1 min of cooling at 4°C. The cell lysate was mixed with 300 μl of nucleus lysis solution and 200 μl of protein precipitation solution from the Wizard genomic DNA purification kit (Promega) and kept on ice for 5 min. Cell debris and proteins were precipitated by centrifugation for 3 min at 10,000 × g. A volume of 600 μl of supernatant was mixed with 100 μl of 10% polyvinylpyrrolidone molecular-grade solution (Sigma) and centrifuged for 10 min at 10,000 × g. The supernatant was collected and nucleic acids were precipitated in the presence of isopropanol. The DNA pellet was washed once with 70% ethanol, dried, and dissolved in 20 μl of sterile water.
QPCR assay.
Primers hdcAf (5′-ATGAAGCCAGGACAAGTTGG) and hdcAr (5′-AATTGAGCCACCTGGAATTG) were designed on the basis of the sequences of hdcA genes from O. oeni IEOB 9204, Lactobacillus hilgardii IOEB 0006, Lactobacillus sakei LTH 2076, Lactobacillus strain 30A, Lactobacillus buchneri DSM 5987, and Tetragenococcus muriaticus LMG 18498 that were available from databases. This primer set amplifies an 84-bp internal region of hdcA. Amplification and detection were performed with 20-μl reaction mixtures containing 10 pmol of each primer, 1 μl of DNA template prepared as mentioned above, and 10 μl of a 2× concentration of iQ Sybr green supermix (Bio-Rad) using an iCycler system (Bio-Rad). Amplification conditions were 5 min at 95°C, followed by 40 cycles of 95°C for 30 s, 55°C for 30 s, and 72°C for 30 s. The baseline and cycle threshold (CT) were automatically calculated. A melt curve analysis was performed with the same equipment after the completion of QPCR. Samples were heated from 65°C to 95°C in 0.5°C increments. The melting temperature of the samples was automatically determined.
Colony hybridization.
Detection of HDC+ LAB colonies was carried out by colony hybridization as previously described (10). The probe used for hybridization was a mixture of equivalent amounts of PCR products obtained using primers hdc3 and hdc4 specific for a 437-bp fragment of the hdcA gene (14) and genomic DNA of the HDC+ strains O. oeni IOEB 9204, L. hilgardii IOEB 0006, Lactobacillus buchneri DSM 5987, and Lactobacillus strain 30A. The probe was labeled with digoxigenin-11-UTP by using the DIG DNA labeling kit (Roche), and detection was performed by chemiluminescence with an antidigoxigenin antibody and CDP-Star reagent (Roche).
PFGE and Southern blotting.
Bacteria grown in MRS broth up to the exponential phase were collected by centrifugation, washed twice in Tris-EDTA buffer, resuspended in the same buffer adjusted to 100 mM EDTA (T100E), and embedded in 1% agarose slices. The bacteria were incubated at 37°C for 8 h in T100E containing 10 mg·ml−1 lysozyme and incubated for 16 h in T100E supplemented with 1.5% N-lauryl sarcosine and 2 mg·ml−1 pronase. NotI digestions were performed by incubating agarose slices at 25°C for 16 h in the presence of 30 U of the enzyme (New England Biolabs). Pulsed-field gel electrophoresis (PFGE) was carried out in a 1% agarose gel with the CHEF-DR III system (Bio-Rad) with pulse times of 1 to 25 s for 20 h at 6 V/cm and 15°C in 45 mM Tris, 45 mM boric acid, and 1 mM EDTA (pH 8). DNA fragments were transferred onto a Hybond-N+ membrane and hybridized with an hdcA probe as described previously.
Determination of biogenic amines.
Aliquots of wines were centrifuged for 10 min at 10,000 × g. Supernatants were collected, filtered through a 0.2-μm filter (Millipore), derivatized on a precolumn with o-phthaldialdehyde, and separated by reverse-phase high-performance liquid chromatography (HPLC) on a Waters Nova-Pak C18 column according to reference 22.
RESULTS
QPCR method for determination of HDC+ LAB in wine.
The nucleotide sequences of hdcA genes from diverse LAB were aligned to identify conserved regions and to design PCR primers specific for these genes. The alignment included hdcA genes of two strains isolated from wine, O. oeni IOEB 9204 and L. hilgardii IOEB 0006, and hdcA genes from the following strains originating from cheese, sauerkraut, squid liver sauce, and horse intestines: Lactobacillus buchneri DSM 5987, Lactobacillus sakei LTH 2076, Tetragenococcus muriaticus LMG 18498, and Lactobacillus strain 30A, respectively. The selected primers bordered an 84-bp DNA region that was the same for L. hilgardii, O. oeni, L. sakei, and T. muriaticus and slightly divergent for the two other species. Preliminary QPCR assays were carried out using genomic DNA of L. hilgardii IOEB 0006 as a template. Optimal QPCR conditions allowed amplification of a PCR product with a melting temperature of 80.5°C ± 0.5°C. The same product was obtained using genomic DNA of other HDC+ strains, while no unspecific amplification was detected in the presence of genomic DNA from HDC− bacteria (not shown).
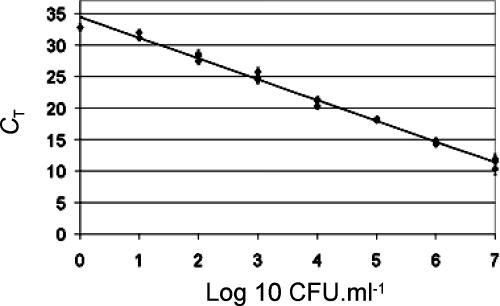
A previously described procedure was used to prepare DNA of microorganisms present in wine (5). Some modifications were made in order to purify the microbial DNA from a 10-ml sample of wine and to obtain a DNA fraction free of wine compounds inhibiting PCR, such as polyphenols. The sensitivity and the efficiency of the QPCR assay were determined by using DNA extracted from nine freshly prepared samples containing 10 ml of filter-sterilized wine, 108·ml−1 cells of the yeast Saccharomyces cerevisiae, and serial dilutions of cells of HDC+ L. hilgardii IOEB 0006 (107·ml−1 to 1·ml−1, plus a control without HDC+ cells). The addition of yeasts was used not only to mimic yeast lees present in wine during malolactic fermentation but also to help precipitate the bacteria and to provide a large amount of DNA acting as a carrier during bacterial DNA preparation. Microbial DNA of the nine samples was purified and tested in QPCR. The eight reaction mixtures corresponding to samples containing HDC+ cells produced detectable amplification products and measurable CTs (Fig. 1). The presence of as few as 1 HDC+ cell per ml of wine was detected. In contrast, no amplification occurred in the control reaction performed without HDC+ cells. To determine the efficiency of the method, the measured CT values were plotted against the concentrations of HDC+ bacteria initially present (Fig. 1). A linear relationship was obtained for LAB populations ranging from 1 to 107·ml−1. Therefore, coupling the QPCR assay with the optimized DNA extraction procedure allowed us to determine efficiently populations of HDC+ LAB.
FIG. 1.
QPCR standard curve obtained with DNA of HDC+ cells serially diluted in sterile wine supplemented with yeasts. CT values are averages of results from three replicates. The coefficient of correlation (R2) was 0.996.
Validation of the method with environmental samples.
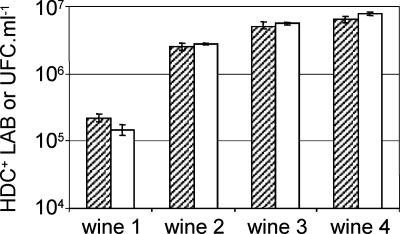
To validate the QPCR method, the populations of HDC+ LAB in wines were determined and the results were compared with enumerations performed by colony hybridization. The analyzed samples were red wines collected from several wineries during malolactic fermentation when the population of LAB is above 106·ml−1. Determinations carried out by QPCR disclosed some wines containing apparently more than 105·ml−1 histamine-producing bacteria (see below). Those wines were preferred for colony hybridization experiments given that the sensibility of this technique requires at least 104·ml−1 target bacteria to be present in samples containing 106·ml−1 total LAB (at least 1 positive colony on a plate containing 100 colonies of LAB). Aliquots of four wines were spread on plates to grow LAB. Plates containing 100 to 300 colonies were used for colony hybridization with a DNA probe specific for the gene hdcA. The populations of HDC+ LAB determined by this method and by QPCR were compared (Fig. 2). Both strategies disclosed very similar populations of HDC+ LAB, ranging from 3 × 10⁵·ml−1 in wine 1 up to 8 × 10⁶·ml−1 in wine 4, indicating that the method based on QPCR could be employed to determine the presence of HDC+ LAB in wines.
FIG. 2.
Comparison of results obtained by QPCR and colony hybridization. The populations of HDC+ LAB present in four wines were determined by QPCR (hatched bars) and colony hybridization (empty bars) using a DNA probe specific for the gene hdcA. QPCR data are the means of three replicates.
Presence of HDC+ LAB in wines.
The QPCR method was used to analyze 264 wines of the 2005 vintage. All were red wines collected during malolactic fermentation. They originated from 116 wineries distributed in a 3,500-km2 area around Bordeaux. Up to 20 samples were from the same winery, but they all originated from different tanks. Microbial DNA was purified and the presence of HDC+ LAB was investigated by QPCR. Unexpectedly, HDC+ bacteria were detected in more than 97% of the samples at concentrations ranging from 1 to more than 106·ml−1 (Table 1). Only 7 out of the 264 samples were apparently free of these bacteria, or at least they contained less than 1 HDC+ cell per ml. Important HDC+ LAB populations above 103·ml−1 were found in 70% of the wines, which include very important populations exceeding 105·ml−1 in 18% of the wines. The total population of LAB in some samples was determined by plating or by QPCR using the WLAB primers (21). QPCR revealed generally larger LAB populations than did plating, but with both methods they were in the same range of 107 to 108·ml−1 (not shown). This allowed us to calculate that histamine producers represented up to 13% or 34% of the LAB detected during malolactic fermentation (as determined by QPCR or plating, respectively).
TABLE 1.
Populations of HDC+ LAB detected in 264 wines by QPCR
| No. of HDC+ LAB/ml | Wines with indicated HDC+ LAB population
|
|
|---|---|---|
| No. | % of total | |
| Undetected | 7 | 2.7 |
| 1-10 | 23 | 8.7 |
| 10-102 | 21 | 8.0 |
| 102-103 | 30 | 11.4 |
| 103-104 | 66 | 25.0 |
| 104-105 | 69 | 26.1 |
| 105-106 | 35 | 13.3 |
| >106 | 13 | 4.9 |
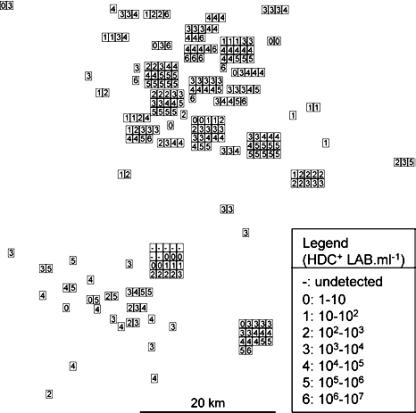
The measured HDC+ LAB populations were plotted on a map to compare them based on the geographic origins of the wines (Fig. 3). In this representation, values corresponding to wines of the same local site were grouped together. In some production sites, the populations of HDC+ bacteria in all the wines were quite similar, but in other sites they varied considerably. Therefore, there was no obvious correlation between the production areas and the populations of HDC+ LAB in wines.
FIG. 3.
Populations of HDC+ LAB determined by QPCR for 264 wines collected during malolactic fermentation in 116 wineries of the Bordeaux area. Each number represents the HDC+ LAB population measured in a wine as described on the figure (“Legend”). They were positioned according to their site of production and grouped together when they were from the same local site.
Identification of HDC+ LAB.
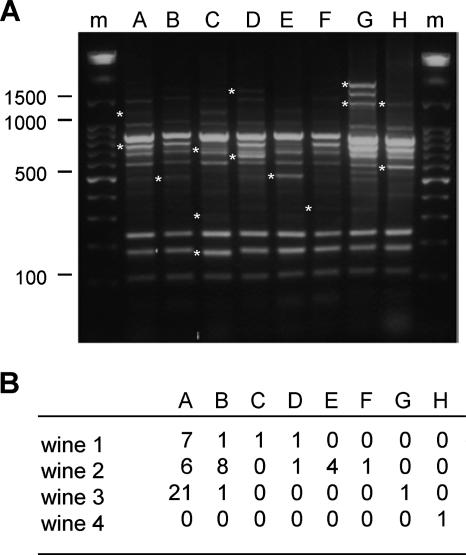
To characterize the HDC+ LAB detected by QPCR, aliquots of wines were plated on a medium to grow LAB colonies, and the histamine producers were detected by colony hybridization. Four wines originating from four distant wineries were analyzed. All the colonies that appeared on the plates had a similar aspect. Detection of those corresponding to HDC+ LAB was performed by DNA hybridization with the hdcA probe. A total of 54 HDC+ colonies, representing 1 to 23 HDC+ colonies per wine, were analyzed. The presence of hdcA in these bacteria was confirmed by PCR (not shown). The 54 colonies were analyzed by a PCR-based method to determine the species (26). All were O. oeni (not shown). A multiplex RAPD-PCR strategy was used to determine if they represented only one or several strains. Eight different patterns were detected, indicating the presence of eight different strains, named A to H (Fig. 4A). Strain A was the most abundant. It was detected in three wines and comprised more than 52% of all the HDC+ colonies (Fig. 4B). Strains B and D were detected in three and two wines, respectively, whereas each of the five other strains was associated with only one wine. Each wine contained one to five different HDC+ strains.
FIG. 4.
Identification of eight HDC+ O. oeni strains by RAPD analysis (A) and frequency of these strains in four wines (B). Fifty-four bacterial colonies that hybridized with an hdcA probe were analyzed by RAPD analysis. The eight different RAPD patterns (named A to H) obtained for the 54 colonies are shown. Stars indicate some specific bands. The DNA marker was a 1-kb ladder (Promega) (lanes m).
Genetic localization of hdcA.
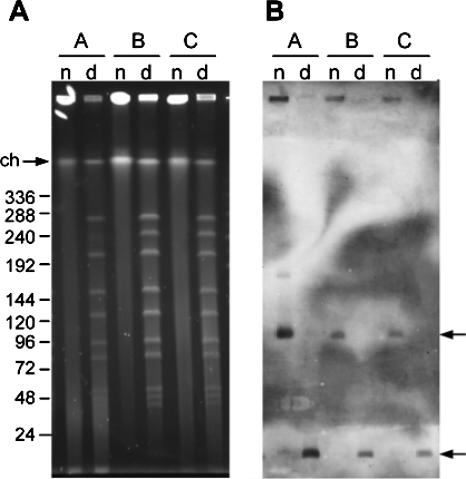
HDC+ O. oeni strains were analyzed to determine the genomic localization of their hdcA gene. The strains were grown in MRS medium and incorporated into agarose plugs that were divided into two equivalent parts. One part of each plug was submitted to DNA digestion by NotI, while the other part was kept undigested. The obtained DNA fragments were separated by PFGE, transferred onto a nitrocellulose filter, and hybridized with a probe specific for hdcA. No signal of hybridization was detected with five of the eight strains analyzed (not shown). In contrast, the hdcA probe hybridized with the DNA of strains A, B, and C (Fig. 5B). The same hybridization pattern was obtained in all three cases. In lanes containing undigested DNA, a band of 100 kb was hybridized but not the band corresponding to the native chromosome (Fig. 5A and B). After NotI digestion, the probe revealed a smaller band of less than 20 kb (Fig. 5B). These hybridization patterns indicated that hdcA was not located on the chromosome of the strains but rather on a large plasmid.
FIG. 5.
Determination of the genetic localization of the gene hdcA in three strains of O. oeni (A, B, and C) by PFGE (A) and Southern blotting (B). Native (n) and NotI-digested (d) genomic DNA of three HDC+ O. oeni strains was separated by PFGE prior to transfer to a nitrocellulose filter and hybridization with a probe specific for hdcA. The sizes of the DNA standards are shown on the left of the figure. Arrows indicate the positions of native chromosomal DNA (ch) and hybridization signals of 100 kb and less than 20 kb.
HDC+ LAB populations and histamine concentrations.
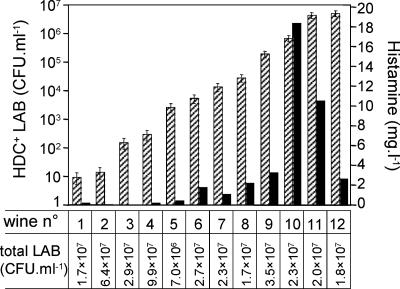
Histamine concentrations were determined by HPLC in 12 wines at the end of malolactic fermentation. According to plate counts, they had similar populations of LAB, ranging from 6.4 × 10⁶·ml−1 to 9.9 × 10⁷·ml−1. In contrast, populations of HDC+ LAB determined by QPCR varied from 13 to 6.3 × 10⁶·ml−1 in these wines (Fig. 6). Levels of histamine in the range of 1 to 18 mg·liter−1 were detected in seven wines; all contained more than 103·ml−1 HDC+ LAB (Fig. 6). The other wines in which HDC+ LAB ranged from 13 to 103·ml−1 contained very low or undetectable levels of histamine (Fig. 6). Interestingly, wine 12, characterized by the highest HDC+ population, contained a rather low concentration of histamine (2.7 mg·liter−1). These results suggested that histamine levels above the recommended limit of 1 mg·liter−1 could appear when the population of HDC+ LAB exceeded 103·ml−1 and that higher populations of histamine producers were not directly related to higher levels of histamine.
FIG. 6.
Comparison of histamine concentrations (filled bars) and HDC+ LAB populations (hatched bars) determined in 12 wines by HPLC analysis and QPCR, respectively. Populations of total LAB were determined by enumeration on plates.
DISCUSSION
Enumeration of HDC+ LAB in wine to evaluate the risk of histamine spoilage.
A method based on QPCR was developed to detect and count HDC+ LAB in wine. This method makes it possible to detect as few as 1 HDC+ cell per ml of wine, even in the presence of polyphenols or of a large excess of yeasts in wine. Although the method was based on a standard curve made with L. hilgardii DNA, it is assumed that it was efficient to enumerate HDC+ O. oeni cells given that (i) the DNA regions targeted by the selected primers were identical in these LAB, (ii) determination of HDC+ O. oeni cells in four samples by QPCR and colony hybridization provided identical counts (Fig. 2), and (iii) standard curves made using a dilution of DNA prepared from HDC+ O. oeni or L. hilgardii were very similar (not shown). Previous QPCR methods used to enumerate LAB in wine were significantly less sensitive (3, 21). It is likely that optimizing the procedure used to prepare microbial DNA from wine samples helped to lower the detection limit of the method. The CT values obtained with standard samples correlated well with populations of HDC+ LAB in the range of 1 to 107 CFU·ml−1. Given that the maximum population of LAB expected in wine is 106 to 107 cells·ml−1 during malolactic fermentation, the method could be employed to count HDC+ LAB at any stage of winemaking.
An analysis of 264 wines collected in numerous wineries of the Bordeaux area during malolactic fermentation revealed that almost all wines were contaminated by HDC+ LAB. Previous work performed by PCR to detect these bacteria in a collection of 118 wines suggested that they were present in approximately 50% of the samples (2). It is possible that this proportion was underestimated given that PCR is generally much less sensitive than QPCR. Nevertheless, both studies are consistent and indicate that HDC+ LAB are very frequent in wines. In fact, according to QPCR, they are present in almost all wines during malolactic fermentation. However, populations of HDC+ LAB vary considerably. They represent only a few cells per ml in some samples and more than 106 per ml in others. It is usually considered that undesirable LAB may produce alterations in wine when their population reaches 103·ml−1 or more (11). QPCR revealed that nearly 70% of the wines contained HDC+ populations above this level during malolactic fermentation. Determination of histamine concentrations in some wines showed that almost all of those containing more than 103·ml−1 HDC+ LAB also contained more than 1 mg·liter−1 histamine. In contrast, histamine levels were negligible in wines with lower HDC+ populations. Therefore, 103 HDC+ LAB·ml−1 could be considered the upper limit above which the risk of histamine accumulation becomes important.
Interestingly, in wines containing more than 103·ml−1 HDC+ LAB, the production of histamine is not proportional to the population of HDC+ LAB. For instance, 6.5 × 10⁶ HDC+ LAB per ml produced only 2.5 mg·liter−1 histamine, compared to the 18.2 mg·liter−1 produced in another wine containing 8.7 × 10⁵ HDC+ LAB per ml. It is important to note that the QPCR assay proposed here does not discriminate between live and dead cells nor between functional genes and pseudogenes. The results suggest that the limiting factor for histamine production in most wines is not the population of HDC+ LAB. Therefore, the determination of the HDC+ LAB population would not allow the prediction of the final concentration of histamine in wine. However, it could help to predict the risk of histamine spoilage given that populations of HDC+ LAB only above 103·ml−1 produce concentrations of histamine exceeding the recommended upper limit in wine. Among the other factors possibly involved in the accumulation of histamine, the concentration of the amino acid precursor, histidine, is probably important (15). Histamine production seems to increase with the use of winemaking techniques such as maceration with grape skins or yeast lees (13, 17). It is likely that these techniques contribute to an increase in the concentration of histidine in wine, which can in turn be converted to histamine by HDC+ LAB.
Recurrence of HDC+ O. oeni strains during malolactic fermentation.
The HDC+ bacteria isolated from wine until now belong to many species, including O. oeni, L. hilgardii, Lactobacillus mali, Leuconostoc mesenteroides, and Pediococcus parvulus (7, 8, 14, 20). Therefore, it was unexpected to find that all of the 54 HDC+ colonies analyzed in this study were strains of the same species, O. oeni. This result suggests that HDC+ O. oeni bacteria are frequently present at high populations during malolactic fermentation. The predominance of this species is well supported by previous findings: (i) O. oeni becomes predominant during spontaneous malolactic fermentation and is often the only species detected at this stage (11), (ii) a large proportion (25% to 60%) of strains with the capacity to produce histamine exist in the species O. oeni (6, 7), and (iii) the dominance of HDC+ bacteria of the species O. oeni during malolactic fermentation is a possibility (2). Interestingly, this study revealed that a few strains of HDC+ O. oeni were present in diverse wines produced at distant sites. These strains were probably propagated in the vineyard before that grape was harvested or in the wine at the very beginning of winemaking. Dissemination of a limited number of strains in the wineries of a region followed by spontaneous malolactic fermentations could explain why these strains are frequent and abundant in wines during malolactic fermentation. However, it must be noted that these results were obtained for wines of the same region and collected during the same vintage. It remains to be determined whether the results repeat for other regions and vintages.
Localization of hdcA and instability of the HDC+ phenotype.
The detection of many HDC+ O. oeni strains in environmental samples contrasts with the low abundance of these strains in laboratory collections of wine LAB (1, 20). In our collection, which comprises several hundred O. oeni strains, only two scored positive in a PCR test specific for hdcA (unpublished results). The results reported here suggest that this situation results from the genetic localization of hdcA. Indeed, in three O. oeni strains, the gene was detected on a large plasmid of a size supposed to be 100 kb. In a previous work, hdcA was detected on an 80-kb plasmid in the HDC+ strain L. hilgardii IOEB 0006 isolated from wine (14). This plasmid was unstable and was rapidly lost during bacterial cultures. Similarly, if the O. oeni plasmid containing hdcA was unstable, then HDC+ strains could be easily converted into HDC− strains during subcultures of the bacteria in laboratory. This could explain some surprising experimental results, such as the low abundance of HDC+ strains in laboratory collections in contrast to the high frequency of these strains in environmental samples (2, 13, 20). Interestingly, a previous work has reported that HDC+ O. oeni strains were unstable during subcultures in laboratory-defined media (13). It remains to be determined if this instability actually results from the loss of the plasmid carrying hdcA.
Acknowledgments
We are grateful to M.-C. Perello and G. de Revel for their contributions and acknowledge the Chambre d'Agriculture de la Gironde and the Centres Oenologiques de Cadillac-Podensac et de Coutras for providing samples.
This work was supported by the European Commission (contract number QLK1-CT-2002-02388).
Footnotes
Published ahead of print on 7 December 2007.
REFERENCES
- 1.Costantini, A., M. Cersosimo, V. Del Prete, and E. Garcia-Moruno. 2006. Production of biogenic amines by lactic acid bacteria: screening by PCR, thin-layer chromatography, and high-performance liquid chromatography of strains isolated from wine and must. J. Food Prot. 69:391-396. [DOI] [PubMed] [Google Scholar]
- 2.Coton, E., G. Rollan, A. Bertrand, and A. Lonvaud-Funel. 1998. Histamine-producing lactic acid bacteria in wines: early detection, frequency, and distribution. Am. J. Enol. Vitic. 49:199-204. [Google Scholar]
- 3.Delaherche, A., O. Claisse, and A. Lonvaud-Funel. 2004. Detection and quantification of Brettanomyces bruxellensis and ‘ropy’ Pediococcus damnosus strains in wine by real-time polymerase chain reaction. J. Appl. Microbiol. 97:910-915. [DOI] [PubMed] [Google Scholar]
- 4.Fernández, M., B. del Río, D. M. Linares, M. C. Martín, and M. A. Alvarez. 2006. Real-time polymerase chain reaction for quantitative detection of histamine-producing bacteria: use in cheese production. J. Dairy Sci. 89:3763-3769. [DOI] [PubMed] [Google Scholar]
- 5.Gindreau, E., E. Walling, and A. Lonvaud-Funel. 2001. Direct polymerase chain reaction detection of ropy Pediococcus damnosus strains in wine. J. Appl. Microbiol. 90:535-542. [DOI] [PubMed] [Google Scholar]
- 6.Guerrini, S., S. Mangani, L. Granchi, and M. Vincenzini. 2002. Biogenic amine production by Oenococcus oeni. Curr. Microbiol. 44:374-378. [DOI] [PubMed] [Google Scholar]
- 7.Landete, J. M., S. Ferrer, and I. Pardo. 2005. Which lactic acid bacteria are responsible for histamine production in wine? J. Appl. Microbiol. 99:580-586. [DOI] [PubMed] [Google Scholar]
- 8.Lehtonen, P. 1996. Determination of amines and amino acids in wine—a review. Am. J. Enol. Vitic. 47:127-133. [Google Scholar]
- 9.Le Jeune, C., A. Lonvaud-Funel, B. ten Brink, H. Hofstra, and J. M. B. M. van der Vossen. 1995. Development of a detection system for histidine decarboxylating lactic acid bacteria based on DNA probes, PCR and activity test. J. Appl. Bacteriol. 78:316-326. [DOI] [PubMed] [Google Scholar]
- 10.Lonvaud-Funel, A., C. Fremaux, N. Biteau, and A. Joyeux. 1991. Speciation of lactic acid bacteria from wines by hybridization with DNA probes. Food Microbiol. 8:215-222. [Google Scholar]
- 11.Lonvaud-Funel, A. 1999. Lactic acid bacteria in the quality improvement and depreciation of wine. Antonie van Leeuwenhoek 76:317-331. [PubMed] [Google Scholar]
- 12.Lonvaud-Funel, A. 2001. Biogenic amines in wines: role of lactic acid bacteria. FEMS Microbiol. Rev. 199:9-13. [DOI] [PubMed] [Google Scholar]
- 13.Lonvaud-Funel, A., and A. Joyeux. 1994. Histamine production by wine lactic acid bacteria: isolation of a histamine-producing strain of Leuconostoc oenos. J. Appl. Bacteriol. 77:401-407. [DOI] [PubMed] [Google Scholar]
- 14.Lucas, P. M., W. A. Wolken, O. Claisse, J. S. Lolkema, and A. Lonvaud-Funel. 2005. Histamine-producing pathway encoded on an unstable plasmid in Lactobacillus hilgardii 0006. Appl. Environ. Microbiol. 71:1417-1424. [DOI] [PMC free article] [PubMed] [Google Scholar]
- 15.Marcobal, A., P. J. Martin-Alvarez, M. C. Polo, R. Munoz, and M. V. Moreno-Arribas. 2005. Formation of biogenic amines throughout industrial red wine manufacture. J. Food Prot. 69:397-404. [DOI] [PubMed] [Google Scholar]
- 16.Martin, M. C., M. Fernandez, D. M. Linares, and M. A. Alvarez. 2005. Sequencing, characterization and transcriptional analysis of the histidine decarboxylase operon of Lactobacillus buchneri. Microbiology 151:1219-1228. [DOI] [PubMed] [Google Scholar]
- 17.Martin-Alvarez, P. J., A. Marcobal, C. Polo, and M. V. Moreno-Arribas. 2006. Influence of technological practices on biogenic amine contents in red wines. Eur. Food Res. Technol. 222:420-424. [Google Scholar]
- 18.Martorell, P., A. Querol, and M. T. Fernández-Espinar. 2005. Rapid identification and enumeration of Saccharomyces cerevisiae cells in wine by real-time PCR. Appl. Environ. Microbiol. 71:6823-6830. [DOI] [PMC free article] [PubMed] [Google Scholar]
- 19.Molenaar, D., J. S. Bosscher, B. ten Brink, A. J. M. Driessen, and W. N. Konings. 1993. Generation of a proton motive force by histidine decarboxylation and electrogenic histidine/histamine antiport in Lactobacillus buchneri. J. Bacteriol. 175:2864-2870. [DOI] [PMC free article] [PubMed] [Google Scholar]
- 20.Moreno-Arribas, M. V., M. C. Polo, F. Jorganes, and R. Munoz. 2003. Screening of biogenic amine production by lactic acid bacteria isolated from grape must and wine. Int. J. Food Microbiol. 84:117-123. [DOI] [PubMed] [Google Scholar]
- 21.Neeley, E. T., T. G. Phister, and D. A. Mills. 2005. Differential real-time PCR assay for enumeration of lactic acid bacteria in wine. Appl. Environ. Microbiol. 71:8954-8957. [DOI] [PMC free article] [PubMed] [Google Scholar]
- 22.Pereira Monteiro, M. J., and A. Bertrand. 1994. Validation d'une méthode de dosage. Application à l'analyse des amines biogènes du vin. Bull. Int. Org. Vine Wine 765:916-962. [Google Scholar]
- 23.Phister, T. G., and D. A. Mills. 2003. Real-time PCR assay for detection and enumeration of Dekkera bruxellensis in wine. Appl. Environ. Microbiol. 69:7430-7434. [DOI] [PMC free article] [PubMed] [Google Scholar]
- 24.Pinzani, P., L. Bonciani, M. Pazzagli, C. Orlando, S. Guerrini, and L. Granchi. 2004. Rapid detection of Oenococcus oeni in wine by real-time quantitative PCR. Lett. Appl. Microbiol. 38:118-124. [DOI] [PubMed] [Google Scholar]
- 25.Reguant, C., and A. Bordons. 2003. Typification of Oenococcus oeni strains by multiplex RAPD-PCR and study of population dynamics during malolactic fermentation. J. Appl. Microbiol. 95:344-353. [DOI] [PubMed] [Google Scholar]
- 26.Renouf, V., O. Claisse, and A. Lonvaud-Funel. 2006. rpoB gene: a target for identification of LAB cocci by PCR-DGGE and melting curves analyses in real time PCR. J. Microbiol. Methods 67:162-170. [DOI] [PubMed] [Google Scholar]
- 27.Rudi, K., H. K. Nogva, B. Moen, H. Nissen, S. Bredholt, T. Møretrø, K. Naterstad, and A. Holck. 2002. Development and application of new nucleic acid-based technologies for microbial community analyses in foods. Int. J. Food Microbiol. 78:171-180. [DOI] [PubMed] [Google Scholar]
- 28.Silla Santos, M. H. 1996. Biogenic amines: their importance in foods. Int. J. Food Microbiol. 29:213-231. [DOI] [PubMed] [Google Scholar]
- 29.Stratton, J. E., R. W. Hutkins, and S. L. Taylor. 1991. Biogenic amines in cheese and other fermented foods: a review. J. Food Prot. 54:460-470. [DOI] [PubMed] [Google Scholar]
- 30.Sumner, S. S., M. W. Speckhard, E. B. Somers, and S. L. Taylor. 1985. Isolation of histamine-producing Lactobacillus buchneri from Swiss cheese implicated in a food poisoning outbreak. Appl. Environ. Microbiol. 50:1094-1096. [DOI] [PMC free article] [PubMed] [Google Scholar]
- 31.ten Brink, B., C. Damink, H. M. L. J. Joosten, and J. H. J. Huis in't Veld. 1990. Occurrence and formation of biologically active amines in foods. Int. J. Food Microbiol. 11:73-84. [DOI] [PubMed] [Google Scholar]


