

Abstract
Glioma cells prominently express a unique splice variant of a large conductance, calcium-activated potassium channel (BK channel). These channels transduce changes in intracellular calcium to changes of K+ conductance in the cells and have been implicated in growth control of normal and malignant cells. The Ca2+ increase that facilitates channel activation is thought to occur via activation of intracellular calcium release pathways or influx of calcium through Ca2+-permeable ion channels. We show here that BK channel activation involves the activation of inositol 1,4,5-triphosphate receptors (IP3R), which localize near BK channels in specialized membrane domains called lipid rafts. Disruption of lipid rafts with methyl-β-cyclodextrin disrupts the functional association of BK channel and calcium source resulting in a >50% reduction in K+ conductance mediated by BK channels. The reduction of BK current by lipid raft disruption was overcome by the global elevation of intracellular calcium through inclusion of 750 nm Ca2+ in the pipette solution, indicating that neither the calcium sensitivity of the channel nor their overall number was altered. Additionally, pretreatment of glioma cells with 2-aminoethoxydiphenyl borate to inhibit IP3Rs negated the effect of methyl-β-cyclodextrin, providing further support that IP3Rs are the calcium source for BK channels. Taken together, these data suggest a privileged association of BK channels in lipid raft domains and provide evidence for a novel coupling of these Ca2+-sensitive channels to their second messenger source.
Gliomas are primary brain malignancies that derive from glial cells. These tumors are characterized by extensive cell migration and diffuse infiltration of normal brain making surgical removal almost impossible. Accumulating evidence indicates that glioma migration is supported by the activity of K+ and Cl− channels (1–5). Specifically, ion flux through Cl− and K+ channels along with obligated water is presumed to cause the profound changes in cell shape and cell volume as cells invade. In this vein, our laboratory, as well as others, has attempted to identify and characterize the underlying ion channels involved in this process. This led us to the molecular cloning of a novel large conductance calcium-activated K+ (BK) channel that is uniquely expressed in glioma cells and particularly up-regulated in highly invasive grade IV gliomas (6).
A unique feature of BK channels is the ability to be activated by two independent stimuli, namely membrane voltage and the intracellular second messenger Ca2+, whereas typical K+ channels are gated by voltage alone. Hence cell volume changes are likely to result from the activation of BK channels via changes in intracellular [Ca2+]. In the absence of large increases in [Ca2+]i, BK channel activation requires very large depolarization of the membrane (approximately +80 mV), which is expected to be an uncommon occurrence in a nonexcitable cell such as a glioma cell. However, raising [Ca2+]i from a resting level of ~100 nm (7, 8) to the low micromolar range results in BK channel activation at the normal resting membrane potential for these cells (−40 mV (9)). Physiological conditions that raise Ca2+ throughout the cell sufficiently to activate glioma BK channels yet without compromising other Ca2+-dependent processes are difficult to envision. One way to solve this problem is by localizing BK channels in close proximity to a Ca2+ source, i.e. a Ca2+ channel, Ca2+-permeable receptor, or intracellular release pathway. Such a privileged association may be achieved through direct protein-protein interactions as has been demonstrated in rat brain where BK channels are linked to L-type voltage-gated calcium channels (10). Alternatively, privileged associations may occur through localization to membrane microdomains. Microdomains can be established through specialized membrane patches in the plasma membrane enriched in cholesterol and sphingolipids, and these are called lipid rafts (11). The existence of such raft domains within the plasma membrane and the idea that microdomains within the plasma membrane are suitable for the assembly of signaling complexes are now well accepted (for review see Ref. 12). Lipid rafts have been demonstrated to participate in protein trafficking and the assembly of signaling complexes, and indeed, a number of ion channels have been shown to localize to lipid raft domains. These include, for example, cardiac pacemaker channels, KCa channels, L-type voltage-gated calcium channels, Kv, Kir, as well as Na+ channels, and in most instances, channel association with lipid rafts directly affects the biophysical properties of these channels (13–15). Similarly, KCa, KATP, P2X receptors, cyclic nucleotide-gated channels, and transient receptor potential channels (TRPC)2 all localize to lipid rafts as part of signaling complexes (16–19).
In light of these findings and a hypothesized requirement for glioma BK channels to localize closely to a source for Ca2+ entry or release, we set out to investigate whether BK channels in glioma cells may localize to microdomains and whether these may be established by lipid rafts. Using biophysical and biochemical methods, we indeed demonstrate that glioma BK channels localize preferentially to lipid raft microdomains where they assemble in proximity to the IP3R and respond to IP3-mediated intracellular calcium release. As a consequence, physiological activation of BK channels occurs via muscarinic acetylcholine receptors but only when lipid raft coupling of BK channels and IP3Rs is intact.
EXPERIMENTAL PROCEDURES
Cell Culture and Drugs
The glioma cell lines D54-MG and U251-MG (World Health Organization, grade IV, glioblastoma multiforme) were a gift from Dr. D. Bigner (Duke University, Durham, NC). Cells were maintained in Dulbecco’s modified Eagle’s medium/F-12 (Media Tech, University of Alabama at Birmingham Media Preparation Facility) supplemented with 2 mm glutamine (Media Tech) and 7% fetal bovine serum (Hyclone, Logan, UT), at 37 °C and 10% CO2. Unless otherwise stated, all reagents were purchased from Sigma, and stock solutions were made according to manufacturer’s instructions. Methyl-β-cyclodextrin (MβCD) was made fresh daily by resuspending in either bath solution or media at a concentration of 5 mg/ml.
Drug Treatment
For all experiments using MβCD, treatment was carried out as follows. MβCD, at a concentration of 5 mg/ml, was resuspended in either Normal Bath solution or media lacking serum. In the case of electrophysiology experiments, MβCD was added to the bath and perfused onto cells for a total of 15 min. For all other experiments, cells were washed two times with serum-free media to ensure that any noncellular cholesterol was removed, and then MβCD-containing media were added to the cells for 15 min. Cells were then immediately used for experiments.
Electrophysiology
Recordings of whole cell currents were made using an Axopatch 200A amplifier (Axon Instruments, Foster City, CA) following standard recording techniques (20). For both perforated patch and whole cell patch recordings, patch pipettes were made with thin walled borosilicate glass (World Precision Instruments (TW150F-4), Sarasota, FL) using an upright puller (Narishige Instruments (PP-830), Tokyo, Japan), and had resistances of 3–5 megohms. Current recordings were digitized on line at 10 kHz and low pass filtered at 2 kHz using a Digidata 1200 (Axon Instruments). pClamp 8.2 (Axon Instruments) was used to acquire and store data. Series resistance (Rs) was compensated to 80%, reducing voltage errors, and cells with a compensated Rs above 10 megohms were omitted. U251 cells were plated on glass coverslips and allowed to adhere overnight. Cells were used between 1 and 4 days in culture
Solutions
Our standard bath solution consisted of the following (in mm): 125 NaCl, 5 KCl, 1.2 MgSO4, 1 CaCl, 1.6 Na2HPO4, 0.4 NaH2PO4, 10.5 glucose, and 32.5 Hepes acid; pH was adjusted to 7.4 using NaOH, and osmolarity was ~300 mosm. MβCD (5 mg/ml) was added directly to the bath solution. Pipette solutions contained the following (in mm): 145 KCl, 1 MgCl2, 10 EGTA, 10 Hepes sodium salt, pH adjusted to 7.3 with Tris base. CaCl2 was added directly to pipette solution the day of use at a concentration of 0.2 mm resulting in a free Ca2+ concentration of 1.9 nm. For perforated patch recordings, pipette solution also contained amphotericin B (240 µg/ml) and 50 µm Alexa Fluor 488 (Molecular Probes, Carlsbad, CA). Standard bath solution was continuously exchanged at a rate of ~1 ml/min.
Lipid Raft Isolation
The entire process was carried out at 4 °C. Following treatment with either SF media (control) or SF media with 5 mg/ml MβCD, confluent cultures of cells were washed two times in cold PBS. Cells were collected in PBS containing protease inhibitors by scraping and centrifuged for 5 min at 12,000 × g. The supernatant was aspirated, and cells were resuspended in 500 µl of PBS and mechanically homogenized. Protein concentrations were determined using the DC protein assay kit (Bio-Rad) according to manufacturer’s instructions. After determining protein concentration, all samples were diluted to the same concentration (typically 1 mg/ml) and same volume to allow for comparison between samples. Lysates were then centrifuged for 1 h at 5000 rpm, and the supernatant was transferred to another tube and labeled the “water-soluble” fraction. The remaining pellet was resuspended in cold lysis buffer (1% Triton X-100 in TNE buffer: 25 mm Tris-HCl, pH 7.6, 150 mm NaCl, 5 mm EDTA) and incubated on ice for 15 min with occasional vortexing. The water-insoluble fraction was then centrifuged at 5000 rpm for 30 min. The supernatant was removed and labeled the “detergent-soluble” fraction. The pellet was then resuspended in a 40% Optiprep solution (60% stock Optiprep diluted in TNE) and placed in an ultracentrifuge tube. 3.5 ml of a 30% Optiprep solution were then layered on top of the 40% layer. Finally, 0.5 ml of a 5% Optiprep solution was layered on top. The tubes were then weighed to ensure that they were balanced, and the samples were spun in an Beckman Ultracentrifuge using the SW-60 swinging bucket rotor at 36,000 rpm for 16 h at 4 °C. Following centrifugation, 500-µl fractions were collected from the top to the bottom of each sample and numbered 1–9. Samples were then loaded onto a 4–20% gradient SDS-polyacrylamide gel and run according to the Western blotting protocol.
Western Blotting
Following either the lipid raft isolation or biotinylation protocol, 15 µl of each of the 11 samples (WS, DS, and fractions 1–9) were added to 3 µl of 6× sample buffer (60% glycerol, 300 nm Tris, pH 6.8, 12 mm EDTA, 12% SDS, 864 mm 2-mercaptoethanol, 0.05% bromphenol blue) and loaded into their own individual well of a 4–20% gradient pre-cast SDS-polyacrylamide gel (Bio-Rad). Protein separation was performed at a constant 100 V for ~90 min. Gels were then transferred at 200 mA for 110 min at room temperature onto polyvinylidene difluoride paper (Millipore, Bedford, MA). Membranes were blocked in blocking buffer (5% nonfat dried milk, 2% bovine serum albumin, 2% normal goat serum in TBS plus 0.1% Tween 20 (TBST)). The primary antibodies anti-Cav-1 (sc-894, Santa Cruz Biotechnology, Santa Cruz, CA) and anti-BK (Alomone, Jerusalem, Israel) were used at dilutions of 1:100 and 1:500, respectively. Blots were incubated in primary antibody for 1 h followed by a wash period (four times for 5 min). Membranes were incubated with horseradish peroxidase-conjugated secondary antibodies for 1 h, followed by another wash period (four times for 5 min) and developed using enhanced chemiluminescence (ECL; Amersham Biosciences) on Hyperfilm (Amersham Biosciences).
Biotinylation
The entire process was carried out at 4 °C. Cells were washed twice in standard bath solution containing 1 mm Ca2+. After washing, sulfo-NHS-biotin (1.5 mg/ml; Pierce) was added and allowed to incubate for 30 min with occasional gentle rocking. Biotinylation was quenched by washing cells twice with standard bath solution containing 100 mm glycine plus an additional 15-min wash. Cells were then rinsed once in bath solution, collected, spun down, and resuspended in 0.5 ml of RIPA buffer supplemented with protease and phosphatase inhibitors (1:100; Sigma). Suspension was rotated for 30 min followed by centrifugation at 12,000 × g for 5 min. At this point protein concentration was measured, and 10 µg of protein was set aside as total lysate. The remainder of the sample was incubated with agarose-streptavidin beads (400-µl beads/ml supernatant; Pierce) for 2 h. Once again beads were centrifuged at 10,000 × g for 10 s, and the supernatant (representing the unbound fraction) was collected. The beads were gently washed four times with RIPA Buffer and resuspended in 100 mm glycine, pH 2.8, for 3 min with occasional vortexing to separate surface protein from the beads. Sample buffer was added immediately to neutralize pH. In the few cases where sample buffer was not enough to neutralize pH (as evidenced by a yellowish color), one drop of 1 n NaOH was added. Additionally, 6× sample buffer was added to the total lysate fraction, and all three samples were loaded onto a 4–20% gradient pre-cast SDS-polyacrylamide gel, separated, and transferred according to the Western protocol. All blots were probed with anti-actin (1:1000) as a negative control to ensure that the surface protein fraction was not contaminated with intracellular protein, and anti-Na+,K+-ATPase (1:1000, Abcam, Cambridge, MA) was used as a positive control to denote that we had, indeed, isolated the membrane fraction.
Immunocytochemistry
Cells were cultured on coverslips (12-mm round; Macalaster Bicknell, New Haven, CT) for 1–3 days. Cells were subsequently treated for 15 min in either SF media or SF media containing MβCD (5 mg/ml). After washing cells were fixed in 4% paraformaldehyde for 10 min at room temperature. Cells were then washed twice in PBS and blocked and permeabilized in PBS containing 0.3% Triton and 5% normal goat serum for 30 min. Once again, cells were washed in PBS containing 5% normal goat serum and incubated overnight with primary antibodies at 4 °C. The following day, cells were washed four times in PBS and labeled with secondary antibodies for 1 h in the dark. After labeling, cells were washed with PBS and incubated with 4′,6-diamidino-2-phenylindole for 5 min. Cells were washed two more times and mounted onto slides with Gel/Mount (Biomedia Corp., Forest City, CA). X63 images were acquired with a Zeiss Axiovert 200 M (Göttingen, Germany).
Migration Assay
The day before the experiment was performed, an ~70% confluent dish of U251 cells were rinsed and supplied with serum-free media overnight. Cell culture inserts (BD Biosciences) with 8-µm pores were coated overnight with Vitronectin (BD Biosciences) at a concentration of 5 µg/ml in PBS. The following day, inserts were washed two times with PBS and blocked with 1% fatty acid-free bovine serum albumin for 1 h. Inserts were then washed two times in PBS, and 400 µl of Migration Assay Buffer (MAB, 0.1% fatty acid-free bovine serum albumin in serum-free media) was added to the bottom of each well. Cells were rinsed once in PBS and were lifted off the dish by the addition of 0.5 mm EGTA for ~20 min. U251 cells were rinsed twice by centrifugation and resuspended in MAB and counted. Forty thousand cells were plated on top of each filter and allowed to adhere for 30 min before drug was added. After addition of drug, cells were allowed to migrate for 5 h. Filters were then fixed and stained with Crystal Violet, and the tops were wiped clean of cells, and representative fields (five per filter) were counted with a Zeiss Axiovert 200 M microscope with a 10× objective.
Data Analysis
Results were analyzed using Origin (version 6.0, MicroCal Software, Northhampton, MA) and Excel 2000 (Microsoft, Seattle). Significance was determined by one-way analysis of variance because all data showed normal distribution. All data reported are mean ± S.E., and * denotes p < 0.05 unless otherwise stated.
RESULTS
BK Channels in Glioma Cell Lines Localize to Lipid Raft Domains
The central hypothesis examined by this study is that glioma BK channels localize to privileged membrane subregions or microdomains where sufficient local changes in [Ca2+]i can be achieved to allow channel activation in response to physiological stimuli as cells invade. We further hypothesized that these microdomains may be established through privileged membrane regions termed lipid rafts (LRs). In a first series of experiments, we examined the possible association of BK channels with LRs in glioma cells by labeling cells in culture with antibodies directed against the Maxi K+ α-subunit and three common lipid raft markers, specifically caveolin-1, flotillin, and a fluorescently conjugated cholera toxin B subunit, which binds to GM1 ganglioside, a common component of lipid rafts (21). Representative examples from two different cell lines, one (GBM-62) derived directly from a patient biopsy, are shown in Fig. 1. In both cell lines, BK channel immunoreactivity is found diffusely throughout the cell. In addition, however, both BK channels and each of the LR proteins caveolin-1 (Fig. 1A and supplemental Fig. 1A) and flotillin (Fig. 1B and supplemental Fig. 1B) as well as the cholera toxin B subunit (Fig. 1C and supplemental Fig. 1C) appeared to be found in hot spots at the protruding edges of the cell. The cells in Fig. 1B appeared to have been migrating away from one another probably having just recently divided. Interestingly, the BK and LR hotspots in both of these cells seem to localize to the leading edge, or lamel-lipodia, of each cell, indicating that these channels may associate with LRs in distinct regions in migratory cells. These immunocytochemical stainings suggest that BK channels may indeed be found in lipid raft microdomains in glioma cells.
FIGURE 1. BK channels and lipid raft markers co-localize.
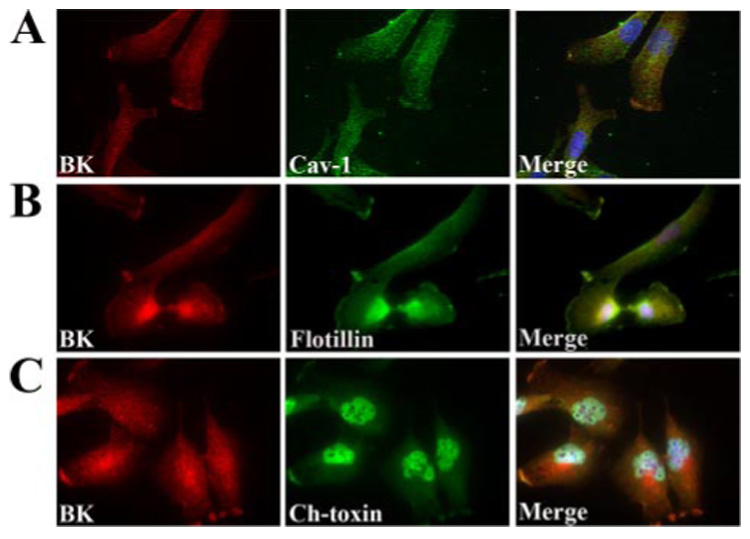
Glioblastoma cells derived from a patient biopsy were cultured for 2 days and then fixed to probe for subcellular localization of BK channels and lipid raft markers. All cells were probed with monoclonal antibodies to the MaxiK+ (BK) α-subunit as indicated in the left-hand panels of A–C. BK channel immunostaining was compared with the localization of Cav-1 (A), flotillin (B), and the B subunit of cholera toxin (C). X63 images were obtained via wide field microscopy. The merged image of each immunocytochemistry is shown in the right-hand panel and illustrates overlap of both the BK channel and each of the three lipid raft markers suggesting that these channels localize to the lipid rafts in these cells. Scale bar represents 20 µm.
To further verify this association, we examined this question biochemically. To do this we adapted a well described lipid raft isolation protocol (22) that separates whole cell lysates into water, detergent-soluble, and detergent-insoluble fractions at 4 °C based on their relative solubilities in aqueous solutions with or without detergent. Based on this isolation technique, as described in greater detail under “Experimental Procedures,” cytosolic constituents were isolated in the water-soluble fraction (Fig. 2A, W) because they exist in an aqueous environment in the cell. Following removal of the cytosolic fraction, we were left primarily with membrane and cytoskeletal elements that we further dissociated into a detergent-soluble fraction (Fig. 2A, D) containing membrane-associated proteins capable of being solubilized in Triton X-100 and detergent-insoluble proteins. The detergent-insoluble fraction consists of cytoskeletal proteins as well as proteins associated with regions of the membrane exhibiting a large enough concentration of lipid to render them insoluble in detergent at 4 °C, i.e. lipid rafts. The remaining proteins were further separated into 9 fractions by discontinuous gradient centrifugation. All 11 isolated fractions were run on an SDS-polyacrylamide gel and then Western-blotted to probe for both lipid raft markers and BK channels. As depicted in Fig. 2A, caveolin-1 (Cav-1), a common lipid raft-associated protein used to biochemically define the lipid raft containing gradient fractions, was found in the second density gradient fraction. This lane was herein referred to as the lipid raft fraction because lipid rafts are buoyant and thus their constituents are typically found in the less dense fractions of the gradient. In addition to precipitating in the 2nd detergent-insoluble fraction, a portion of Cav-1 was also found in the detergent-soluble lane likely consisting in part of protein not yet trafficked to the membrane and to partial solubilization of a small amount of lipid rafts. Importantly, these were the two fractions that also contain BK channels further suggesting that BK channels associate with the caveolar lipid raft fraction and consistent with our immunocytochemistry data (Fig. 1 and Fig. 2B).
FIGURE 2. BK channels associate with lipid rafts.

A, biochemical isolation of lipid rafts was performed on U251MG cells by isolating water soluble (W) and detergent-soluble (D) proteins from whole cell lysates. The remaining cellular constituents were subjected to ultracentrifugation, and nine fractions (1–9) were collected and run along side the water- and detergent-soluble proteins on an SDS-polyacrylamide gel. Western blots were then probed for BK channels and Cav-1. As illustrated in the Control blot, Cav-1 is found in the 2nd fraction which is typically considered the lipid raft fraction. BK channel protein is also found in this fraction indicating the BK channels localize to lipid rafts in glioma cells. The same isolation protocol was performed after 15 min of treatment with MβCD at 5 mg/ml, and subsequent Western blotting of one such experiment shows that disruption of lipid rafts removes BK channel protein from the lipid raft fraction of the isolation. B, immunocytochemistry before and after the same treatment as in A demonstrates further that MβCD is capable of removing BK channels from lipid rafts. Control immunostaining in the top row shows the normal distribution of BK channels in U251 cells, similar to that seen in the GBM-62 cells. Disruption of lipid rafts with MβCD results in a redistribution of BK channel immunoreactivity diffusely throughout the cell. C, glioma cells were immunostained with TRITC-conjugated phalloidin (red) to visualize actin filaments and 4′,6-diamidino-2-phenylindole (DAPI) (blue) to label nuclei. Immunolabeling was performed on cells treated with or without MβCD and demonstrates no change in actin labeling following disruption of lipid rafts.
To address the importance of lipid rafts for the clustered localization of BK channels to specialized membrane regions, we next experimentally disrupted lipid rafts. For this purpose we used methyl-β-cyclodextrin, a member of the cyclodextrin family of cyclic oligosaccharides consisting of seven glucopyranose units. This family of molecules is commonly used as a solubilizing agent for molecules that are, alone, insoluble in aqueous solutions. MβCD is the most commonly used member of the family, and its ability to solubilize cholesterol in aqueous solutions has been well documented (23). Several studies have shown that MβCD, in addition to being able to solubilize cholesterol, can also actively remove and sequester cholesterol from membrane (24–26). To demonstrate its usefulness as an LR-disrupting agent, U251 glioma cells were treated with MβCD at a concentration of 5 mg/ml for 15 min at 37 °C prior to performing the same biochemical and immunocytochemical assays described above. As shown in Fig. 2A, treatment with MβCD resulted in a complete shift of BK channel protein from the lipid raft fraction to the detergent-soluble fraction of the membrane. Likewise, immunostaining of Cav-1 and BK channels (Fig. 2B) illustrates that BK channel and Cav-1 protein coexist in an ordered arrangement with both proteins being found in hot spots on the lamellipodia and in perinuclear regions indicative of endoplasmic reticulum localization. However, immunostaining of cells treated with MβCD demonstrated a redistribution of channels in the membrane, disrupting the tight organization found under normal conditions indicating that MβCD does indeed interrupt an association between BK channels and lipid rafts. Furthermore, immunolabeling of U251 glioma cells with phalloidin illustrates no difference in the distribution of actin filaments following MβCD treatment. This indicates that MβCD does not interfere with the intracellular actin architecture.
Lipid Raft Disruption Reduces Whole Cell BK Currents
To examine whether the BK channel association with LRs has any functional significance, we next performed electrophysiological experiments before and after acute disruption of lipid rafts. Specifically we recorded whole cell BK currents in glioma cells while continuously bath-applying MβCD (5 mg/ml) for a total of 15 min. A representative example of one such experiment before and after 15 min of MβCD is illustrated in Fig. 3A. Cells were voltage-clamped at −40 mV, and BK currents were activated by stepping the membrane in 20-mV increments to +180 mV before and after application of MβCD. To verify that the MβCD effect was unique to BK currents, we recorded inward currents mediated by Kir channels in U251 cells, which were activated by stepping the membrane to negative potentials between −160 and +20 mV following a 200-ms prepulse at 0 mV. As shown in the representative traces in Fig. 3A, following 15 min of MβCD treatment, BK currents were reduced by ~50%, whereas Kir currents were unaffected. Cumulative data from 13 cells for BK currents and 10 cells for Kir currents are shown in Fig. 3, B and C, respectively. As is evident in the raw traces, treatment with MβCD selectively reduced whole cell BK currents without affecting Kir currents in the same cell, ruling out nonspecific effects of the drug and, importantly, suggesting that intact LRs may be required for maximal BK channel function.
FIGURE 3. MβCD treatment reduces BK currents by ~50%.

Whole cell patch clamp recordings of U251 glioma cells were performed before and after 15 min of bath application of MβCD. A, representative traces from one experiment illustrate BK and Kir currents before and after treatment. BK currents are significantly reduced after application of MβCD, whereas Kir currents remain unaffected. Cumulative data further illustrate the reduction in BK currents because of MβCD treatment (B, n = 10) and the lack of an effect on Kir currents (C, n = 5).
Lipid Raft Disruption Does Not Cause Channel Internalization or Alter Ca2+ Sensitivity of the Channel
The above illustrated whole cell recordings were all conducted 15 min following MβCD treatment. To determine the time course of the MβCD-induced reduction in whole cell BK currents in more detail, we performed whole cell voltage clamp recordings as described above using only a single step to +140 mV from holding potential of −40 mV every 30 s for a 15-min period. Fig. 4A shows a representative example in which the peak BK current recorded in response to a voltage step to 140 mV was normalized at every given time point to the starting value, preceding the application of MβCD. As is clearly evident from this plot, MβCD caused a rapid decrease in BK currents that reached a maximum in approximately 5 min after which current amplitudes remained relatively constant for the duration of the experiment. This rapid time course of MβCD-induced BK current reduction may indicate that either BK channels are being rapidly internalized, as lipid rafts are known to be involved in protein trafficking, or that lipid rafts in glioma cells localize BK channels near a Ca2+ source, and this association is being disrupted. To examine the first possibility, an internalization of BK channels, we performed biochemical studies in which cell surface protein can be selectively tracked though cell surface biotinylation as described previously (7, 8). Results from one such experiment, illustrated in Fig. 4B, demonstrate that no change in either plasma membrane BK channel protein (membrane fractions, control, and MβCD) or whole cell BK channel protein (total fractions, control, and MβCD) occurred following treatment with MβCD.
FIGURE 4. MβCD does not cause internalization or a change in calcium sensitivity of BK channels.

A, whole cell patch clamp recordings were performed by clamping the membrane voltage at −40 mV and stepping to +140 mV every 30 s, while bath-applying MβCD. The resultant current was normalized to the average current obtained before drug application and plotted as a function of time. The data indicate that MβCD induces a rapid decrease in BK current that levels off after 5 min and remains constant for the duration of the experiment. B, confluent cultures of U251 cells were treated either in control or MβCD-containing media and incubated in the presence of biotin at 4 °C to prevent endocytosis (n = 3). Whole cell lysates were collected and incubated with streptavidin beads to immunoprecipitate biotinylated membrane protein. Western blotting was performed on total and membrane fractions, and blots were probed for BK channel protein and Na+,K+-ATPase, which was used as a loading control. As illustrated, there is no change in the amount of protein on the membrane after treatment with MβCD. C, perforated patch clamp recordings using amphotericin B to leave [Ca2+]i undisturbed. Ionomycin was bath-applied to selectively permeabilize the membrane to calcium, and baths with increasing calcium concentrations were then applied while monitoring the resting membrane of the potential cells. A representative trace demonstrates that 500 nm calcium is required to activate BK channels as evidenced by the hyperpolarization of the membrane potential that can be inhibited by 2 µm paxilline. D, cumulative data from the experiments in E (n = 6) and F (n = 10). Whole cell voltage clamp recordings were performed before and after bath application of MβCD with either 750 nm Ca2+ (E) or 150 nm Ca2+ in the pipette solution to mimic high and basal calcium levels, respectively. Data indicate that in the presence of 750 nm [Ca2+]iMβCD is incapable of reducing BK currents, whereas 150 nm [Ca2+]i is incapable of overcoming this effect. **, p ≤ 0.01.
If the alternative explanation were true, i.e. that lipid raft disruption dissociates BK channels from their Ca2+ source, we should be able to overcome the effect of MβCD simply by raising [Ca2+]i to a level above that required to physiologically activate BK channels. To address this question we first needed to determine the [Ca2+]i required to activate BK channels at the resting membrane potential. We did this by performing perforated patch recordings with amphotericin B that allows us to monitor membrane potential without manipulating [Ca2+]i. After achieving whole cell access, current clamp recordings were used to monitor the “resting” membrane voltage. Cells were then perfused in Ca2+-free bath containing 5 µm ionomycin that selectively permeabilizes the membrane to calcium allowing us to equilibrate [Ca2+]i with [Ca2+]bath. The [Ca2+]bath was then increased from 0 to 100, 250, and 500 nm and 1 µm while monitoring membrane voltage. A representative example of one such experiment is shown in Fig. 4C. In all cells examined (n = 10), the membrane potential hyperpolarized to a mean of −78 ±5mV (EK = −85 mV) immediately following perfusion of the 500 nm Ca2+ bath solution. This hyperpolarization was completely inhibited by 2 µm paxilline, a selective BK channel inhibitor, indicating that the change in membrane potential was exclusively because of the activation of BK channels. After determining the minimum [Ca2+]i required to activate BK channels at rest, we set out to determine whether raising [Ca2+]i was able to overcome the MβCD effect. We repeated the same whole cell patch recordings as before, except we modified the [Ca2+]pipette to mimic both basal [Ca2+]i (150 nm) and high [Ca2+]i (750 nm). As illustrated in Fig. 4, E and F, cells containing a [Ca2+]i of 150 nm still exhibited a marked reduction in whole cell BK currents following 15 min of MβCD treatment. The same experiments performed with 750 nm [Ca2+]i had a very different outcome. High [Ca2+]i was able to completely overcome the reduction of BK currents induced by MβCD. These data support the hypothesis that lipid raft association serves to localize BK channels near a calcium source because this effect of lipid raft disruption could be surpassed by supplying the cell with a [Ca2+]i more than sufficient to activate BK channels at the resting membrane potential.
Possible Ca2+ Source for BK Channel Activation
Two principal sources exist to supply Ca2+ necessary for the activation of BK channels: 1) entry of Ca2+ through a calcium-permeable ion channel or 2) calcium released from intracellular stores. If the calcium source is a Ca2+ channel and lipid rafts colocalize the two, then inhibition of the Ca2+ channel should reduce BK currents, and this reduction should be insensitive to MβCD. If release occurred from intracellular stores, depletion of these stores should disrupt BK channel activation. We examined both possibilities through biophysical recordings and the use of pharmacological blockers. Studies in human gliomas have demonstrated the expression of both L-type and T-type VGCCs (27, 28), and data from our own laboratory suggest that these cells express TRPC channels, a nonselective cation channel that is permeable to calcium and has been implicated in store-operated calcium entry (50). We thus set out to determine whether one of these candidate channels was the calcium source for BK channels. Electrophysiological recordings of BK currents in the presence of 1 µm nimodipine and 10 µm mibefradil to inhibit L-type and T-type VGCCs, respectively, or 10 µm GdCl3 and 25 µm SKF93635 to inhibit TRPC channels were carried out before and after application of MβCD. As illustrated in Fig. 5A, pharmacological inhibition of TRPC or T-type voltage-gated calcium channels had no significant effect on BK currents. Furthermore, MβCD still reduced BK currents indicating that a calcium channel is not the BK calcium source. Interestingly, inhibition of L-type voltage-gated calcium channels resulted in a slight reduction in BK currents, and subsequent application of MβCD had a significantly smaller effect implying that L-type voltage-gated calcium channels may indeed be a viable source for calcium to activate BK channels. To completely rule out whether one or multiple Ca2+ channels may be the calcium source for BK channels, we acutely removed calcium from the extra cellular bath solution. As shown in representative traces in Fig. 5B, removing extra cellular calcium did not affect BK currents. The lack of affect of calcium removal was observed in all cells recorded (Fig. 5A). Furthermore, subsequent application of MβCD reduced BK currents to the same extent in 0 [Ca2+]o as that observed in the presence of 2 mm [Ca2+]o (Fig. 4D and Fig. 5A).
FIGURE 5. Calcium channels do not serve as the calcium source for BK channels.
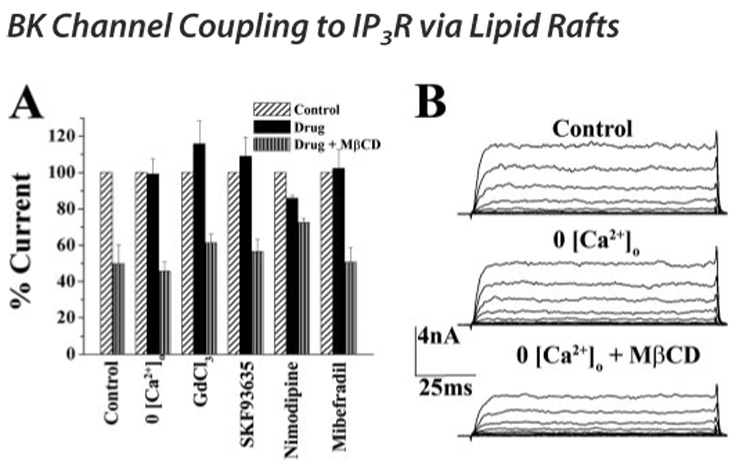
A, whole cell voltage clamp recordings were performed in the presence of 0 [Ca2+]o, 10 µm GdCl3, 25 µm SKF93635, 1 µm nimodipine, and 10 µm mibefradil to inhibit TRPC channels, L-type voltage-gated calcium channels, and T-type voltage-gated calcium channels, respectively. Graph shows cumulative data from 10 cells for each condition. BK current elicited at 140 mV after drug was normalized to current before drug and represented as percentage control. Black bars indicate the percent control current in the presence of each drug. After application of each drug, MβCD was applied for 15 min, and BK current at 140 mV was again normalized to control current and is represented by bars with vertical lines. Application of nimodipine had a small, but significant, effect on BK currents. Additionally, pretreatment with nimodipine attenuated the MβCD effect on BK currents. B, representative traces of BK currents recorded under control, 0 [Ca2+]o, and 0 [Ca2+]o + MβCD. Removal of [Ca2+]o had no effect on BK currents and was unable to prevent the reduction in BK currents induced by MβCD.
Our data therefore suggested that calcium channels are not the calcium source for BK channels and led us to investigate whether calcium release from intracellular stores fulfilled this role. To assess this possibility directly, we depleted intracellular Ca2+ stores with 100 nm thapsigargin, an irreversible inhibitor of the sarcoplasmic reticulum Ca2+-ATPase pump, for 30 min at 37 °C. We then performed whole cell patch recordings of BK currents, again doing so before and after disruption of lipid rafts with MβCD treatment. Importantly, recordings were carried out 5 min after gaining whole cell access to allow for any transient increase in [Ca2+]i caused by thapsigargin treatment to be dialyzed with pipette solution. As shown in Fig. 6A (n = 15), thapsigargin pretreatment completely inhibited the effect of MβCD on BK currents. Raw traces from one experiment are shown in Fig. 6B and demonstrate that after 15 min of MβCD treatment, there is no change in whole cell BK currents. Calcium released from intracellular stores can occur through one of two independent pathways. The first of these is through activation of ryanodine receptors by ryanodine, caffeine, or heparin and has been well characterized as the mechanism for calcium release responsible for contraction in skeletal and smooth muscle (29). The second mechanism for release of intracellular calcium is through activation of IP3R by IP3 production following activation of the phospholipase C-γsignaling pathway and has been directly linked to [Ca2+]i elevations that occur in response to various growth factors and neurotransmitters (30). We used selective pharmacological blockers to determine whether either of these pathways might serve as the Ca2+ source for BK channels. As depicted in Fig. 5C, MβCD was still capable of reducing whole cell BK currents in glioma cells pretreated with 50 µm ryanodine, a compound that at low concentrations (<10 µm) can activate ryanodine receptors, but at high concentrations (>20 µm) will inhibit the receptor. Conversely, pretreatment with 50 µm 2-APB, a nonspecific inhibitor of the IP3R, prevented the MβCD-induced decrease in whole cell BK currents completely, indicating that IP3Rs are the probable calcium source for BK channels in lipid rafts in glioma cells.
FIGURE 6. IP3Rs are the calcium source for BK channels.

Whole cell voltage clamp recordings were performed in the presence of various modulators of intracellular calcium release before and after application of MβCD. A, U251 cells were treated with 100 nm thapsigargin at 37 °C for 15 min to deplete intracellular stores prior to electrophysiology experiments. IV curves before and after application of MβCD to these cells demonstrate a loss of the MβCD effect (n = 15). B, raw traces from one recording of a thapsigargin-treated cell before and after MβCD treatment. C, IV curves from experiments performed in the presence of 50 µm ryanodine to inhibit the intracellular ryanodine receptor. Data illustrates that MβCD was still capable of reducing BK currents in glioma cells (n = 5) after inhibition of ryanodine receptor-mediated calcium release. D, IV curves as in C except in the presence of 50 µm 2-APB to inhibit the IP3 receptor. MβCD application after 2-APB treatment is not successful in reducing BK currents (n = 10).
Physiological Stimulation of IP3Rs Activates BK Channels in Lipid Rafts
Pharmacology indicates that BK channels may be coupled to IP3Rs via lipid rafts in glioma cells. We next sought to activate IP3Rs using a physiological stimulus. Previous evidence from our own laboratory has indicated that stimulation of muscarinic acetylcholine receptors (mAChRs) with muscarine or acetylcholine (ACh) elicits an increase [Ca2+]i that subsequently activates BK channels in U373 glioma cells (2). Additionally others have demonstrated the presence of the M3 mAChR in glioma cells (32) that has been shown to induce inositol phosphate hydrolysis and intracellular calcium release (33, 34). Accordingly, we were interested in whether muscarinic receptor signaling in U251 glioma cells might also activate BK channels through production of IP3 and whether this signaling was dependent on lipid raft integrity. We loaded cells with fura-2AM, a calcium-sensitive ratiometric dye, and we simultaneously monitored [Ca2+]i while performing perforated patch recording with amphotericin B to monitor resting membrane potential without altering intracellular calcium dynamics. Bath application of 50 µm ACh induced an increase in intracellular calcium. Moreover, all cells that responded to Ach with an increase in [Ca2+]i (six of nine cells examined) also exhibited a concurrent hyperpolarization of the resting membrane potential that was completely abolished in the presence of 2 µm paxilline, a specific inhibitor of BK channels (Fig. 7, A and E). We also bath-applied 50 µm 2-APB for 5 min prior to application of ACh to induce a calcium response. In four of five cells examined, 2-APB treatment did not change [Ca2+]i or the membrane potential, as illustrated in the representative trace (Fig. 7, B and E). This indicates that the calcium response elicited by ACh was because of IP3 hydrolysis and activation of IP3Rs. Furthermore, these data support our finding that IP3R-mediated Ca2+ release is likely the calcium source for BK channels. Finally, we sought to address the dependence on lipid raft integrity on this signaling cascade. As a first step we biochemically isolated LR membrane fractions as before and examined the localization of the M3 mAChR. As shown in Fig. 7C (n = 3), antibodies directed against the receptor recognized bands in the lipid raft fraction as determined by reprobing the same blot for Cav-1. Furthermore, as demonstrated by the representative trace in Fig. 7D and cumulative data in Fig. 7E, disruption of lipid rafts prevented both the ACh-induced rise in [Ca2+]i and the BK channel-induced hyperpolarization of the membrane. Taken together the data presented here supports the hypothesis that BK channels are coupled to IP3-mediated calcium release and can be physiologically activated by ACh via the Gq-coupled receptor, M3, and that this signaling cascade requires intact lipid rafts.
FIGURE 7. Physiological activation of mAChRs stimulates IP3-mediated calcium release and activation of BK channels dependent on lipid rafts.
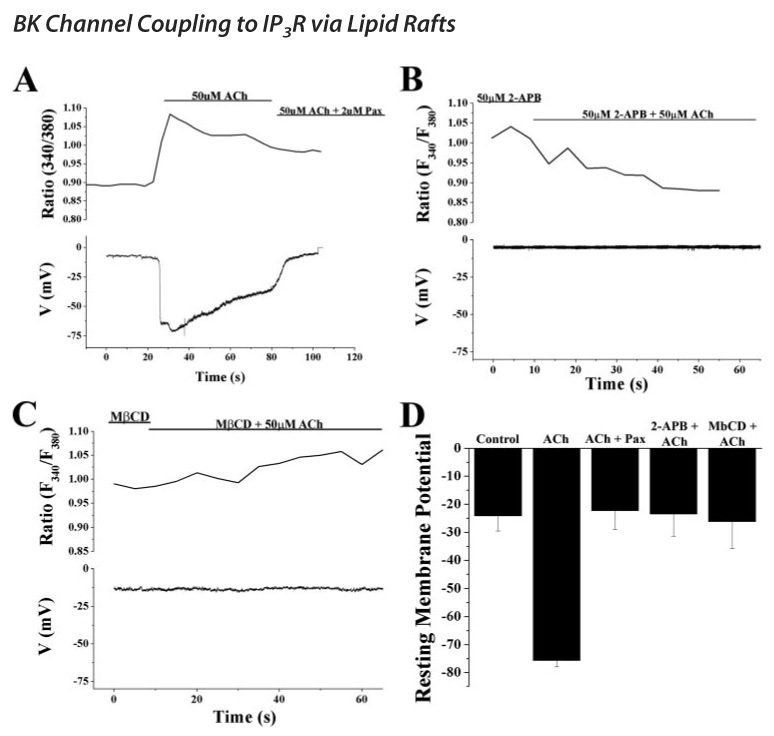
Perforated patch clamp recordings were performed using amphotericin B to leave [Ca2+]i undisturbed in cells loaded with Fura2-AM. A, 50 µm ACh was bath-applied while simultaneously monitoring both membrane potential and [Ca2+]i. The top half of the graph shows the F340/F380 ratio generated during the recording and the concurrent response of the resting membrane potential. ACh induced a rise in calcium as evidenced by an increase in the ratio and concomitant hyperpolarization of the membrane potential to ~75 mV that was completely inhibited by the subsequent application of 2 µm paxilline, a specific inhibitor of BK channels. B, similar experiment as in A except 50 µm 2-APB, an inhibitor of the IP3R, was applied prior to ACh. In the presence of 2-APB, ACh was unable to elicit a calcium response or a simultaneous hyperpolarization of the membrane indicating that the calcium release because of activation of mAChRs is via IP3Rs. Furthermore, this calcium release pathway is what is responsible for the activation of BK channels. C, again simultaneous calcium imaging and perforated patch recording experiments were performed. Cells were bathed continuously in MβCD prior to application of ACh. Disruption of lipid rafts completely inhibited the calcium response to ACh and the concomitant hyperpolarization. D, cumulative data from the experiments carried out in A–D. Experiments were performed on at least five cells in each condition. Resting membrane potentials in response to ACh in the presence or absence of paxilline, 2-APB, and MβCD were determined 1 s following perfusion of ACh and were averaged. Data represent mean ± S.E.
IP3Rs Localize Near BK Channels
Pharmacology indicated that IP3-mediated Ca2+ release was the calcium source for BK channels and that this coupling is dependent on lipid rafts. If IP3Rs are indeed the source of calcium required for activation of BK channels, then one would expect that they should localize to the same regions of glioma cells as both BK channels and lipid raft markers. To analyze the subcellular distribution of IP3Rs and to compare this to the location of BK channels we co-labeled cells with antibodies directed against both proteins. We then examined the subcellular distribution of each protein using a spinning disk confocal microscope. As shown in the image in Fig. 8A and earlier in Fig. 1, BK channels localize diffusely throughout the cell as well as in hot spots at what appears to be the lamellipodia or leading edge of the cell. IP3Rs, as would be expected, seemed to primarily be concentrated in an intracellular compartment, most likely the ER. However, in addition to being found in this intracellular compartment, immunostaining also revealed that IP3Rs localize to the exact same hotspots as BK channels, as evidenced. Additionally, Western blotting of a lipid raft isolation as performed earlier demonstrates that IP3Rs can be found in the LR fraction as shown in Fig. 8B.
FIGURE 8. IP3Rs localize to the same hotspots as BK channels but do not directly interact with the channel.

A, U251 cells were co-immunolabeled with antibodies directed against IP3Rs and BK channels. Spinning disk confocal microscopy with a X60 objective was used to obtain 0.5-µm slices through the cell. A single slice is illustrated in A, and the leading edge of the cell is magnified directly beneath the image. Both BK channels and IP3Rs seem to localize to the leading edge of the cell in the same regions. Scale bar represents 20 µm. B, Western blotting of a biochemical isolation of lipid raft proteins with antibodies directed against the IP3R indicates presence of the receptor in the lipid raft fraction in U251 cells. Blots were also probed with antibodies to Cav-1 to verify that the isolation had indeed been successful. C, whole cell lysates of U251 cells were incubated with mouse monoclonal antibodies directed against the BK channel and protein A-agarose beads. The beads were separated from the supernatant and washed three times with buffer to remove contaminating proteins. Western blotting on the fraction immunoprecipitated by the beads (Bound) and the supernatant (Unbound) was performed. Antibodies directed against the BK channel confirm that the channel had indeed immunoprecipitated with the beads. The band seen in the unbound fraction is a smaller ~90-kDa nonspecific band as comparison to HEK293 cell lysate demonstrates the same band despite a lack of BK channel protein in these cells. Probing of the same blot with antibodies directed against the IP3R shows an absence of protein in the bound fraction indicating that the receptor was not co-precipitated with the BK channel. D, model depicting the lipid raft dependence of mAChR and IP3R signaling to BK channels.
This led us to investigate the mechanism by which BK channels in lipid rafts are coupled to IP3Rs in glioma cells. One possible option for this LR-dependent coupling is a direct protein-protein interaction between the IP3R and BK channels that would indicate that the BK channel association with lipid rafts acts to bring the channel into close proximity with the IP3R. To assess this possibility, we immunoprecipitated BK channel protein from whole cell lysates of U251 glioma cells with a monoclonal antibody directed against the C-terminal region of the peptide. We then collected and ran total lysate, unbound and bound samples on an SDS-polyacrylamide gel and probed for IP3Rs. Blots were stripped and reprobed with polyclonal BK channel antibodies to verify that we had indeed pulled down the ion channel and actin antibodies to illustrate that our bound sample was not contaminated with nonbound proteins. Fig. 8C shows a representative blot from one such experiment illustrating a lack of IP3R protein in the bound lane indicating that they do not co-immunoprecipitate and therefore do not directly bind to BK channels. Instead, they appear to localize in the vicinity of the channel in microdomains established by lipid rafts.
DISCUSSION
The data shown here demonstrate that BK channels in glioma cells localize to lipid raft microdomains where they are assembled into a signaling complex with a specific Ca2+ source that allows for channel activation. Specifically, we show that BK channels in glioma cells localize to the same fraction of an Optiprep density gradient as the well characterized lipid raft-associated protein Cav-1. This result was further supported by immunocytochemistry demonstrating that BK channels and Cav-1 seem to localize to the same regions of the cell. Moreover, disruption of lipid rafts with MβCD caused an ~50% reduction in whole cell BK currents that was not because of channel internalization and could be completely prevented by raising [Ca2+]i, implying that lipid raft disruption also interrupts an association between BK channels and their Ca2+ source. Through the use of pharmacology we eliminated [Ca2+]o influx as the source for BK channels, and we demonstrated that release of intracellular calcium via the IP3R appears to be the likely source of calcium for BK channels in lipid rafts. Finally, we show that ACh, a ligand of muscarinic ACh receptors, stimulates [Ca2+]i release via IP3 production that activates BK channels and that this is absolutely dependent on lipid raft integrity. These findings are significant in that they provide a novel mechanism for BK channel activation that is independent of cell depolarization and instead places BK channels near a Ca2+ source that is sufficient for channel activation.
BK channels are unique ion channels capable of responding to either changes in membrane potential, changes in [Ca2+]i, or a combination of both. Unlike neurons or muscle cells, glioma cells do not experience the large membrane depolarizations associated with action potential propagation or the large Ca2+ sparks following muscle stimulation. Even in excitable cells evidence exists that BK channels form signaling complexes with specific calcium sources. Indeed, Doheny et al. (35) demonstrated that BK channels in uterine myocytes are functionally coupled to β3-adrenoceptors, and BK channel activation is responsible for the β3-adrenoreceptor-induced uterine relaxation because inhibition of BK channels prior to activation of the receptor completely inhibits relaxation. Additionally, β2-adrenoceptors have been shown to form signaling complexes with BK channels and L-type VGCCs, functionally coupling the influx of calcium through the L-type channel to activation of BK channels (36). Interestingly, a very recent study has suggested that Ca2+ wave propagation in astrocytes is absolutely dependent on IP3 signaling in lipid raft domains (37). Additionally, BK channels have been found to localize to astrocytic end feet (38), where they aid in blood-brain barrier signaling in response to these same Ca2+ waves (39). Given the findings in this study, it seems likely that a similar mechanism is in place in astrocytes and that BK channels likely localize to lipid rafts to ensure their activation in response to IP3-mediated calcium waves.
Unlike other mechanisms for assembly of signaling complexes, lipid rafts provide a scaffold where proteins can move in and out freely, making it possible for BK channels to have multiple signaling partners depending on the cellular context. Glioma cells are characterized by rapid proliferation and migration/invasion. These cellular processes can be initiated by very different signals. Evidence exists that multiple growth factor receptors implicated in both proliferation and migration diffuse into or out of lipid raft microdomains upon ligand binding (for review see 40). Additionally, inositol 1,4,5- triphosphate production has been shown to occur exclusively in lipid rafts (41). Together, these phenomena may imply that any receptor that binds ligand while either localized to lipid rafts or is subsequently translocated into lipid rafts following binding may activate BK channels in that same raft, initiating K+ fluxes required for migration. This idea is supported by our immunocytochemistry data demonstrating that BK channels, IP3Rs, and LR markers all localize to what appear to be lamellipodia or the leading edge of glioma cells. Furthermore, independent studies from our own laboratory suggest that chloride channels associate with lipid rafts (42) and that these channels are also involved in glioma cell migration (1–5). Interestingly, immunolabeling from this latter study indicates that chloride channels also localize to the leading edge of migratory glioma cells, and thus it is tempting to hypothesize that BK channels, chloride channels, IP3Rs, and growth factor receptors may localize to lamellipodia where together they form a lipid raft-dependent signaling complex specifically involved in facilitating the coordinated K+ and Cl− effluxes thought to be required for migratory volume changes.
Two previous studies conducted in lipid bilayers have demonstrated that the lipid content of membrane has drastic effects on the biophysical properties of BK channels (43, 44). Specifically, increasing the cholesterol content of the bilayer increases the mean closed time of the channel thereby attenuating channel activity. Interestingly, these same observations of channels inserted into artificial membrane appear to hold true in cellular systems. Several recent studies have demonstrated that BK channels in colonic epithelia, vascular endothelia, and human myometrium all localize to lipid rafts. Moreover, in each of these studies BK currents were not present until after disruption of these membrane microdomains with MβCD (45–47). In these same cell systems, as with several other smooth muscle cell types, however, lipid rafts also appear to serve a similar function as in glioma cells, i.e. they localize BK channels to the same regions of the cell as ryanodine receptors and L-type voltage-gated calcium channels responsible for generating calcium sparks in response to electrical stimulation (31, 48, 49).
In this study, however, we demonstrate for the first time that BK channels in glioma cells are functionally coupled to [Ca2+]i through IP3Rs via lipid rafts. This finding is important because different signaling pathways can activate different mechanisms of [Ca2+]i mobilization, and it implies that in glioma cells BK channels rely heavily on phospholipase C-γ-dependent signaling for their activation. Therefore, examining G-protein-coupled receptors, receptor tyrosine kinases, and other receptors that directly stimulate phospholipase C-γ, inducing IP3R-dependent calcium release, may provide additional insight into the function of BK channels in the context of glioma cell invasion. These studies may therefore provide novel ways to interfere with the diffuse spread of gliomas in the surrounding healthy brain.
Supplementary Material
Footnotes
This work was supported by National Institutes of Health Grants RO1-NS36692 and RO1-NS31234. The costs of publication of this article were defrayed in part by the payment of page charges. This article must therefore be hereby marked “advertisement” in accordance with 18 U.S.C. Section 1734 solely to indicate this fact.
The on-line version of this article (available at http://www.jbc.org) contains supplemental Fig. 1.
The abbreviations used are: TRPC, transient receptor potential channel; IP3R, inositol 1,4,5-triphosphate receptor; MβCD, methyl-β-cyclodextrin; 2-APB, 2-aminoethoxydiphenyl borate; LR, lipid rafts; PBS, phosphate-buffered saline; IP3, inositol 1,4,5-triphosphate; VGCC, voltage-gated calcium channel; ACh, acetylcholine; mAChR, muscarinic acetylcholine receptor; TRITC, tetramethylrhodamine isothiocyanate.
REFERENCES
- 1.Kraft R, Krause P, Jung S, Basrai D, Liebmann L, Bolz J, Patt S. Pfluegers Arch. 2003;446:248–255. doi: 10.1007/s00424-003-1012-4. [DOI] [PubMed] [Google Scholar]
- 2.Bordey A, Sontheimer H, Trouslard J. J. Membr. Biol. 2000;176:31–40. doi: 10.1007/s00232001073. [DOI] [PubMed] [Google Scholar]
- 3.Ransom CB, O’Neal JT, Sontheimer H. J. Neurosci. 2001;21:7674–7683. doi: 10.1523/JNEUROSCI.21-19-07674.2001. [DOI] [PMC free article] [PubMed] [Google Scholar]
- 4.Soroceanu L, Manning TJ, Jr, Sontheimer H. J. Neurosci. 1999;19:5942–5954. doi: 10.1523/JNEUROSCI.19-14-05942.1999. [DOI] [PMC free article] [PubMed] [Google Scholar]
- 5.Weaver AK, Bomben VC, Sontheimer H. Glia. 2006;54:223–233. doi: 10.1002/glia.20364. [DOI] [PMC free article] [PubMed] [Google Scholar]
- 6.Liu X, Chang Y, Reinhart PH, Sontheimer H, Chang Y. J. Neurosci. 2002;22:1840–1849. doi: 10.1523/JNEUROSCI.22-05-01840.2002. [DOI] [PMC free article] [PubMed] [Google Scholar]
- 7.Olsen ML, Weaver AK, Ritch PS, Sontheimer H. J. Neurosci. Res. 2005;81:179–189. doi: 10.1002/jnr.20543. [DOI] [PMC free article] [PubMed] [Google Scholar]
- 8.Weaver AK, Liu X, Sontheimer H. J Neurosci. Res. 2004;78:224–234. doi: 10.1002/jnr.20240. [DOI] [PMC free article] [PubMed] [Google Scholar]
- 9.Ransom CB, Liu X, Sontheimer H. Glia. 2002;38:281–291. doi: 10.1002/glia.10064. [DOI] [PubMed] [Google Scholar]
- 10.Grunnet M, Kaufmann WA. J. Biol. Chem. 2004;279:36445–36453. doi: 10.1074/jbc.M402254200. [DOI] [PubMed] [Google Scholar]
- 11.Simons K, Ikonen E. Nature. 1997;387:569–572. doi: 10.1038/42408. [DOI] [PubMed] [Google Scholar]
- 12.Simons K, Toomre D. Nat. Rev. Mol. Cell Biol. 2000;1:31–39. doi: 10.1038/35036052. [DOI] [PubMed] [Google Scholar]
- 13.Delling M, Wischmeyer E, Dityatev A, Sytnyk V, Veh RW, Karschin A, Schachner M. J. Neurosci. 2002;22:7154–7164. doi: 10.1523/JNEUROSCI.22-16-07154.2002. [DOI] [PMC free article] [PubMed] [Google Scholar]
- 14.Romanenko VG, Rothblat GH, Levitan I. Biophys. J. 2002;83:3211–3222. doi: 10.1016/S0006-3495(02)75323-X. [DOI] [PMC free article] [PubMed] [Google Scholar]
- 15.Yarbrough TL, Lu T, Lee HC, Shibata EF. Circ. Res. 2002;90:443–449. doi: 10.1161/hh0402.105177. [DOI] [PubMed] [Google Scholar]
- 16.Lockwich TP, Liu X, Singh BB, Jadlowiec J, Weiland S, Ambudkar IS. J. Bio. Chem. 2000;275:11934–11942. doi: 10.1074/jbc.275.16.11934. [DOI] [PubMed] [Google Scholar]
- 17.Brady JD, Rich TC, Le X, Stafford K, Fowler CJ, Lynch L, Karpen JW, Brown RL, Martens JR. Mol. Pharmacol. 2004;65:503–511. doi: 10.1124/mol.65.3.503. [DOI] [PubMed] [Google Scholar]
- 18.Vial C, Evans RJ. J. Bio. Chem. 2005;280:30705–30711. doi: 10.1074/jbc.M504256200. [DOI] [PMC free article] [PubMed] [Google Scholar]
- 19.Sampson LJ, Hayabuchi Y, Standen NB, Dart C. Circ. Res. 2004;95:1012–1018. doi: 10.1161/01.RES.0000148634.47095.ab. [DOI] [PubMed] [Google Scholar]
- 20.Hamill OP, Marty A, Neher E, Sakmann B, Sigworth FJ. Pfluegers Arch. 1981;391:85–100. doi: 10.1007/BF00656997. [DOI] [PubMed] [Google Scholar]
- 21.Orlandi PA, Fishman PH. J. Cell Biol. 1998;141:905–915. doi: 10.1083/jcb.141.4.905. [DOI] [PMC free article] [PubMed] [Google Scholar]
- 22.Rujoi M, Jin J, Borchman D, Tang D, Yappert MC. Investig. Ophthalmol. Vis. Sci. 2003;44:1634–1642. doi: 10.1167/iovs.02-0786. [DOI] [PubMed] [Google Scholar]
- 23.Hartel S, Diehl HA, Ojeda F. Anal. Biochem. 1998;258:277–284. doi: 10.1006/abio.1998.2594. [DOI] [PubMed] [Google Scholar]
- 24.Christian AE, Haynes MP, Phillips MC, Rothblat GH. J. Lipid Res. 1997;38:2264–2272. [PubMed] [Google Scholar]
- 25.Kilsdonk EP, Yancey PG, Stoudt GW, Bangerter FW, Johnson WJ, Phillips MC, Rothblat GH. J. Biol. Chem. 1995;270:17250–17256. doi: 10.1074/jbc.270.29.17250. [DOI] [PubMed] [Google Scholar]
- 26.Atger VM, de la Llera MM, Stoudt GW, Rodrigueza WV, Phillips MC, Rothblat GH. J. Clin. Investig. 1997;99:773–780. doi: 10.1172/JCI119223. [DOI] [PMC free article] [PubMed] [Google Scholar]
- 27.Latour I, Louw DF, Beedle AM, Hamid J, Sutherland GR, Zamponi GW. Glia. 2004;48:112–119. doi: 10.1002/glia.20063. [DOI] [PubMed] [Google Scholar]
- 28.Kunert-Radek J, Stepien H, Radek A, Lyson K, Pawlikowski M. Acta Neurol. Scand. 1989;79:166–169. doi: 10.1111/j.1600-0404.1989.tb03731.x. [DOI] [PubMed] [Google Scholar]
- 29.Wellman GC, Nelson MT. Cell Calcium. 2003;34:211–229. doi: 10.1016/s0143-4160(03)00124-6. [DOI] [PubMed] [Google Scholar]
- 30.Patterson RL, Boehning D, Snyder SH. Annu. Rev. Biochem. 2004;73:18. doi: 10.1146/annurev.biochem.73.071403.161303. [DOI] [PubMed] [Google Scholar]
- 31.Perez GJ, Bonev AD, Patlak JB, Nelson MT. J. Gen. Physiol. 1999;113:229–238. doi: 10.1085/jgp.113.2.229. [DOI] [PMC free article] [PubMed] [Google Scholar]
- 32.Catlin MC, Kavanagh TJ, Costa LG. Cytometry. 2000;41:123–132. [PubMed] [Google Scholar]
- 33.Guizzetti M, Wei M, Costa LG. Eur. J. Pharmacol. 1998;359:223–233. doi: 10.1016/s0014-2999(98)00620-7. [DOI] [PubMed] [Google Scholar]
- 34.Guizzetti M, Costa LG. Neuroreport. 2001;12:1639–1642. doi: 10.1097/00001756-200106130-00025. [DOI] [PubMed] [Google Scholar]
- 35.Doheny HC, Lynch CM, Smith TJ, Morrison JJ. J. Clin. Endocrinol. Metab. 2005;90:5786–5796. doi: 10.1210/jc.2005-0574. [DOI] [PubMed] [Google Scholar]
- 36.Liu G, Shi J, Yang L, Cao L, Park SM, Cui J, Marx SO. EMBO J. 2004;23:2196–2205. doi: 10.1038/sj.emboj.7600228. [DOI] [PMC free article] [PubMed] [Google Scholar]
- 37.Weerth SH, Holtzclaw LA, Russell JT. Cell Calcium. 2007;41:155–167. doi: 10.1016/j.ceca.2006.06.006. [DOI] [PubMed] [Google Scholar]
- 38.Ningaraj NS, Rao M, Hashizume K, Asotra K, Black KL. J. Pharmacol. Exp. Ther. 2002;301:838–851. doi: 10.1124/jpet.301.3.838. [DOI] [PubMed] [Google Scholar]
- 39.Filosa JA, Bonev AD, Straub SV, Meredith AL, Wilkerson MK, Aldrich RW, Nelson MT. Nat. Neurosci. 2006;9:1397–1403. doi: 10.1038/nn1779. [DOI] [PubMed] [Google Scholar]
- 40.Pike LJ. Biochim. Biophys. Acta. 2005;1746:260–273. doi: 10.1016/j.bbamcr.2005.05.005. [DOI] [PubMed] [Google Scholar]
- 41.Pike LJ, Casey L. J. Biol. Chem. 1996;271:26453–26456. doi: 10.1074/jbc.271.43.26453. [DOI] [PubMed] [Google Scholar]
- 42.McFerrin MB, Sontheimer H. Neuron Glia Biol. 2006;2:39–49. doi: 10.1017/S17440925X06000044. [DOI] [PMC free article] [PubMed] [Google Scholar]
- 43.Chang HM, Reitstetter R, Gruener R. J. Membr. Biol. 1995;145:13–19. doi: 10.1007/BF00233303. [DOI] [PubMed] [Google Scholar]
- 44.Chang HM, Reitstetter R, Mason RP, Gruener R. J. Membr. Biol. 1995;143:51–63. doi: 10.1007/BF00232523. [DOI] [PubMed] [Google Scholar]
- 45.Lam RS, Shaw AR, Duszyk m. Biochim. Biophys. Acta. 2004;1667:241–248. doi: 10.1016/j.bbamem.2004.11.004. [DOI] [PubMed] [Google Scholar]
- 46.Wang XL, Ye D, Peterson TE, Cao S, Shah VH, Katusic ZS, Sieck GC, Lee HC. J. Biol. Chem. 2005;280:11656–11664. doi: 10.1074/jbc.M410987200. [DOI] [PubMed] [Google Scholar]
- 47.Brainard AM, Miller AJ, Martens JR, England SK. Am. J. Physiol. 2005;289:C49–C57. doi: 10.1152/ajpcell.00399.2004. [DOI] [PubMed] [Google Scholar]
- 48.Ohi Y, Yamamura H, Nagano N, Ohya S, Muraki K, Watanabe M, Imaizumi Y. J. Physiol. (Lond.) 2001;534:2–26. [Google Scholar]
- 49.Jaggar JH, Wellman GC, Heppner TJ, Porter VA, Perez GJ, Gollasch M, Kleppisch T, Rubart M, Stevenson AS, Lederer WJ, Knot HJ, Bonev AD, Nelson MT. Acta Physiol. Scand. 1998;164:577–587. doi: 10.1046/j.1365-201X.1998.00462.x. [DOI] [PubMed] [Google Scholar]
- 50.Bomben VC, Sontheimer H. Cell Prolif. 2007 doi: 10.1111/j.1365-2184.2007.00504.x. in press. [DOI] [PMC free article] [PubMed] [Google Scholar]
Associated Data
This section collects any data citations, data availability statements, or supplementary materials included in this article.